With a still-hot real estate market driving demand for construction, many construction companies are eager to fill roles and keep projects moving ahead. But as is the case in many segments of the economy, the COVID-19 pandemic’s impact has made it more difficult for employers to attract and retain labor, and the construction industry is still struggling to hire.
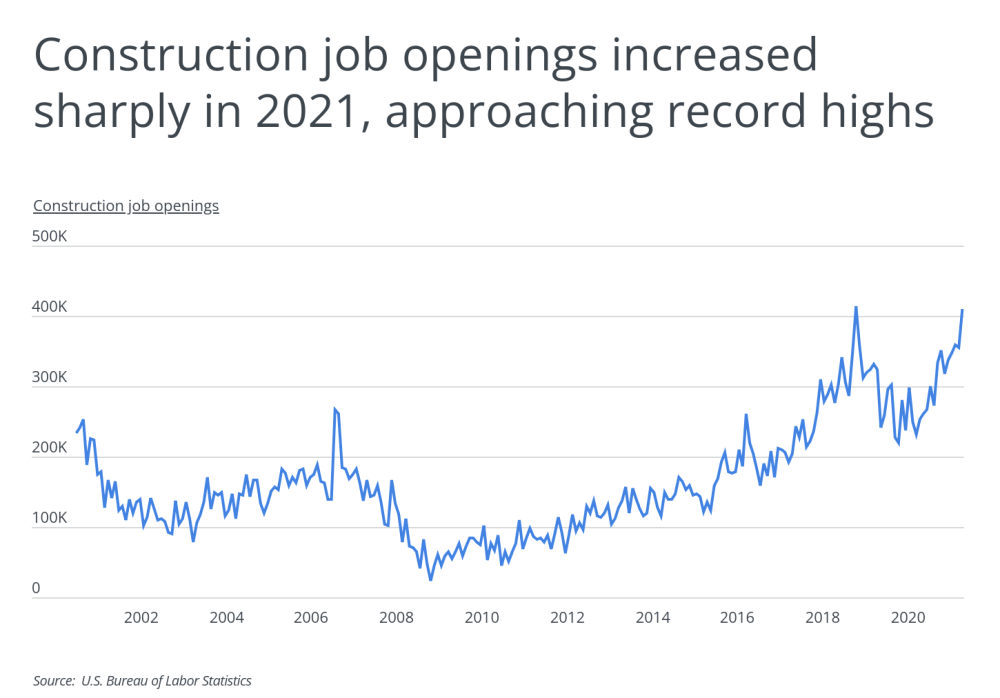
Recent data from the Bureau of Labor Statistics found that the construction industry had 410,000 open positions, even with the economy continuing to recover and hiring picking up again last fall. These issues only exacerbated existing concerns in the industry about a shortage of qualified labor: one industry association recently estimated that America needs to hire 2.2 million more construction workers to keep up with demand between now and 2024.
While the number of open jobs in construction has been fairly high for several years, demand since the pandemic began has reversed a decline in the number of open jobs in the industry that began in 2019. Open positions peaked at 414,000 in April 2019 and then began to fall sharply. The onset of the COVID-19 pandemic soon after sent job openings as low as 220,000 in April 2020, when many initial COVID shutdowns were still in place. However, the last year has brought renewed demand for construction roles: available openings rebounded to more than 300,000 in January 2021 and more than 400,000 in October 2021.
Across the economy, the need for labor has driven an increase in wages to attract workers, and construction is no different. Average hourly wages for construction workers increased by more than 4% from January to December 2021—a strong boost in wages for a field that already tends to pay higher than other industries with similar training and education requirements.
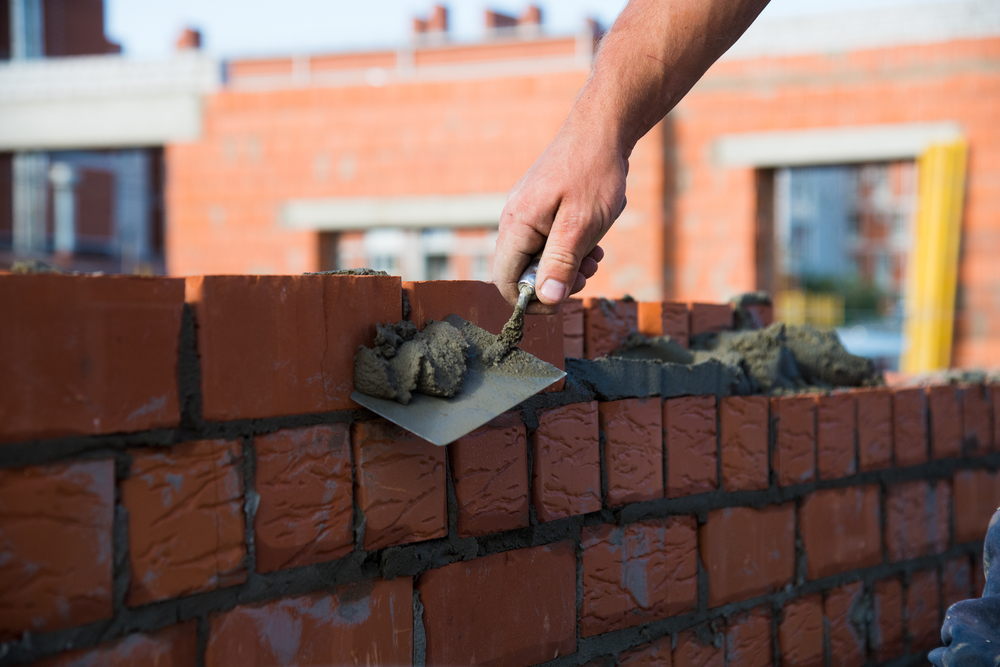
Among the construction roles poised to benefit from these trends are masons. Masons are the construction professionals tasked with pouring, strengthening, smoothing, and finishing concrete on construction jobs, as might be required for foundations, floors, sidewalks, or other components of a construction project. As of 2020, the BLS reported that masons had a median wage of $46,000 per year, with a total of more than 195,000 workers occupying masonry roles. With recent trends in the industry driving higher wages and a greater need for laborers, masons are likely to see continued growth in their field.
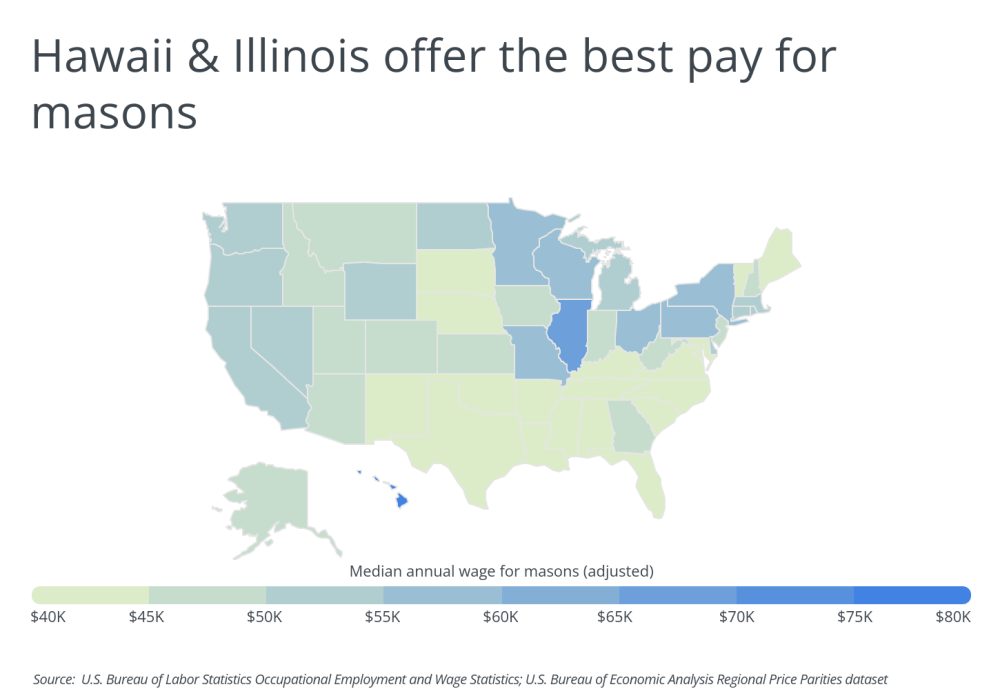
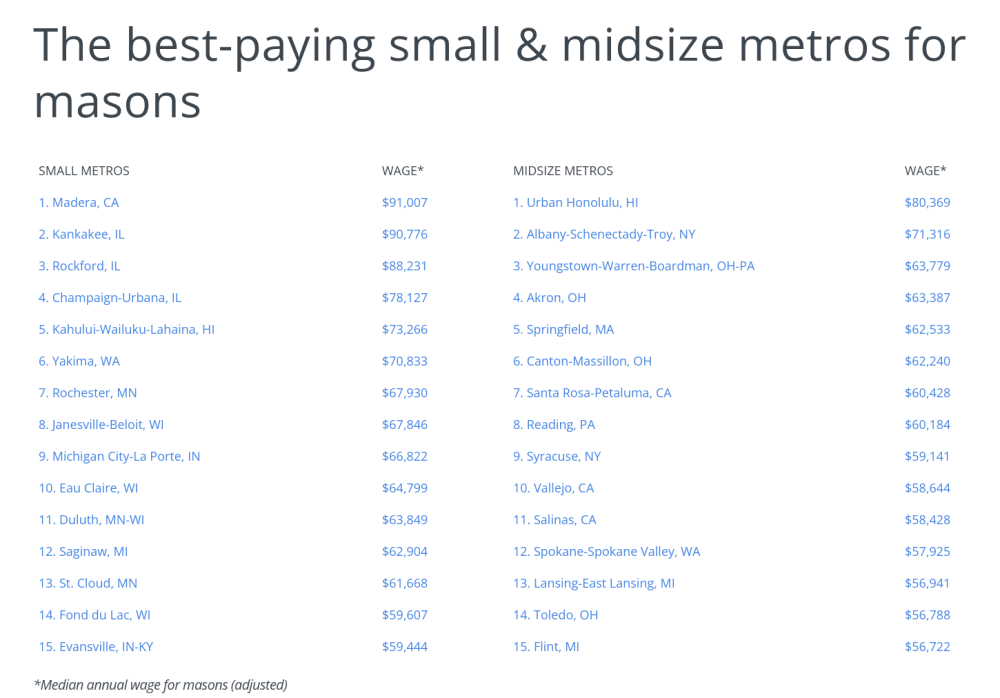
As with most construction professions, there is demand for masons nationwide, but some locations offer better career prospects than others. In terms of compensation, the top-paying states for masons are Hawaii, with a cost-of-living-adjusted median annual wage of $80,446, and Illinois at $66,915—the only two states where the typical mason earns more than $60,000 annually. These states tend to be among the best-paying for construction due to their strong unionization and prevailing wage laws. The opposite is true of lower-paying states, with Texas ($38,392) and Florida ($38,858) being the lowest-paying and the only two to have an adjusted median annual wage below $40,000. At the metro level, most of the leading locations for masons’ pay are found in the Midwest and Northeast, with a handful of cities on the West Coast also ranking highly.
RELATED
Are you planning a home improvement project this spring? It might be smart, and ultimately less expensive, to hire a general contractor to help you plan and execute the work. Learn more about contractors—and whether you should hire one—in our general contractors guide.
The data used in this analysis is from the U.S. Bureau of Economic Analysis and the U.S. Bureau of Labor Statistics. To determine the locations with the best pay for masons, researchers at Porch calculated the median annual wage for cement masons and concrete finishers, adjusted for cost-of-living differences. In the event of a tie, the location with the higher unadjusted median annual wage was ranked higher. To improve relevance, only metropolitan areas with at least 100,000 residents were included. Additionally, metros were grouped into cohorts based on population size: small (100,000–349,999), midsize (350,000–999,999), and large (1,000,000 or more).
Here are the best-paying metropolitan areas for masons.
The Best-Paying Large Metros for Masons

Photo Credit: Bogdan Vacarciuc / Shutterstock
15. San Francisco-Oakland-Berkeley, CA
- Median annual wage for masons (adjusted): $53,203
- Median annual wage for masons (actual): $62,460
- Median annual wage for all construction workers (actual): $71,420
- Concentration of mason workers (compared to average): -6.0%
- Cost of living (compared to average): +17.4%
DID YOU KNOW?
Porch specializes in matching homeowners with experienced, local professionals—including handymen. So the next time you’re looking for help with odd jobs around the house like adding kitchen shelves or power washing your driveway, find an affordable handyman near you with Porch.
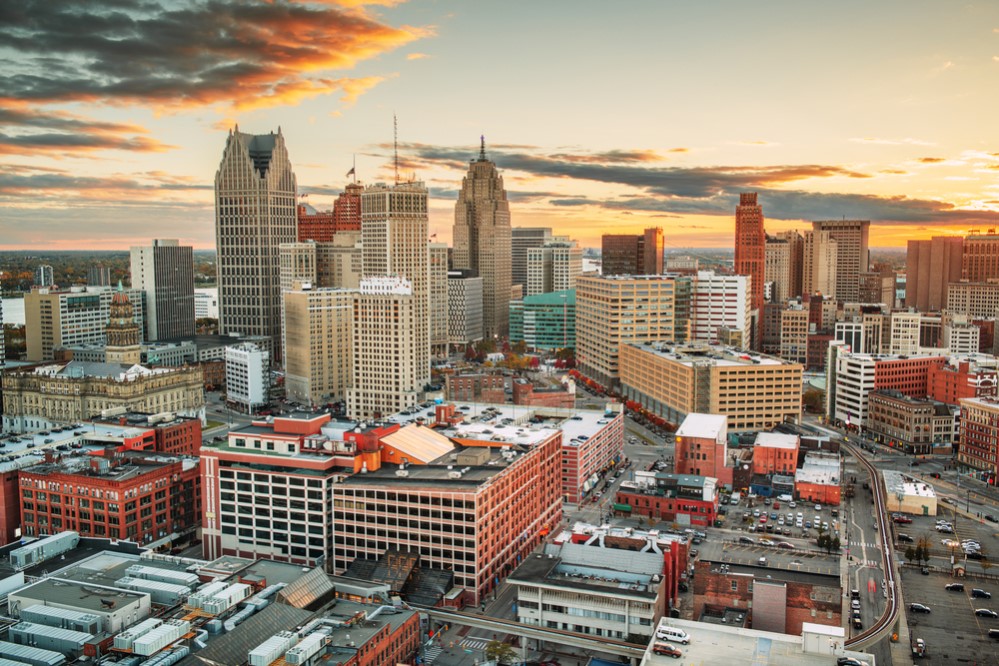 Photo Credit: Sean Pavone / Shutterstock
14. Detroit-Warren-Dearborn, MI
- Median annual wage for masons (adjusted): $54,089
- Median annual wage for masons (actual): $52,520
- Median annual wage for all construction workers (actual): $55,980
- Concentration of mason workers (compared to average): -33.0%
- Cost of living (compared to average): -2.9%

Photo Credit: Dave Riewe / Shutterstock
13. Minneapolis-St. Paul-Bloomington, MN-WI
- Median annual wage for masons (adjusted): $54,961
- Median annual wage for masons (actual): $56,720
- Median annual wage for all construction workers (actual): $66,830
- Concentration of mason workers (compared to average): +0.0%
- Cost of living (compared to average): +3.2%

Photo Credit: Rosamar / Shutterstock
12. Cincinnati, OH-KY-IN
- Median annual wage for masons (adjusted): $54,973
- Median annual wage for masons (actual): $51,400
- Median annual wage for all construction workers (actual): $49,640
- Concentration of mason workers (compared to average): -23.0%
- Cost of living (compared to average): -6.5%

Photo Credit: Feoktistoff / Shutterstock
11. Sacramento-Roseville-Folsom, CA
- Median annual wage for masons (adjusted): $55,080
- Median annual wage for masons (actual): $58,440
- Median annual wage for all construction workers (actual): $55,250
- Concentration of mason workers (compared to average): +42.0%
- Cost of living (compared to average): +6.1%
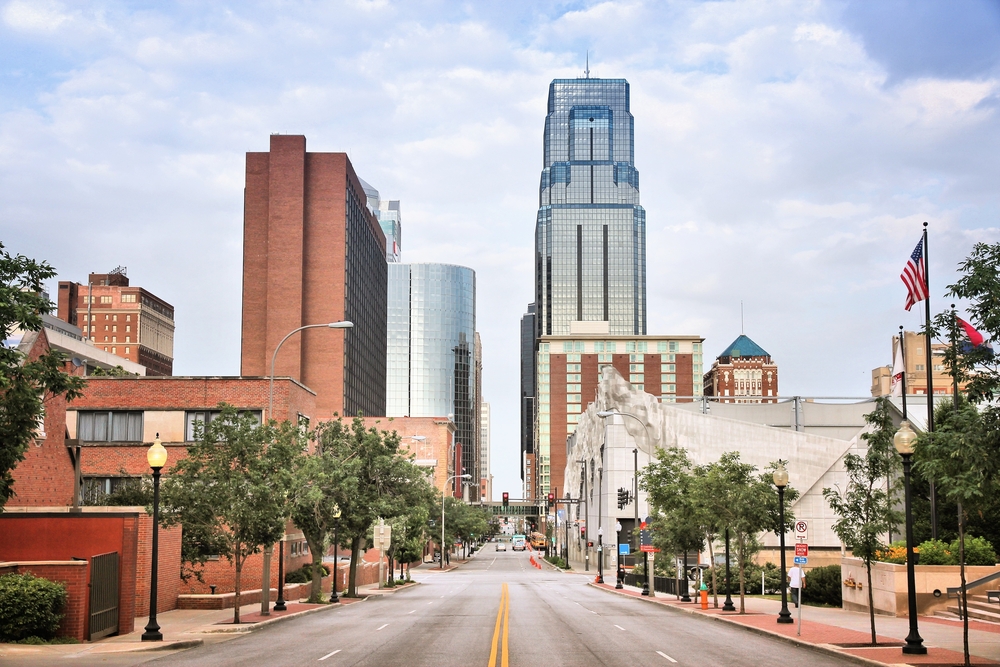
Photo Credit: Tupungato / Shutterstock
10. Kansas City, MO-KS
- Median annual wage for masons (adjusted): $55,565
- Median annual wage for masons (actual): $52,620
- Median annual wage for all construction workers (actual): $53,510
- Concentration of mason workers (compared to average): +83.0%
- Cost of living (compared to average): -5.3%

Photo Credit: Richard Cavalleri / Shutterstock
9. Providence-Warwick, RI-MA
- Median annual wage for masons (adjusted): $56,156
- Median annual wage for masons (actual): $56,830
- Median annual wage for all construction workers (actual): $54,590
- Concentration of mason workers (compared to average): -42.0%
- Cost of living (compared to average): +1.2%
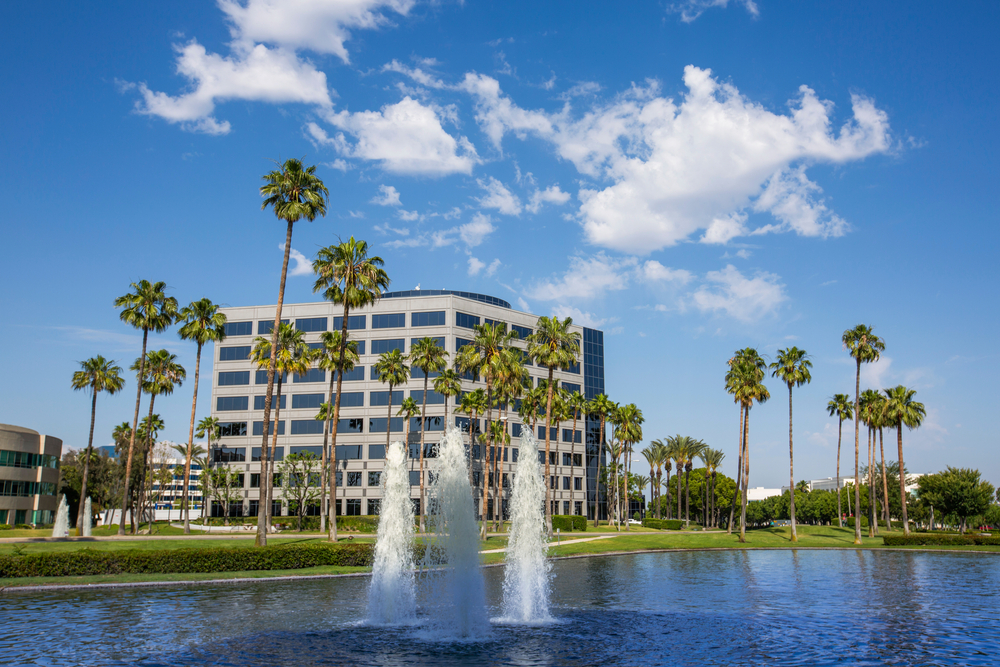
Photo Credit: Matt Gush / Shutterstock
8. Riverside-San Bernardino-Ontario, CA
- Median annual wage for masons (adjusted): $57,580
- Median annual wage for masons (actual): $59,710
- Median annual wage for all construction workers (actual): $52,580
- Concentration of mason workers (compared to average): +128.0%
- Cost of living (compared to average): +3.7%

Photo Credit: Gang Liu / Shutterstock
7. Philadelphia-Camden-Wilmington, PA-NJ-DE-MD
- Median annual wage for masons (adjusted): $57,908
- Median annual wage for masons (actual): $59,240
- Median annual wage for all construction workers (actual): $57,890
- Concentration of mason workers (compared to average): -44.0%
- Cost of living (compared to average): +2.3%

Photo Credit: Rudy Balasko / Shutterstock
6. Cleveland-Elyria, OH
- Median annual wage for masons (adjusted): $63,161
- Median annual wage for masons (actual): $58,740
- Median annual wage for all construction workers (actual): $55,450
- Concentration of mason workers (compared to average): -36.0%
- Cost of living (compared to average): -7.0%

Photo Credit: f11photo / Shutterstock
5. Milwaukee-Waukesha, WI
- Median annual wage for masons (adjusted): $66,715
- Median annual wage for masons (actual): $63,980
- Median annual wage for all construction workers (actual): $60,930
- Concentration of mason workers (compared to average): +9.0%
- Cost of living (compared to average): -4.1%

Photo Credit: picsbyst / Shutterstock
4. St. Louis, MO-IL
- Median annual wage for masons (adjusted): $68,234
- Median annual wage for masons (actual): $65,300
- Median annual wage for all construction workers (actual): $67,400
- Concentration of mason workers (compared to average): -31.0%
- Cost of living (compared to average): -4.3%

Photo Credit: Jeremy Janus / Shutterstock
3. Seattle-Tacoma-Bellevue, WA
- Median annual wage for masons (adjusted): $69,589
- Median annual wage for masons (actual): $77,940
- Median annual wage for all construction workers (actual): $67,500
- Concentration of mason workers (compared to average): +0.0%
- Cost of living (compared to average): +12.0%
TRENDING
Did this winter do a number on your home carpet? With spring right around the corner, try our carpet installation cost calculator to find out what it would cost to replace it.
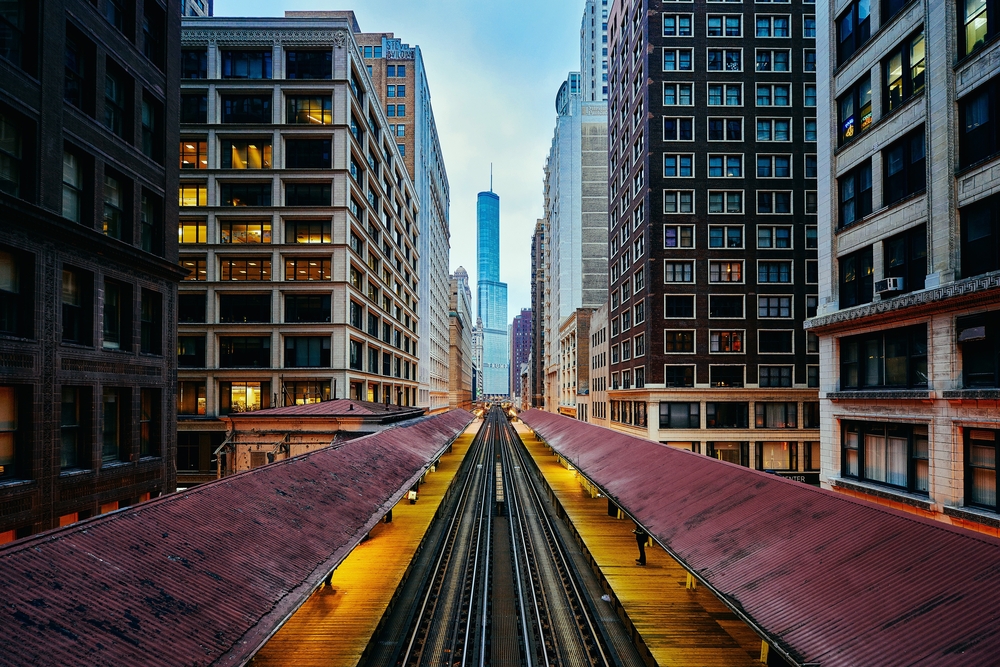
Photo Credit: Jonathan Siegel / Shutterstock
2. Chicago-Naperville-Elgin, IL-IN-WI
- Median annual wage for masons (adjusted): $71,002
- Median annual wage for masons (actual): $74,410
- Median annual wage for all construction workers (actual): $79,110
- Concentration of mason workers (compared to average): -26.0%
- Cost of living (compared to average): +4.8%

Photo Credit: ESB Professional / Shutterstock
1. Pittsburgh, PA
- Median annual wage for masons (adjusted): $74,389
- Median annual wage for masons (actual): $71,190
- Median annual wage for all construction workers (actual): $53,410
- Concentration of mason workers (compared to average): -66.0%
- Cost of living (compared to average): -4.3%
Detailed Findings & Methodology
The data used in this analysis is from the U.S. Bureau of Economic Analysis Regional Price Parities dataset and the U.S. Bureau of Labor Statistics Occupational Employment and Wage Statistics. To determine the locations with the best pay for masons, researchers calculated the median annual wage for cement masons and concrete finishers, adjusted for cost-of-living differences. In the event of a tie, the location with the higher unadjusted median annual wage was ranked higher. To improve relevance, only metropolitan areas with at least 100,000 residents were included. Additionally, metros were grouped into cohorts based on population size: small (100,000–349,999), midsize (350,000–999,999), and large (1,000,000 or more).


