
Whether it is millennials pursuing their dream of home ownership, or work-at-home professionals seeking to relocate to more desirable locales, home buyers across the nation are facing higher prices and reduced inventory. As they say in the real estate business, the price of a home depends on “location, location, location,” which means the severity of this home shortage varies greatly across American cities, and across the 50 states.
After the COVID-19 lockdowns of spring 2020 were gradually lifted, private home sales across the nation increased sharply. Yet, new housing starts fell by 40% that same spring and have only recently recovered to pre-pandemic levels. This has contributed to today’s hyper-competitive home buying market.
The extent of the residential housing market shortage can be illustrated by the length of time a house is listed on the market before an offer is accepted. In March of 2012, the median number of days that an American home sat on the market was approximately three months (93 days). By the summer of 2021, the median number of days for a pending home sale was just over two weeks (15 days). Indeed, the percentage of American homes selling within only two weeks of initial listing increased from less than a third in 2012 to over half of all homes listed in 2021.

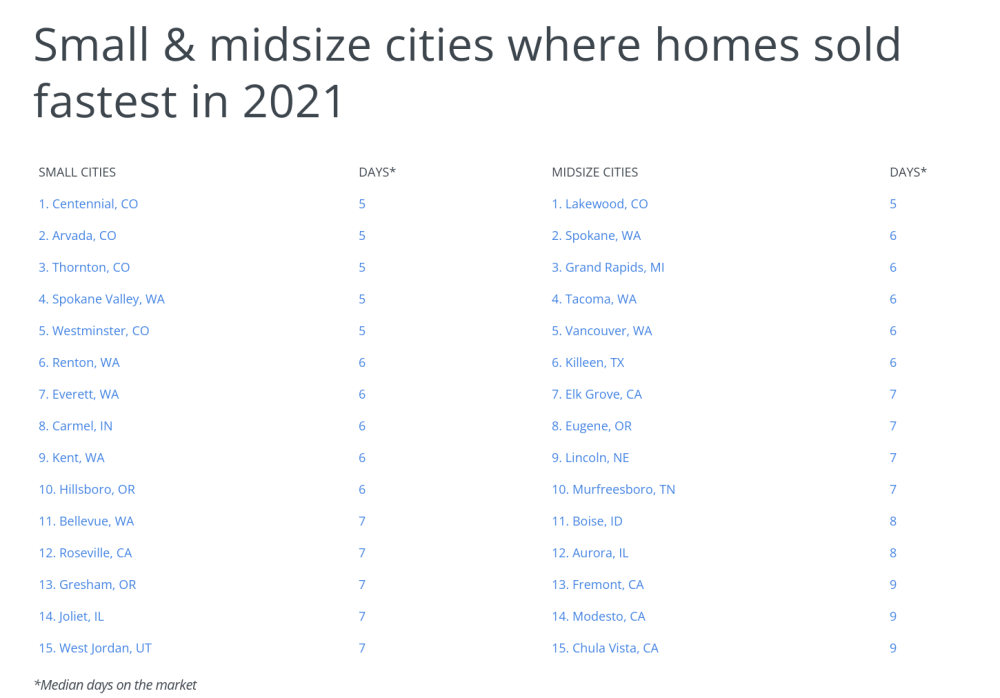
Home sales data from 2021 reveals how much the pandemic’s impact on the housing market has varied across the country. At the state level, homes in Washington, Nebraska, and Indiana have been moving fastest. The median days on the market for each was less than 10 days in 2021. Other hypercompetitive states include Colorado, Oklahoma, Oregon, and Utah, where homes were typically off the market in 14 days. These states contrast with Vermont, Hawaii, and Mississippi, which are the only states where the typical home remained on the market for more than 60 days before an offer was accepted or the home was eventually delisted. Interestingly, how quickly homes moved in 2021 showed almost no correlation with home price at the state level.

A wide range of cities from the aforementioned states reported homes selling quickly in 2021 as well. In addition, homes sold at record speeds in a number of California cities, despite California as a whole ranking in the middle of the pack among states. Similar to the state level analysis, it was a mix of both high-price and more affordable locations in which homes sold fastest in 2021.
TRENDING
A general contractor will know the ins and outs of the business, and will be sure to work with subcontractors they trust to get the work you need done efficiently and on time. Find a contractor near you to help you complete your next home project.
The data used in the analysis is from Redfin. To determine the cities where homes are selling fastest, researchers at Porch calculated the median days on the market in each location using sales data from 2021. In the event of a tie, the city with the higher share of listings off the market in under two weeks was ranked above. Only locations with at least 100,000 residents and available data from Redfin were included in the study.
Here are the U.S. cities where homes sold fastest in 2021.
Large Cities Where Homes Sold Fastest in 2021

Photo Credit: Sundry Photography / Shutterstock
15. Oakland, CA
- Median days on the market: 15
- Share of listings off the market in <2 weeks: 58.8%
- Median sale price: $894,359
- Average sale-to-list price ratio: 114.9%
TRENDING
Has the wet and windy winter weather been unkind to your perimeter fence? A new wood fence may not be as expensive as you think. Check out our guide to wood privacy fences, and learn what the cost of a wood fence installation would run for your home.
 Photo Credit: Matt Gush / Shutterstock
14. Bakersfield, CA
- Median days on the market: 13
- Share of listings off the market in <2 weeks: 60.1%
- Median sale price: $325,561
- Average sale-to-list price ratio: 100.8%
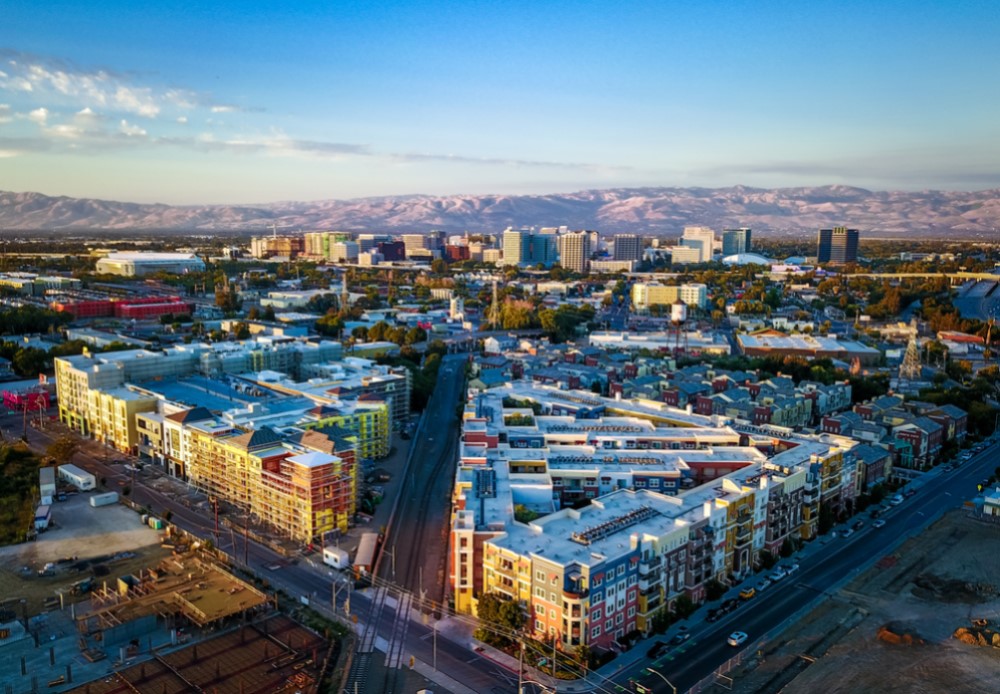 Photo Credit: Uladzik Kryhin / Shutterstock
13. San Jose, CA
- Median days on the market: 12
- Share of listings off the market in <2 weeks: 64.0%
- Median sale price: $1,225,662
- Average sale-to-list price ratio: 107.2%

Photo Credit: Valiik30 / Shutterstock
12. Tulsa, OK
- Median days on the market: 12
- Share of listings off the market in <2 weeks: 67.6%
- Median sale price: $201,508
- Average sale-to-list price ratio: 99.0%

Photo Credit: Lucky-photographer / Shutterstock
11. San Diego, CA
- Median days on the market: 11
- Share of listings off the market in <2 weeks: 63.8%
- Median sale price: $754,396
- Average sale-to-list price ratio: 102.1%
 Photo Credit: Bonnie Fink / Shutterstock
10. Tampa, FL
-
- Median days on the market: 11
- Share of listings off the market in <2 weeks: 67.0%
- Median sale price: $318,849
- Average sale-to-list price ratio: 99.6%
FUN FACT
Florida is a popular state for relocation, which is good news if you want to sell your Florida house. In fact, with an anticipated 319,000 people migrating there in 2022, Florida experienced the highest net population gain of any other state.
 Photo Credit: Xiao Zhou / Shutterstock
9. Portland, OR
- Median days on the market: 9
- Share of listings off the market in <2 weeks: 67.8%
- Median sale price: $531,007
- Average sale-to-list price ratio: 103.3%

Photo Credit: stellamc / Shutterstock
8. Fresno, CA
- Median days on the market: 9
- Share of listings off the market in <2 weeks: 68.5%
- Median sale price: $335,523
- Average sale-to-list price ratio: 99.9%

Photo Credit: Andriy Blokhin / Shutterstock
7. Sacramento, CA
- Median days on the market: 9
- Share of listings off the market in <2 weeks: 69.7%
- Median sale price: $448,584
- Average sale-to-list price ratio: 103.5%

Photo Credit: Jeremy Janus / Shutterstock
6. Seattle, WA
- Median days on the market: 9
- Share of listings off the market in <2 weeks: 72.7%
- Median sale price: $782,236
- Average sale-to-list price ratio: 103.7%

Photo Credit: Sean Pavone / Shutterstock
5. Oklahoma City, OK
- Median days on the market: 8
- Share of listings off the market in <2 weeks: 71.1%
- Median sale price: $226,298
- Average sale-to-list price ratio: 100.2%
DID YOU KNOW?
On average, it costs homeowners over $10,000 to have new vinyl siding installed on their homes, but prices vary widely by location. Here’s what you can expect your vinyl siding installation to cost in your zip code.

Photo Credit: Roschetzky Photography / Shutterstock
4. Denver, CO
- Median days on the market: 7
- Share of listings off the market in <2 weeks: 74.9%
- Median sale price: $530,620
- Average sale-to-list price ratio: 102.5%

Photo Credit: Jonathannsegal / Shutterstock
3. Omaha, NE
- Median days on the market: 6
- Share of listings off the market in <2 weeks: 73.9%
- Median sale price: $232,719
- Average sale-to-list price ratio: 102.2%

Photo Credit: Agnieszka Gaul / Shutterstock
2. Indianapolis, IN
- Median days on the market: 6
- Share of listings off the market in <2 weeks: 74.4%
- Median sale price: $205,616
- Average sale-to-list price ratio: 100.5%

Photo Credit: Jacob Boomsma / Shutterstock
1. Aurora, CO
- Median days on the market: 5
- Share of listings off the market in <2 weeks: 80.7%
- Median sale price: $432,137
- Average sale-to-list price ratio: 103.7%
Detailed Findings & Methodology
The data used in this analysis is from Redfin’s Data Center. To determine the locations where homes are selling fastest, researchers calculated median days on the market, with lower values ranked higher. In the event of a tie, the location with the greater share of listings off the market in two weeks or less was ranked higher. All statistics were calculated based on sales data from January–October of 2021. To improve relevance, only cities with at least 100,000 residents were included. Additionally, cities were grouped into cohorts based on population size: small (100,000–149,999), midsize (150,000–349,999), and large (350,000 or more). Notably, only cities and states with complete data from Redfin were included.


