The COVID-19 pandemic has shifted demographic trends in a number of ways, from lower birth rates to increased death rates to reductions in immigration. But one of the most significant changes is where people are choosing to live as they migrate within the U.S.
In the early months of the pandemic, many city dwellers left for less-populated locations where physical distancing was easier, outdoor activities were more plentiful, and living space for remote work and schooling was more affordable, or even to retired. Now, as COVID-19’s long-term effects on work become clearer, including permanent remote work arrangements and massive shifts in employees’ career preferences, flexibility in where to live and work has become critical for many workers. As a result, “second-tier cities,” suburbs, and small towns are seeing an influx of new residents looking to take advantage of their new work arrangements in more affordable locales.
On some level, however, these COVID-driven migrations are also reflective of recent pre-pandemic population trends. One of the important factors driving this trend is the affordability of real estate. While many young, highly-educated professionals in recent years have tended to cluster in major metros for their quality jobs and amenities, these locales also usually have higher costs of living. For those raising families or just seeking out affordable real estate, many of these densely populated locations now hold less appeal.
The result of this trend is that certain states have experienced much more rapid population growth than others. While major metros in states like California and New York do have appeal for young job-seekers, the states themselves have been experiencing weak or even negative population growth over the past decade. Instead, more affordable states like Texas, Florida, and Colorado have grown at a strong clip over the last ten years. More recently, they have been joined by Mountain West locations including Idaho, Nevada, Utah, and Arizona, the four fastest-growing states from 2015 to 2020.
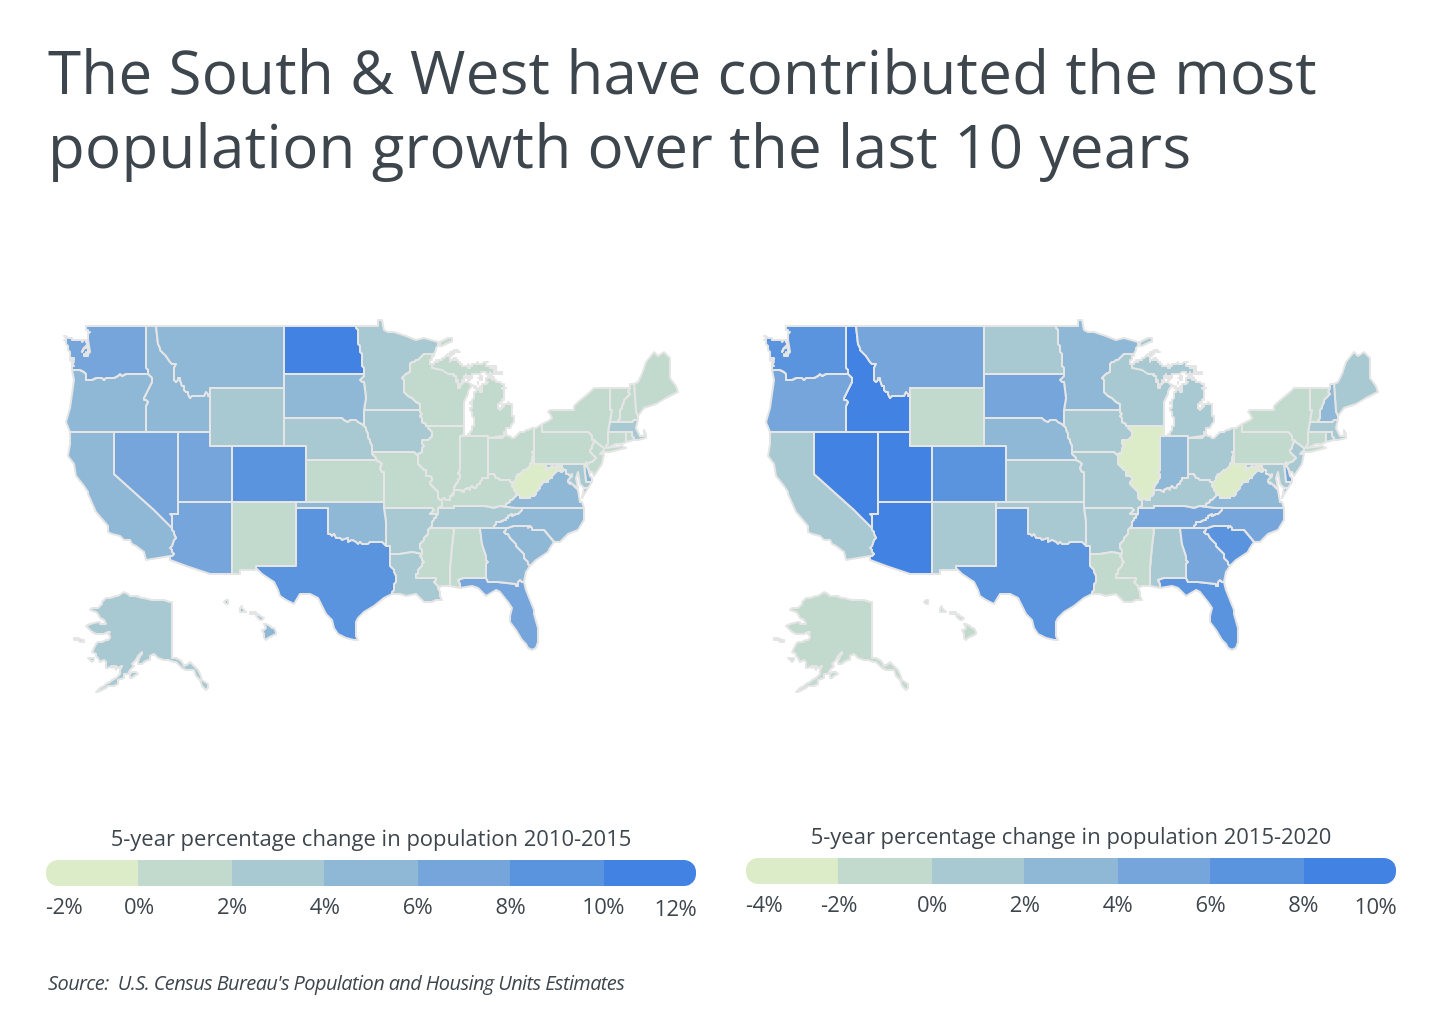
Cities in these states usually have more land available for development and zoning policies that make it easier to expand than in older, denser metros. This is important for the development of housing stock, and real estate in lower-density areas is usually more affordable as a result. While lower-density living also has its downsides—most prominently fewer transit options and longer commutes—affordable housing prices are a significant enough factor to persuade many people to choose less densely populated areas.
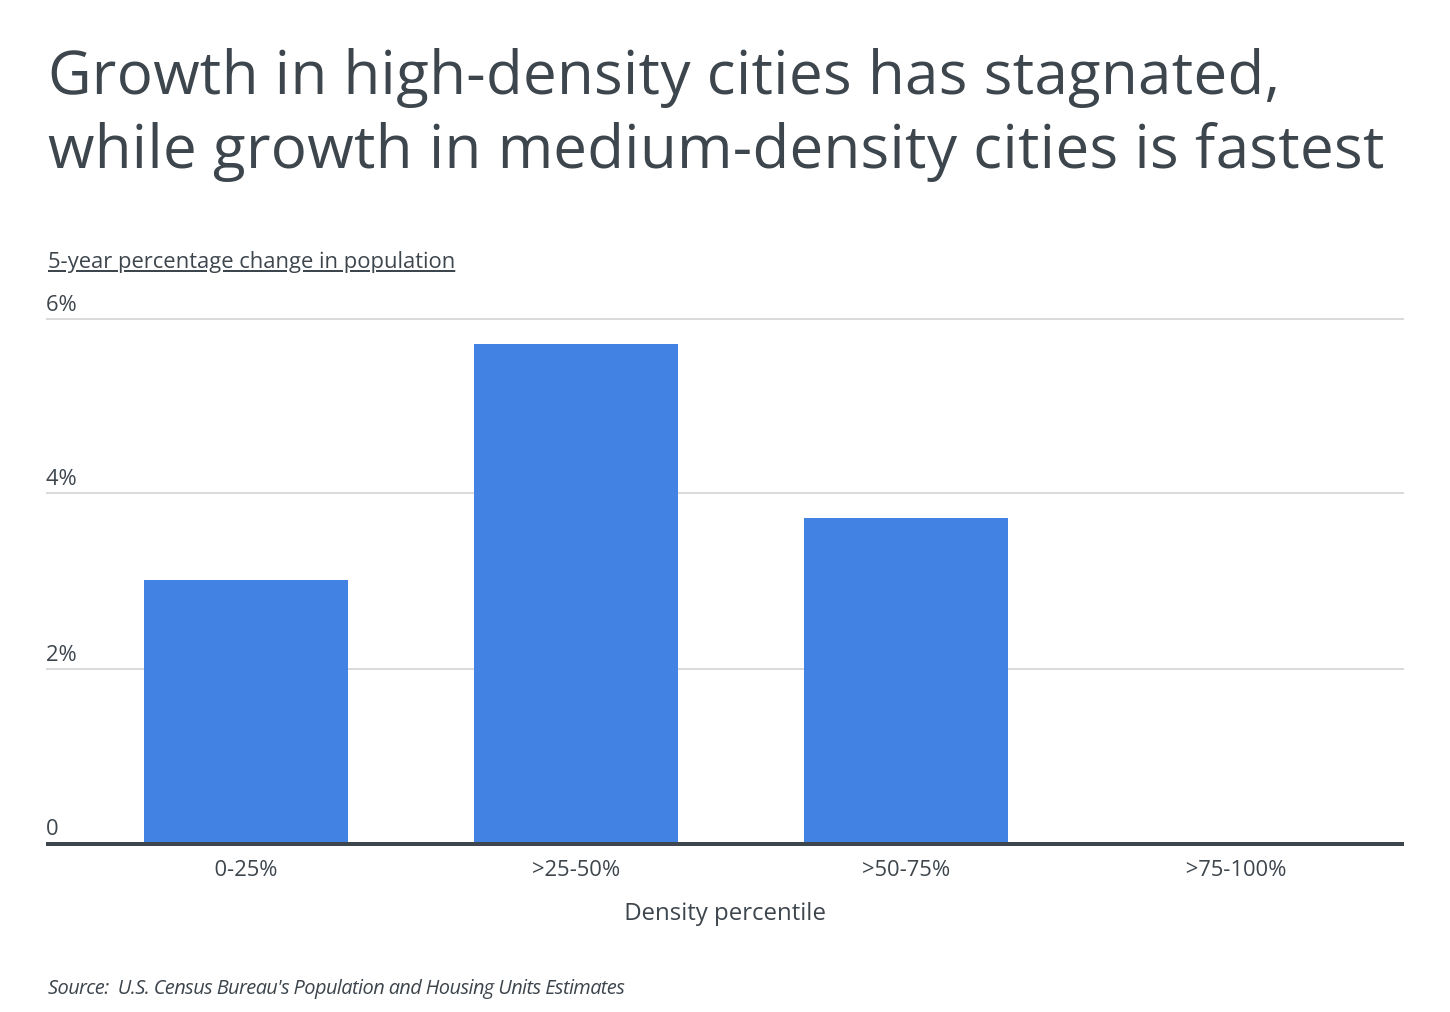
Recent data bears out this phenomenon. When cities are distributed by their population density, the most densely-populated cohort of cities has an overall 0.0% population growth over the last five years. All of the other cohorts have shown growth over the same period, led by cities in the 25-50% density cohort with a 5.7% increase in population.
TRENDING
Is the outside of your home starting to look a little dingy? Instead of a new paint job, your home might only need a good wash. You can hire a professional to do it or rent a power washer yourself. Here’s what it would cost to power wash a house.
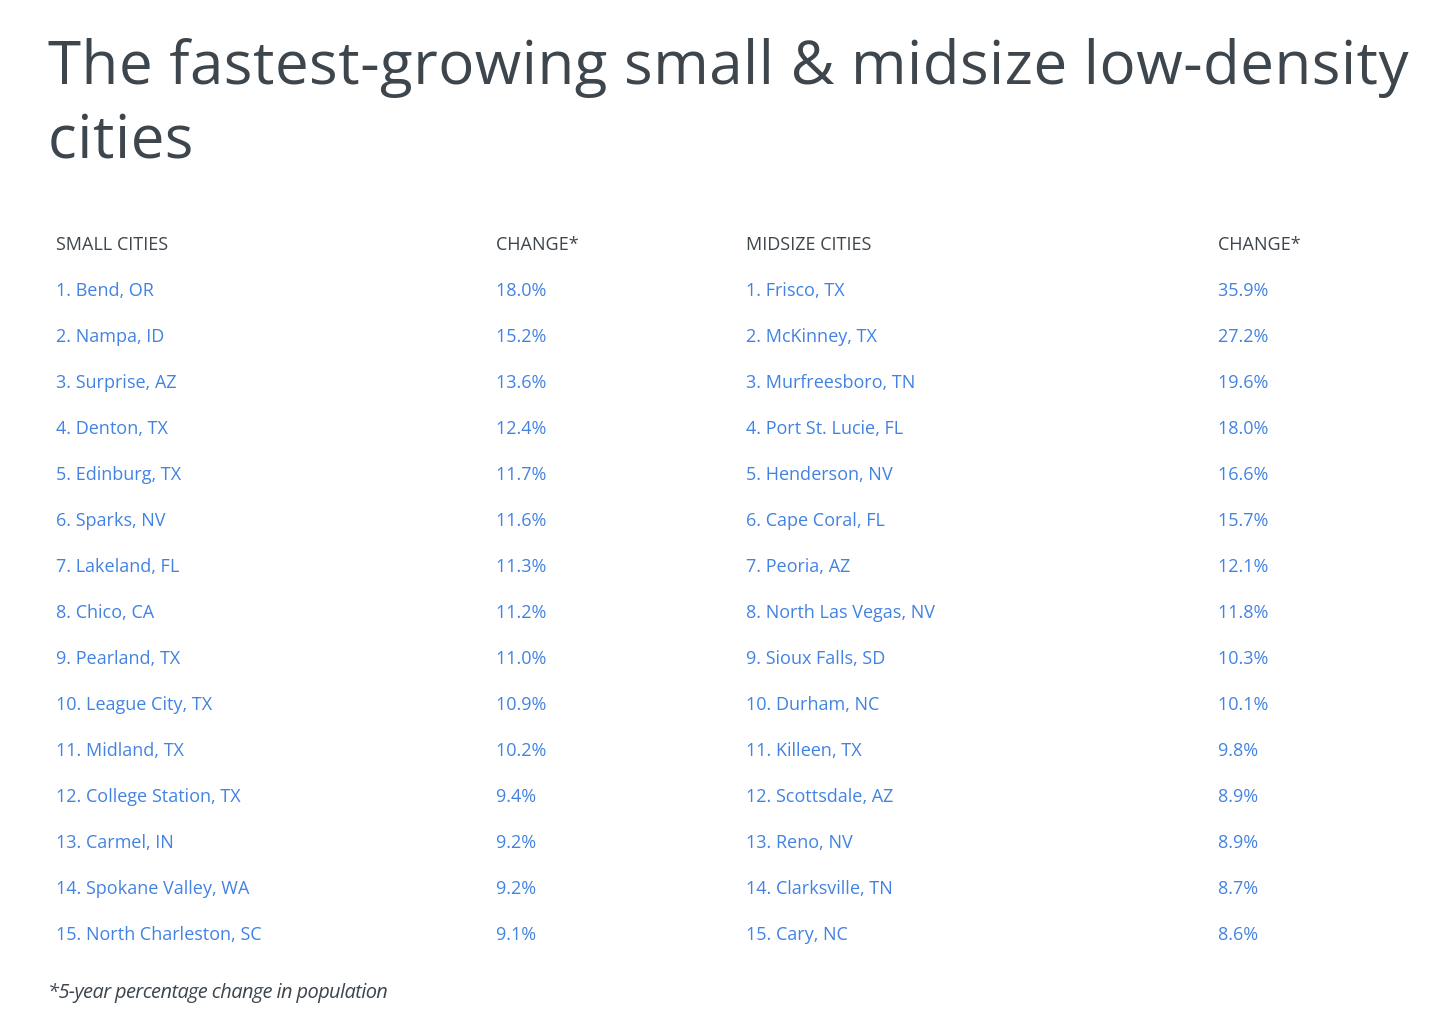
To identify the fastest-growing low-density cities, researchers at Porch used Census Bureau data to calculate the percentage change in population between 2015 and 2020, and only included those cities where the population density is lower than the median. To improve relevance, only cities with at least 100,000 people were included.
Here are the fastest-growing low-density cities.
The Fastest-Growing Large Low-Density Cities
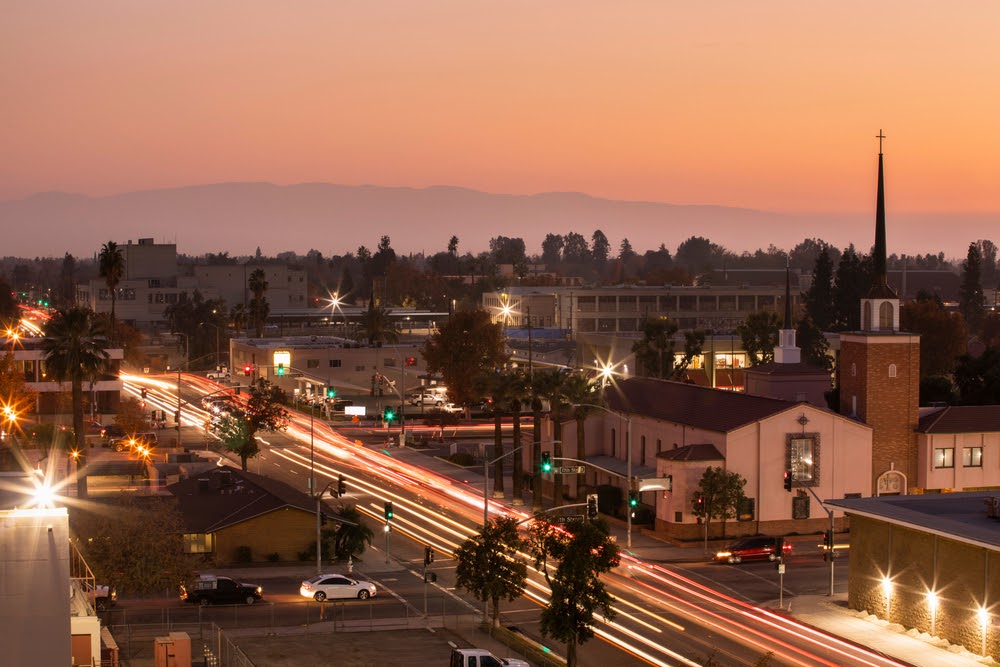
Photo Credit: Matt Gush / Shutterstock
15. Bakersfield, CA
- 5-year percentage change in population: 4.0%
- Population density (per square mile): 2,575
- Population 2020: 385,725
- Population 2015: 370,871
- Land area (square miles): 149.8
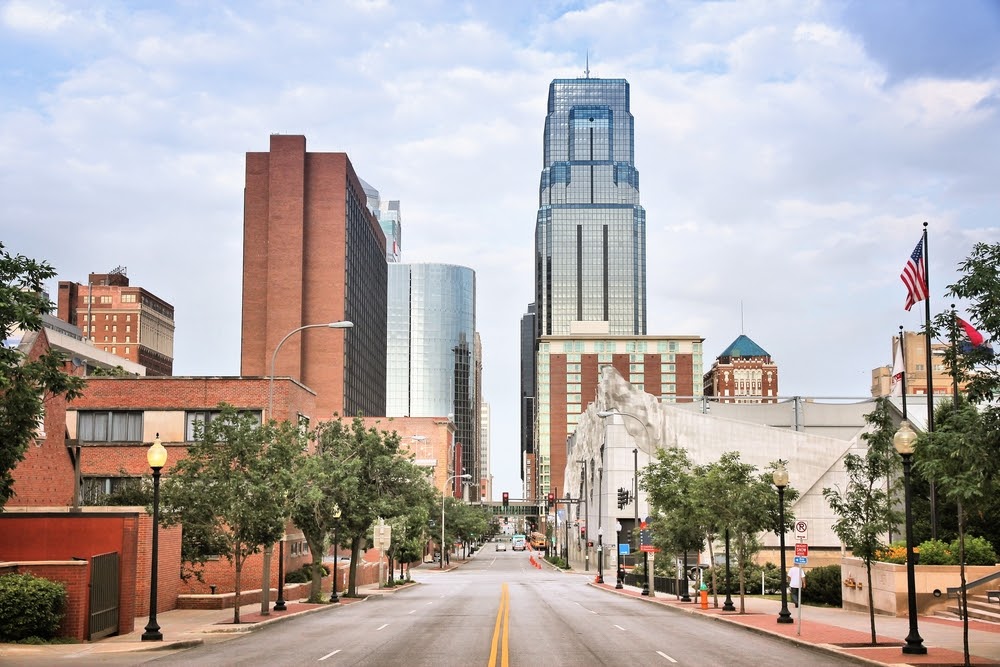
Photo Credit: Tupungato / Shutterstock
14. Kansas City, MO
- 5-year percentage change in population: 4.6%
- Population density (per square mile): 1,580
- Population 2020: 497,159
- Population 2015: 475,368
- Land area (square miles): 314.7
RELATED
How much does it cost to install pavers? How about a bathtub replacement? Get all your home improvement questions answered with detailed cost estimates with Porch.
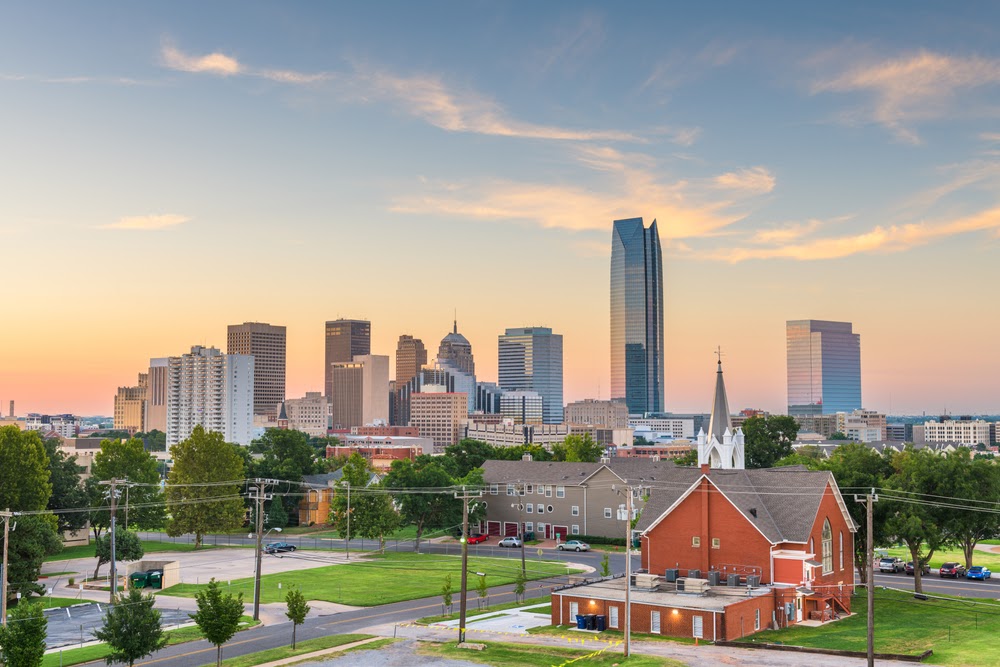
Photo Credit: Sean Pavone / Shutterstock
13. Oklahoma City, OK
- 5-year percentage change in population: 4.8%
- Population density (per square mile): 1,092
- Population 2020: 662,314
- Population 2015: 632,188
- Land area (square miles): 606.5
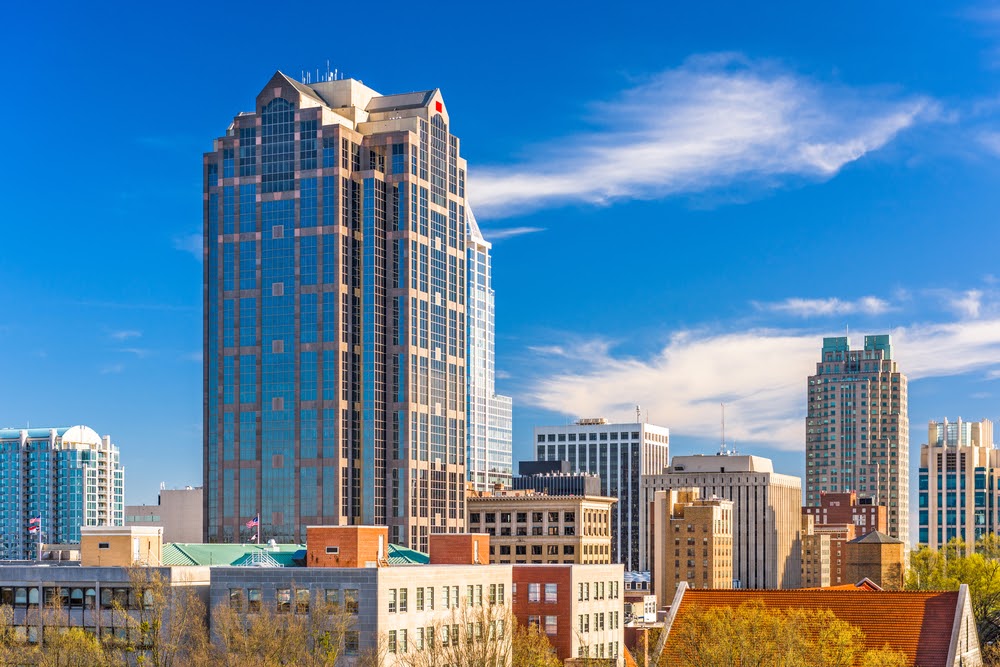
Photo Credit: Sean Pavone / Shutterstock
12. Raleigh, NC
- 5-year percentage change in population: 5.5%
- Population density (per square mile): 3,225
- Population 2020: 474,414
- Population 2015: 449,852
- Land area (square miles): 147.1
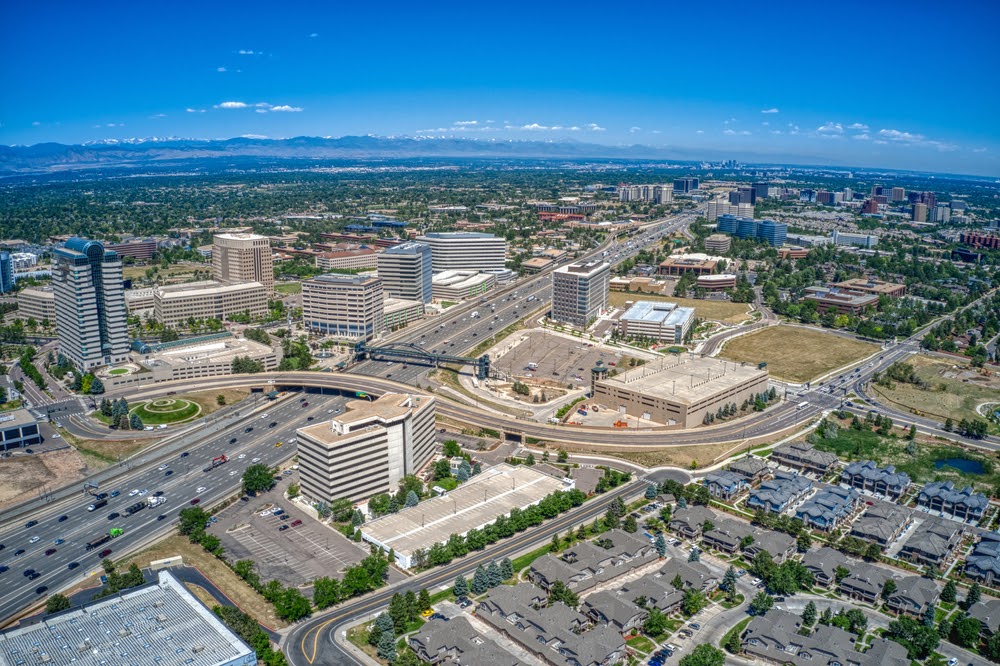
Photo Credit: Jacob Boomsma / Shutterstock
11. Aurora, CO
- 5-year percentage change in population: 6.2%
- Population density (per square mile): 2,420
- Population 2020: 387,377
- Population 2015: 364,655
- Land area (square miles): 160.1
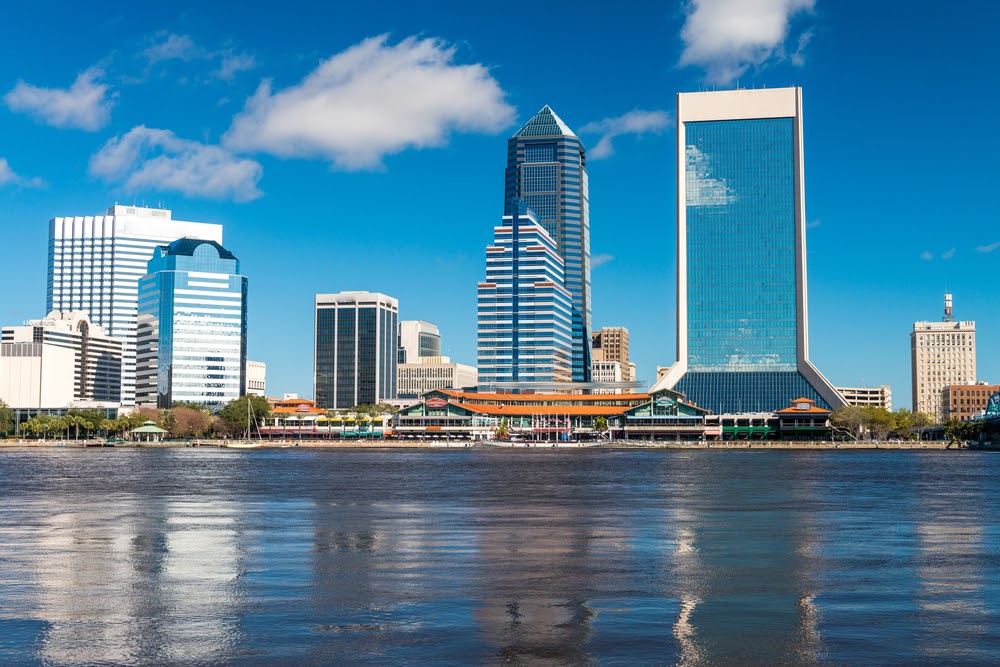
Photo Credit: GagliardiPhotography / Shutterstock
10. Jacksonville, FL
- 5-year percentage change in population: 6.3%
- Population density (per square mile): 1,232
- Population 2020: 920,570
- Population 2015: 866,345
- Land area (square miles): 747.3
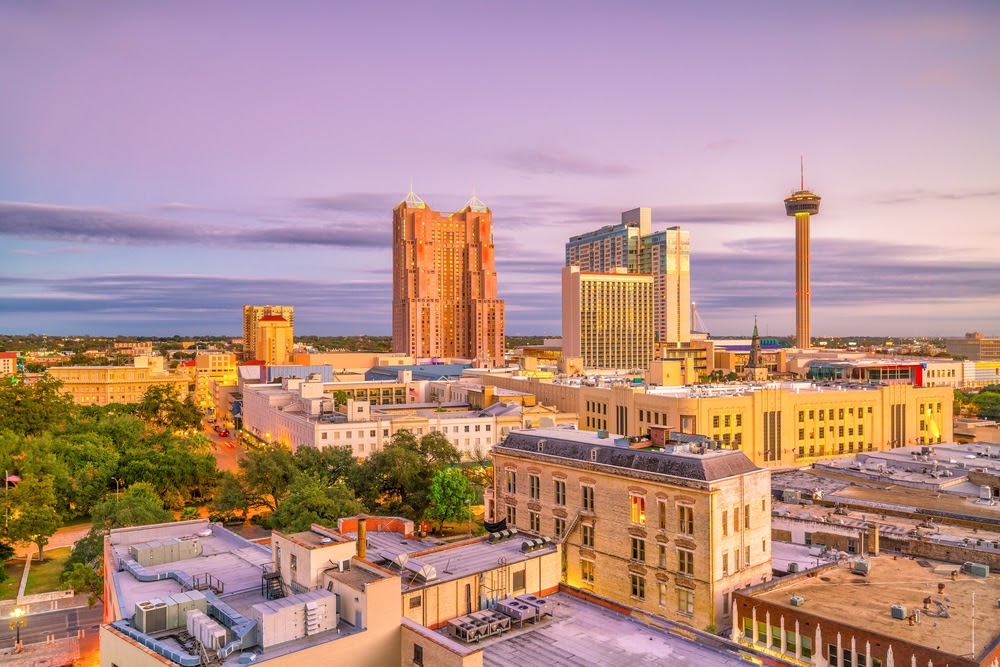
Photo Credit: f11photo / Shutterstock
9. San Antonio, TX
- 5-year percentage change in population: 7.0%
- Population density (per square mile): 3,141
- Population 2020: 1,567,118
- Population 2015: 1,464,839
- Land area (square miles): 498.9

Photo Credit: Jacob Boomsma / Shutterstock
8. Colorado Springs, CO
- 5-year percentage change in population: 7.1%
- Population density (per square mile): 2,467
- Population 2020: 482,131
- Population 2015: 449,963
- Land area (square miles): 195.4
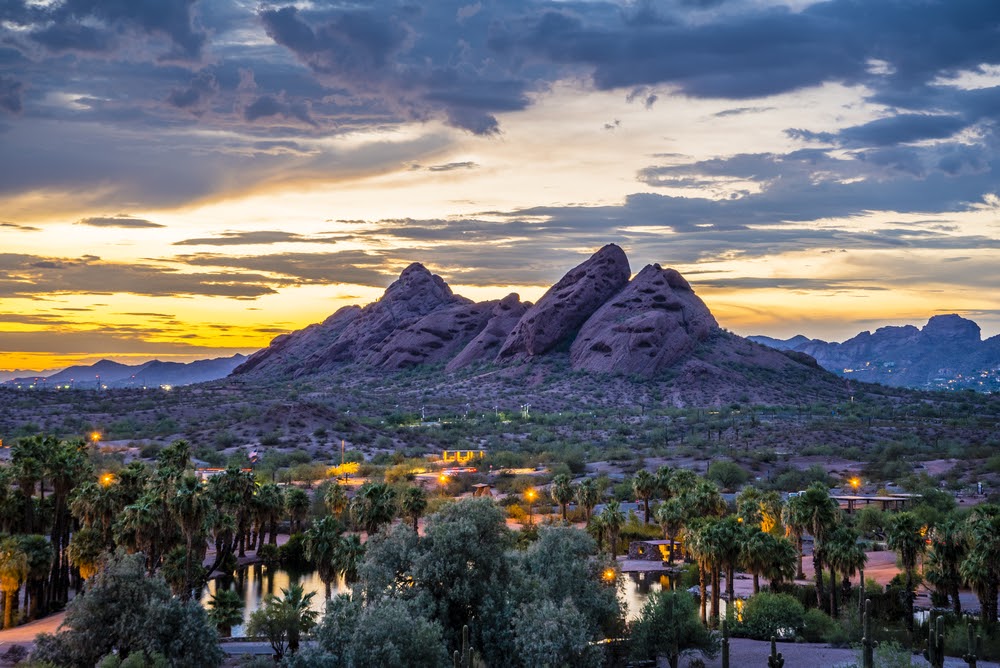
Photo Credit: Gregory E. Clifford / Shutterstock
7. Phoenix, AZ
- 5-year percentage change in population: 7.9%
- Population density (per square mile): 3,298
- Population 2020: 1,708,127
- Population 2015: 1,583,760
- Land area (square miles): 518.0
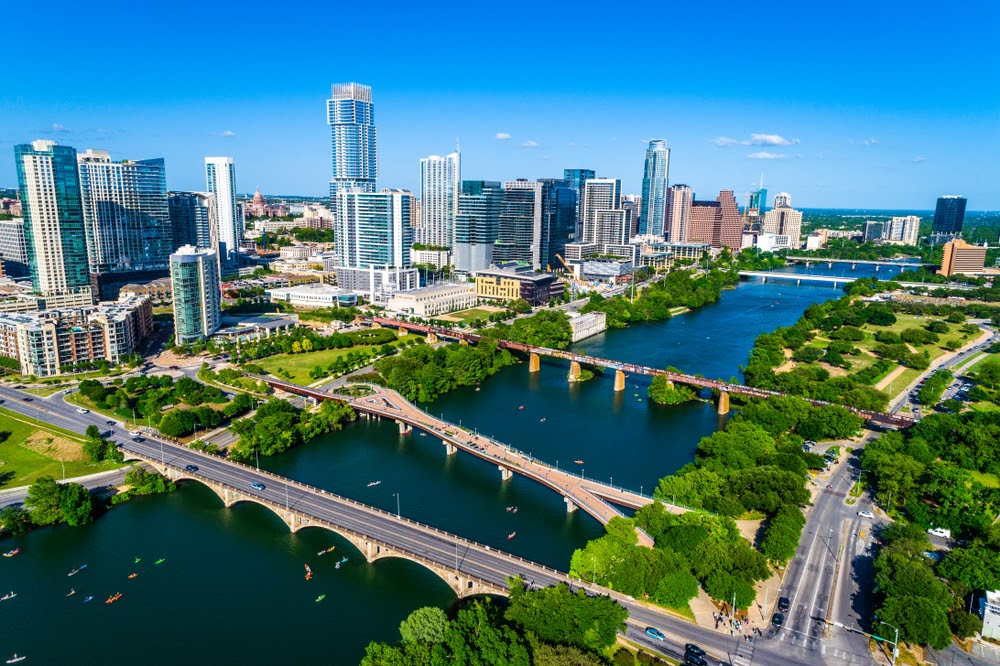
Photo Credit: Roschetzky Photography / Shutterstock
6. Austin, TX
- 5-year percentage change in population: 8.0%
- Population density (per square mile): 3,112
- Population 2020: 995,484
- Population 2015: 921,452
- Land area (square miles): 319.9
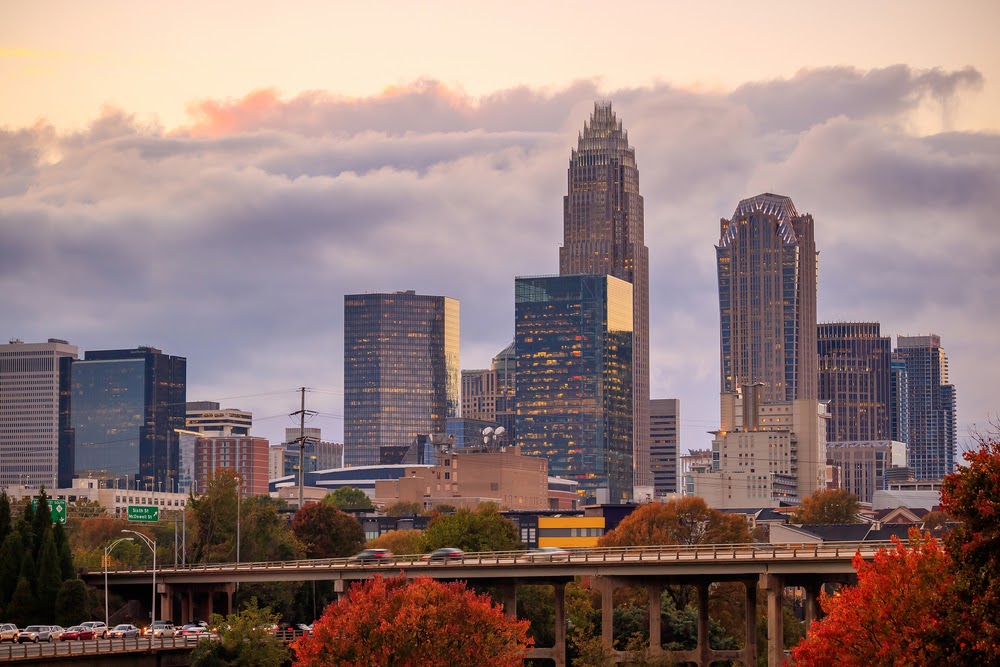
Photo Credit: f11photo / Shutterstock
5. Charlotte, NC
- 5-year percentage change in population: 9.0%
- Population density (per square mile): 2,921
- Population 2020: 900,350
- Population 2015: 826,270
- Land area (square miles): 308.3

Photo Credit: Sean Pavone / Shutterstock
4. Atlanta, GA
- 5-year percentage change in population: 9.4%
- Population density (per square mile): 3,788
- Population 2020: 512,550
- Population 2015: 468,573
- Land area (square miles): 135.3

Photo Credit: Tim Roberts Photography / Shutterstock
3. Mesa, AZ
- 5-year percentage change in population: 9.6%
- Population density (per square mile): 3,809
- Population 2020: 528,159
- Population 2015: 481,721
- Land area (square miles): 138.7
DID YOU KNOW?
The cost of vinyl siding varies depending on your location, the type of siding you choose, and the size of your home. Check out our guide to vinyl siding installation to see cost estimates in your area.
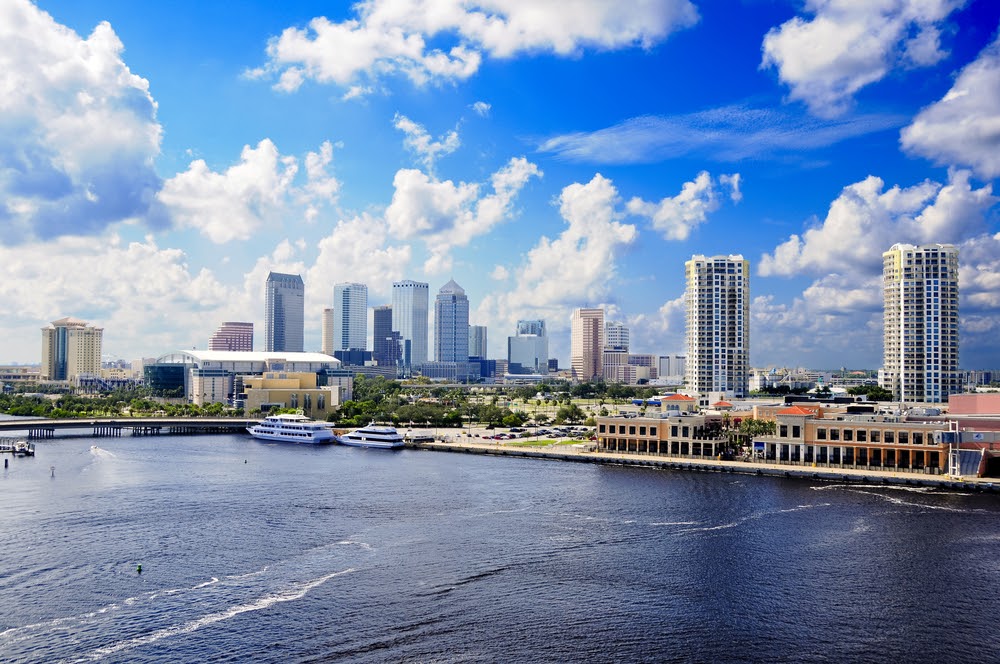
Photo Credit: Bonnie Fink / Shutterstock
2. Tampa, FL
- 5-year percentage change in population: 9.6%
- Population density (per square mile): 3,575
- Population 2020: 407,599
- Population 2015: 371,732
- Land area (square miles): 114.0

Photo Credit: Timothy Milan Kuret / Shutterstock
1. Fort Worth, TX
- 5-year percentage change in population: 11.1%
- Population density (per square mile): 2,671
- Population 2020: 927,720
- Population 2015: 835,305
- Land area (square miles): 347.3
Methodology & Detailed Findings
Data on population comes from the U.S. Census Bureau Population and Housing Units Estimates, while data on land area comes from U.S. Census Bureau geographical system TIGER web. To identify the fastest-growing low-density locations, researchers looked at those places with the highest population growth between 2015 and 2020 and ranked only those locations where the population density is lower than the median across all locations. To improve relevance, only cities with at least 100,000 residents were included. Additionally, cities were grouped into cohorts based on population size: small (100,000–149,999), midsize (150,000–349,999), and large (350,000 or more).
!function(e,i,n,s){var t=”InfogramEmbeds”,d=e.getElementsByTagName(“script”)[0];if(window[t]&&window[t].initialized)window[t].process&&window[t].process();else if(!e.getElementById(n)){var o=e.createElement(“script”);o.async=1,o.id=n,o.src=”https://e.infogram.com/js/dist/embed-loader-min.js”,d.parentNode.insertBefore(o,d)}}(document,0,”infogram-async”);


