
Since the start of the COVID-19 pandemic more than two years ago, living space has taken on new importance for many Americans. From early COVID lockdowns to lasting remote or hybrid work arrangements, people have been spending more time at home and collectively investing billions in the spaces where they live.
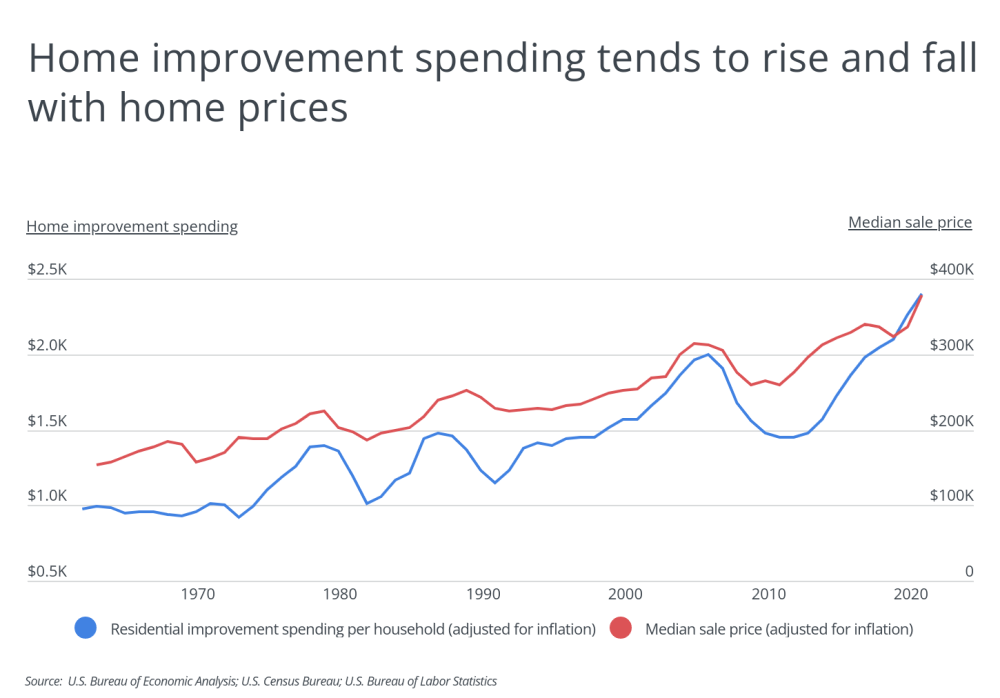
While the pandemic’s economic effects—including high savings rates, low interest rates, and government stimulus—helped supercharge home improvement spending, investment in such home projects was already up in recent years, alongside more than a decade of rising home prices. In 2011, after the Great Recession, inflation-adjusted spending on major residential improvements per household fell to $1,452, but that figure grew steadily to $2,398 by 2021, according to the U.S. Bureau of Economic Analysis.
While households have historically shown a greater likelihood of investing in their homes during periods of rising property values, a number of factors specific to the COVID-19 pandemic encouraged more homeowners to do the work themselves as “DIY” projects. Data from the Farnsworth Group and Home Improvement Research Institute collected between March 2020 and June 2021 show that upwards of 90% of DIYers reported doing the work because they had more time at home, upwards of 50% because of health or safety reasons, and upwards of 20% because contractors weren’t available. More recently, the rising cost of labor and materials could further incentivize homeowners to take on necessary projects themselves as a way to save money.
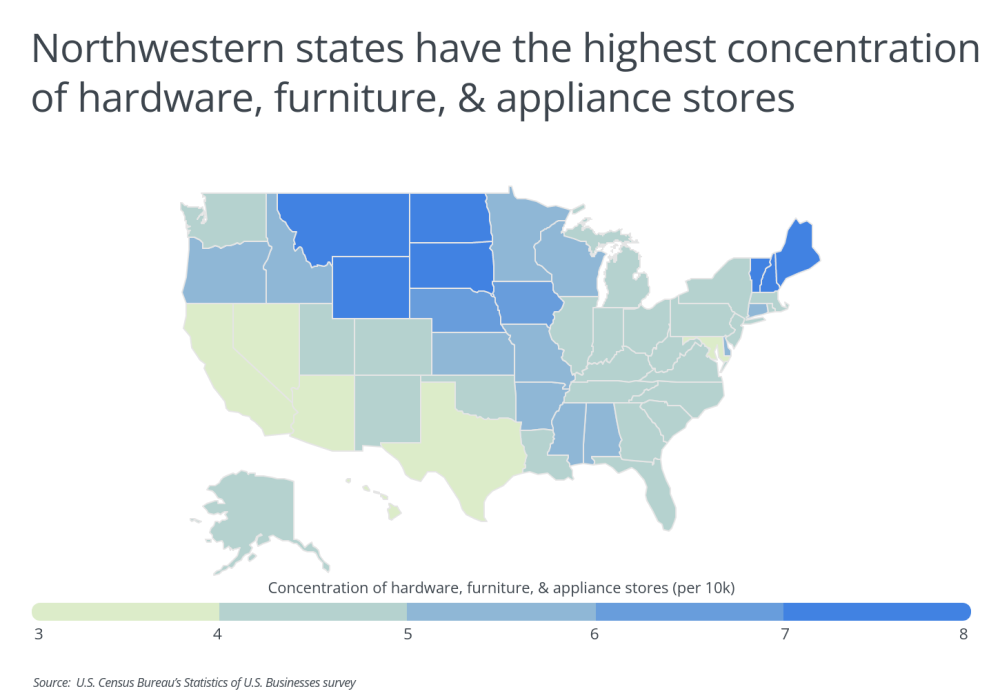
Being a DIYer is more conducive in some parts of the country than in others, given that between 80–90% of DIYers report purchasing their home improvement products in-store (as opposed to online). Based on the concentration of hardware, furniture, and appliance stores relative to the population, states in the Mountain West, Plains, and New England regions are the most DIY-friendly, led by Montana at 8.54 stores per 10,000 residents. At the opposite end of the spectrum are Nevada, Hawaii, Arizona, and California with fewer than half the number of stores per capita when compared to leading states.
DID YOU KNOW?
When buying a new home, it makes sense to have a qualified home inspector perform a thorough house inspection to avoid costly and unexpected repairs in the future. With Porch, all you need to find a home inspector is your zip code.
The data used in this analysis is from the U.S. Census Bureau, Zillow, and the U.S. Bureau of Economic Analysis. To determine the best locations for DIYers, researchers at Porch calculated the concentration of hardware, furniture, and appliance stores (per 10,000 residents). In the event of a tie, the location with the greater total number of hardware, furniture, and appliance stores was ranked higher. To improve relevance, only metropolitan areas with at least 100,000 residents were included. Additionally, metros were grouped into cohorts based on population size: small (100,000–349,999), midsize (350,000–999,999), and large (1,000,000 or more).
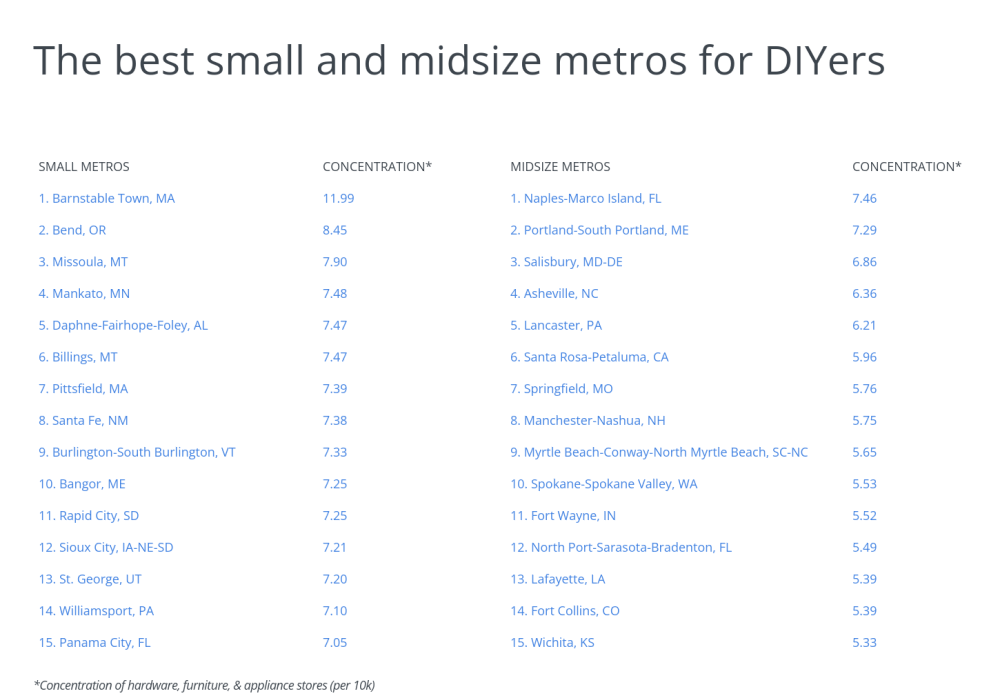
Here are the best U.S. metropolitan areas for DIYers.
The Best Large Metros for DIYers

Photo Credit: Sean Pavone / Shutterstock
15. Boston-Cambridge-Newton, MA-NH
- Concentration of hardware, furniture & appliance stores (per 10k): 4.51
- Total number of hardware, furniture & appliance stores: 2,190
- Median home price: $649,034
- Cost of living (compared to average): +10.2%
DID YOU KNOW?
Rules around what projects a handyman can legally tackle vary from state to state. Tell us what you need done, and we can help match you with a competent and affordable handyman in no time.

Photo Credit: Sean Pavone / Shutterstock
14. Oklahoma City, OK
- Concentration of hardware, furniture & appliance stores (per 10k): 4.53
- Total number of hardware, furniture & appliance stores: 633
- Median home price: $210,799
- Cost of living (compared to average): -6.2%

Photo Credit: Sean Pavone / Shutterstock
13. Salt Lake City, UT
- Concentration of hardware, furniture & appliance stores (per 10k): 4.61
- Total number of hardware, furniture & appliance stores: 560
- Median home price: $602,765
- Cost of living (compared to average): -2.3%

Photo Credit: Sean Pavone / Shutterstock
12. Portland-Vancouver-Hillsboro, OR-WA
- Concentration of hardware, furniture & appliance stores (per 10k): 4.61
- Total number of hardware, furniture & appliance stores: 1,139
- Median home price: $581,400
- Cost of living (compared to average): +5.7%

Photo Credit: Sean Pavone / Shutterstock
11. Nashville-Davidson–Murfreesboro–Franklin, TN
- Concentration of hardware, furniture & appliance stores (per 10k): 4.63
- Total number of hardware, furniture & appliance stores: 881
- Median home price: $433,158
- Cost of living (compared to average): -3.0%

Photo Credit: Sean Pavone / Shutterstock
10. Pittsburgh, PA
- Concentration of hardware, furniture & appliance stores (per 10k): 4.64
- Total number of hardware, furniture & appliance stores: 1,079
- Median home price: $211,973
- Cost of living (compared to average): -4.3%

Photo Credit: Sean Pavone / Shutterstock
9. Hartford-East Hartford-Middletown, CT
- Concentration of hardware, furniture & appliance stores (per 10k): 4.68
- Total number of hardware, furniture & appliance stores: 564
- Median home price: $312,123
- Cost of living (compared to average): +2.9%

Photo Credit: Sean Pavone / Shutterstock
8. Grand Rapids-Kentwood, MI
- Concentration of hardware, furniture & appliance stores (per 10k): 4.70
- Total number of hardware, furniture & appliance stores: 503
- Median home price: $303,655
- Cost of living (compared to average): -5.3%

Photo Credit: Sean Pavone / Shutterstock
7. Louisville/Jefferson County, KY-IN
- Concentration of hardware, furniture & appliance stores (per 10k): 4.70
- Total number of hardware, furniture & appliance stores: 593
- Median home price: $236,137
- Cost of living (compared to average): -8.1%

Photo Credit: Andrew Zarivny / Shutterstock
6. Rochester, NY
- Concentration of hardware, furniture & appliance stores (per 10k): 4.76
- Total number of hardware, furniture & appliance stores: 510
- Median home price: $211,155
- Cost of living (compared to average): -1.7%

Photo Credit: Sean Pavone / Shutterstock
5. Providence-Warwick, RI-MA
- Concentration of hardware, furniture & appliance stores (per 10k): 4.77
- Total number of hardware, furniture & appliance stores: 774
- Median home price: $438,168
- Cost of living (compared to average): +1.2%
LEARN MORE
These are the factors that will influence the cost of installing a new electrical outlet in your home: existing wiring, location of the outlet, the outlet’s purpose and type, electrical boxes, and materials. The best thing to do is find a good local electrician and have them give you an estimate for getting the job done for you.

Photo Credit: Sean Pavone / Shutterstock
4. New York-Newark-Jersey City, NY-NJ-PA
- Concentration of hardware, furniture & appliance stores (per 10k): 4.86
- Total number of hardware, furniture & appliance stores: 9,357
- Median home price: $600,354
- Cost of living (compared to average): +15.5%

Photo Credit: Sean Pavone / Shutterstock
3. New Orleans-Metairie, LA
- Concentration of hardware, furniture & appliance stores (per 10k): 4.92
- Total number of hardware, furniture & appliance stores: 626
- Median home price: $264,185
- Cost of living (compared to average): -3.1%

Photo Credit: Sean Pavone / Shutterstock
2. Birmingham-Hoover, AL
- Concentration of hardware, furniture & appliance stores (per 10k): 5.12
- Total number of hardware, furniture & appliance stores: 557
- Median home price: $234,645
- Cost of living (compared to average): -7.4%

Photo Credit: Sean Pavone / Shutterstock
1. Miami-Fort Lauderdale-Pompano Beach, FL
- Concentration of hardware, furniture & appliance stores (per 10k): 5.21
- Total number of hardware, furniture & appliance stores: 3,196
- Median home price: $430,068
- Cost of living (compared to average): +10.0%
Detailed Findings & Methodology
The data used in this analysis is from the U.S. Census Bureau’s Statistics of U.S. Businesses survey, Zillow’s Home Value Index, and the U.S. Bureau of Economic Analysis’s Regional Price Parities. To determine the best locations for DIYers, researchers calculated the concentration of hardware, furniture, and appliance stores (per 10,000 residents). In the event of a tie, the location with the greater total number of hardware, furniture, and appliance stores was ranked higher. To improve relevance, only metropolitan areas with at least 100,000 residents were included. Additionally, metros were grouped into cohorts based on population size: small (100,000–349,999), midsize (350,000–999,999), and large (1,000,000 or more).


