Housing affordability has been a major topic of concern for researchers and policymakers in recent years. Access to affordable, quality housing is associated with a variety of positive economic and social outcomes, which makes it an important tool to encourage families to thrive.
But historically, affordable housing has been out of reach for many. Low income populations and racial and ethnic minorities are often excluded from the wealth-building benefits of homeownership. People who rent are far more likely to be cost burdened by housing, according to Census Bureau data. And whenever income grows slowly—as it has recently for certain groups—housing affordability becomes even more of a challenge.
Fortunately, some data suggests that affordability has improved nationwide over the past decade. One of the key indicators that housing experts consider when evaluating affordability in the market is the share of households spending at least 30% of their income on housing. According to data from the American Community Survey, the last decade has shown positive trends on this measure. In 2010, with the U.S. still confronting the effects of the Great Recession, nearly 37% of households were spending above that threshold, but the number has declined since and dipped below 30% in 2019.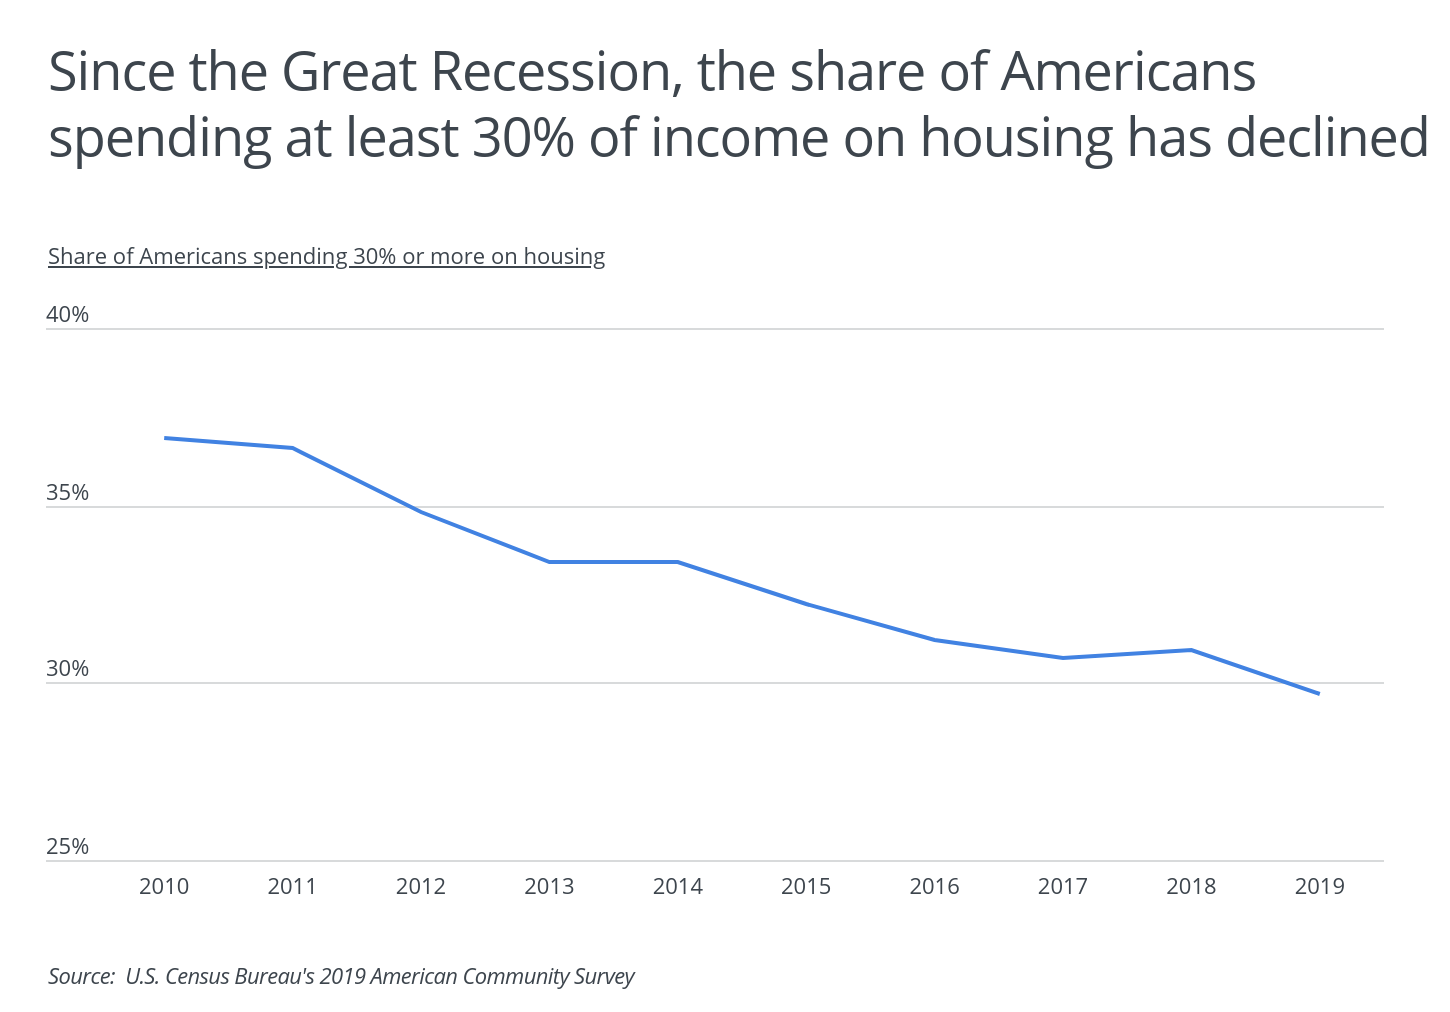
But despite the decline in the number of households spending above the 30% threshold, home prices have been on the rise in recent years, which could have implications on affordability for some populations. After the sharp drops in home values during the last recession, prices turned upward and continued to grow as the economy recovered to full strength, increasing by nearly 45% over the last five years. And notably, prices continued to rise from 2020 to 2021—nearly 20% year over year—despite the economic disruptions of the COVID-19 pandemic, thanks to record low inventory and increased demand. As prices increase, it will be worth watching whether the positive trends in housing expenditures continue. While homeowners are benefiting from the boom, those with lower incomes have borne the worst economic consequences of the pandemic and may be particularly squeezed as rent and housing prices continue to rise.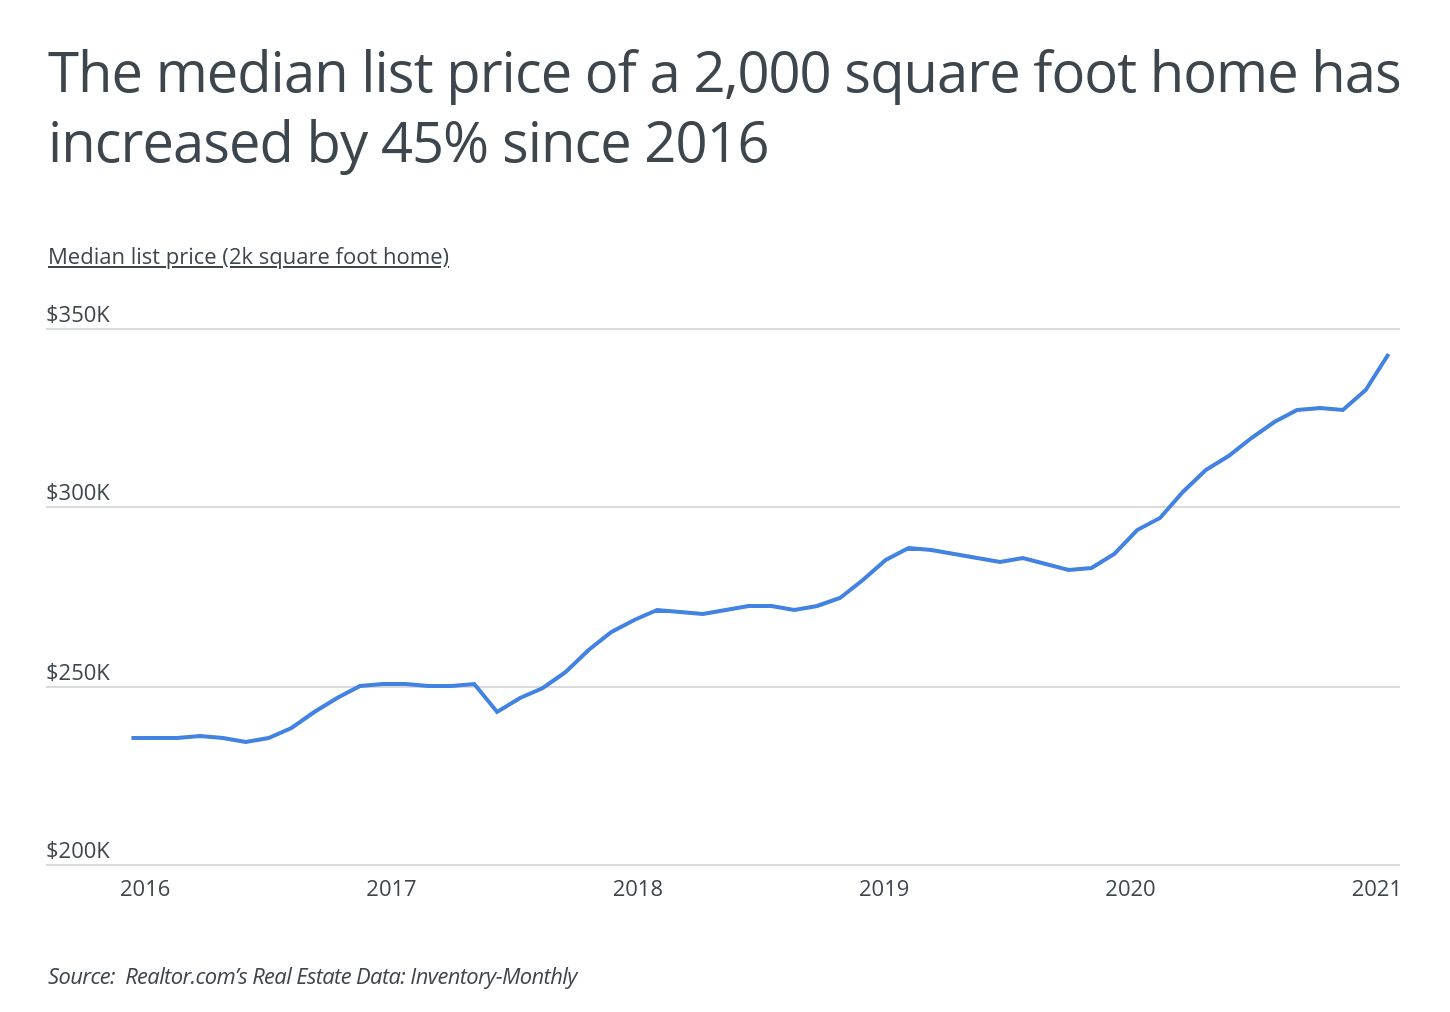
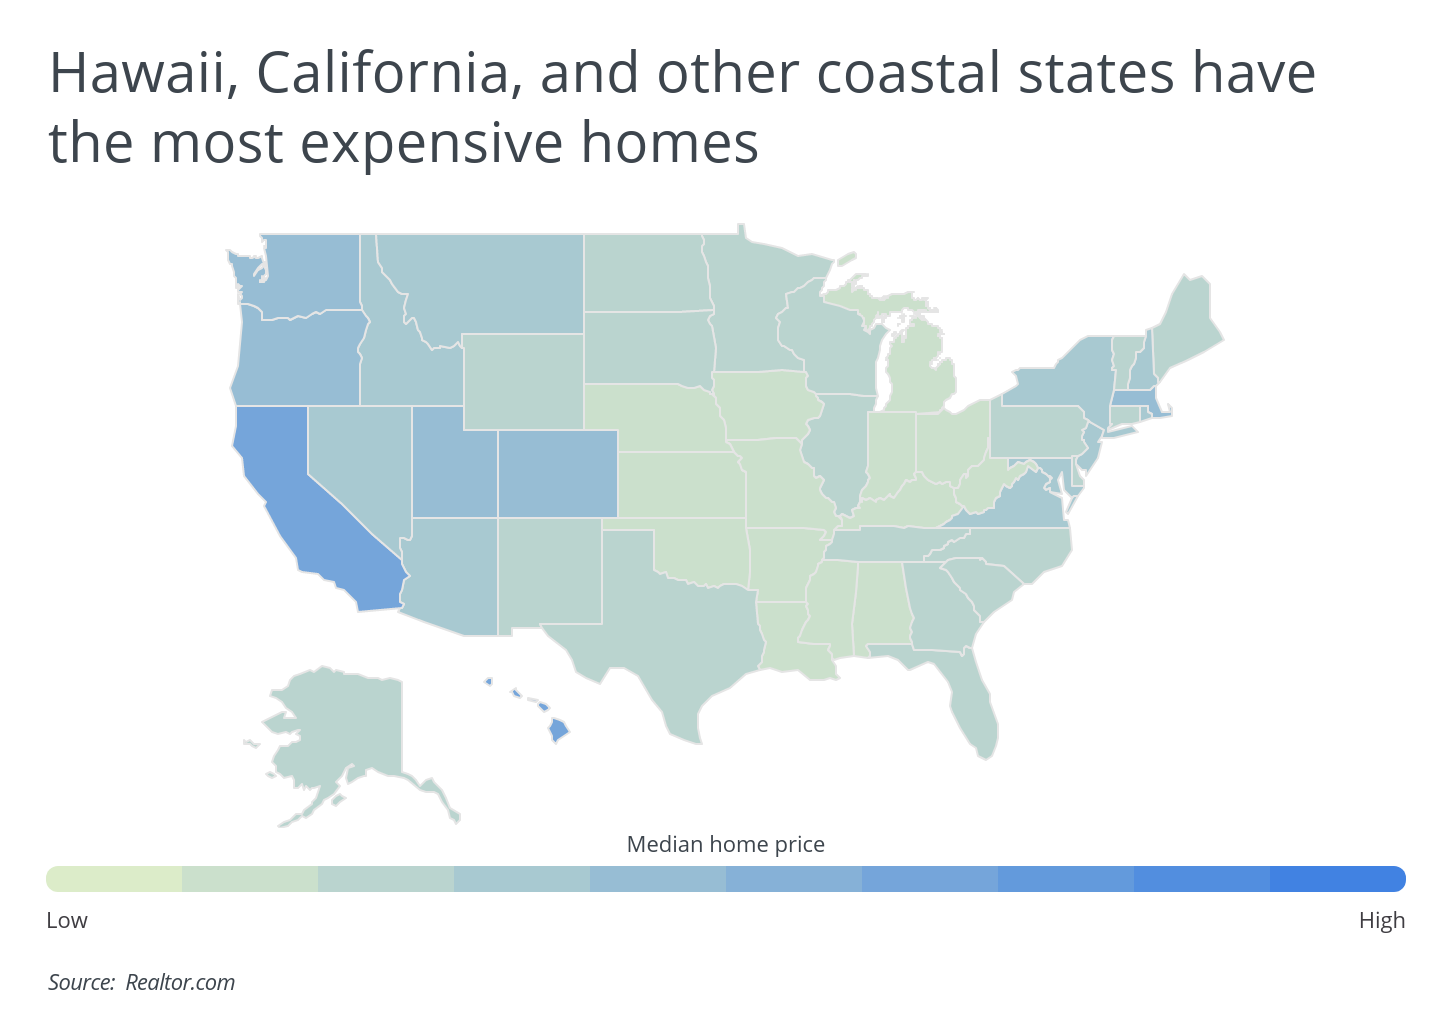
Of course, it is also the case that trends in real estate prices are highly dependent on local market characteristics, and some markets are far less affordable than others. At the state level, Hawaii tops all others for median list price, with a typical price of $1,140,723 for a 2,000 square foot home. This is largely due to its geographic isolation—which makes it more expensive to source building materials—and its limited land area—which makes it harder to increase the supply of housing stock. Other pricey states like California, Massachusetts, and Washington have their prices driven by high demand in red-hot markets like the Bay Area and Los Angeles, Boston, and Seattle, respectively. At the other end of the spectrum, less expensive markets tend to be found in parts of the South and Midwest where demand is lower and supply is less constrained.
TRENDING
If your bathroom is starting to look tired, a new bathtub can give this space a whole new look. Read everything you need to know about a bathtub replacement with Porch.
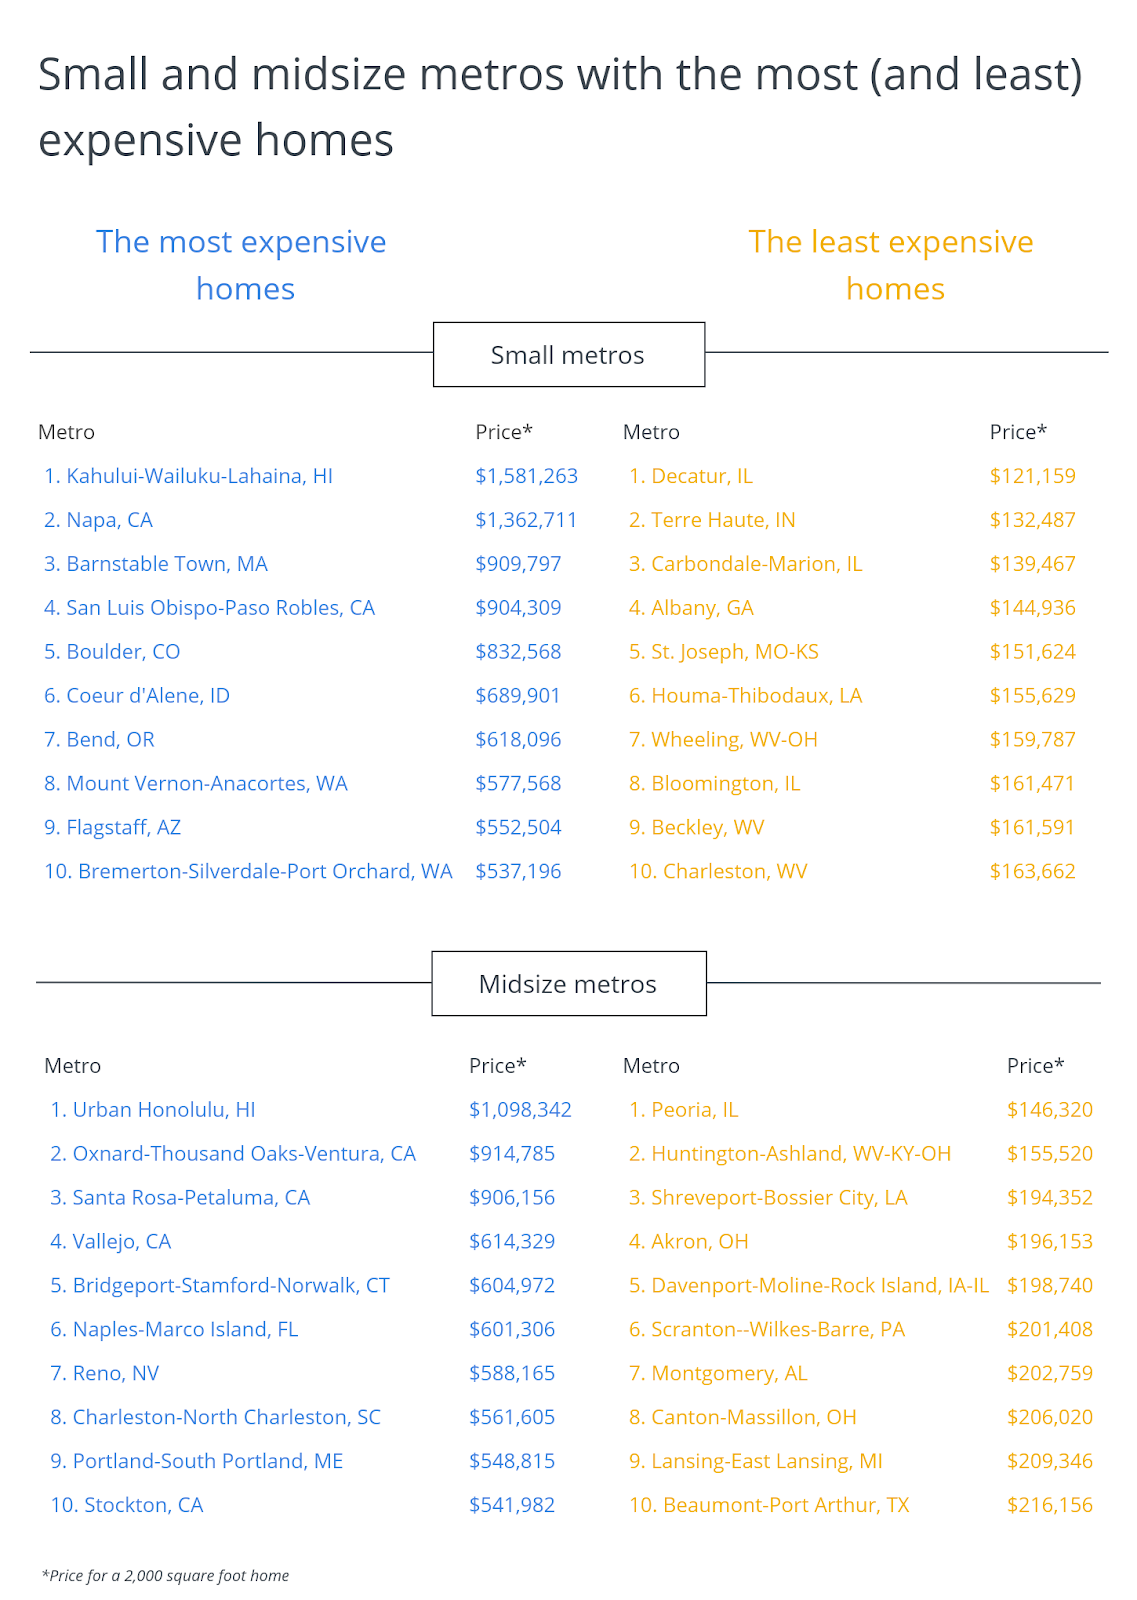
To find the areas with the most and least expensive homes and apartments, researchers at Porch used data from Realtor.com and ranked metropolitan areas by the typical price of a 2,000 square foot home. The researchers also analyzed data from the U.S. Department of Housing and Urban Development and the U.S. Bureau of Economic Analysis to determine the monthly price of a two-bedroom apartment and relative cost of living in each location.
Here are the metropolitan areas with the most (and least) expensive homes.
Large metros with the most expensive homes
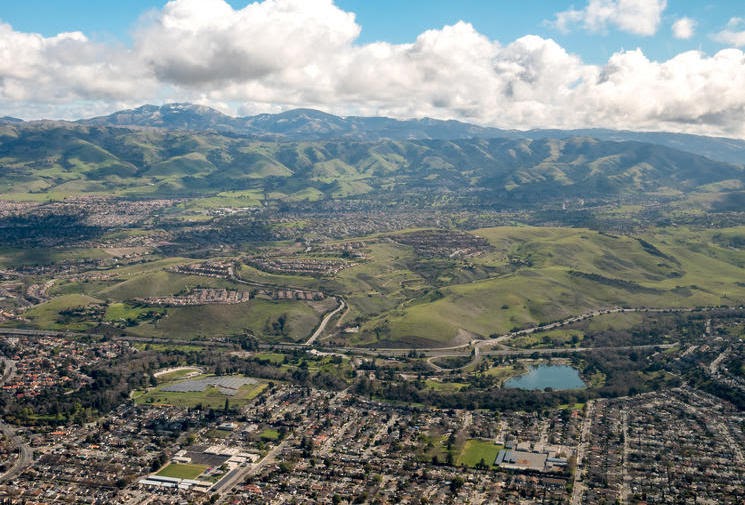
Photo Credit: Alamy Stock Photo
1. San Jose-Sunnyvale-Santa Clara, CA
- Price for a 2k square foot home: $1,568,676
- Median list price: $1,228,400
- Median price per square foot: $784.34
- Monthly price for a 2-bedroom apartment: $3,181
- Overall cost of living (compared to national average): +26.7%

Photo Credit: Alamy Stock Photo
2. San Francisco-Oakland-Berkeley, CA
- Price for a 2k square foot home: $1,389,928
- Median list price: $1,020,444
- Median price per square foot: $694.96
- Monthly price for a 2-bedroom apartment: $3,072
- Overall cost of living (compared to national average): +34.5%
DID YOU KNOW?
The cost of vinyl siding varies depending on your location, the type of siding you choose, and the size of your home. Use our comprehensive cost guide to vinyl siding installation to get started.

Photo Credit: Alamy Stock Photo
3. Los Angeles-Long Beach-Anaheim, CA
- Price for a 2k square foot home: $1,230,631
- Median list price: $1,184,500
- Median price per square foot: $615.32
- Monthly price for a 2-bedroom apartment: $2,302
- Overall cost of living (compared to national average): +18.8%
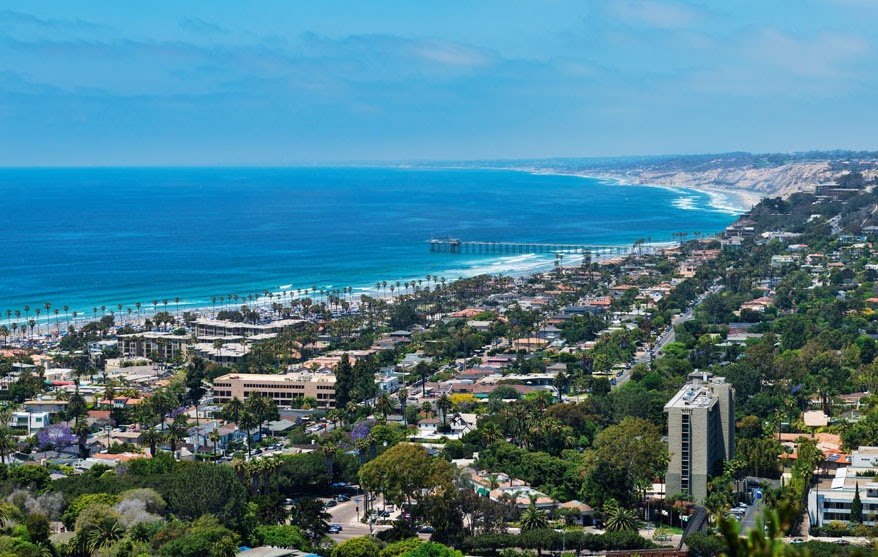
Photo Credit: Alamy Stock Photo
4. San Diego-Chula Vista-Carlsbad, CA
- Price for a 2k square foot home: $1,025,118
- Median list price: $877,495
- Median price per square foot: $512.56
- Monthly price for a 2-bedroom apartment: $2,254
- Overall cost of living (compared to national average): +17.9%

Photo Credit: Alamy Stock Photo
5. Seattle-Tacoma-Bellevue, WA
- Price for a 2k square foot home: $876,477
- Median list price: $672,386
- Median price per square foot: $438.24
- Monthly price for a 2-bedroom apartment: $1,962
- Overall cost of living (compared to national average): +14.5%
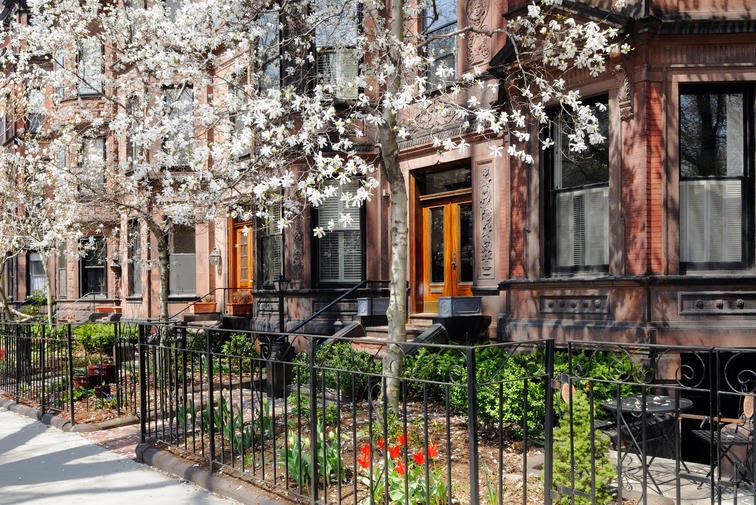
Photo Credit: Alamy Stock Photo
6. Boston-Cambridge-Newton, MA-NH
- Price for a 2k square foot home: $811,991
- Median list price: $692,500
- Median price per square foot: $406.00
- Monthly price for a 2-bedroom apartment: $2,233
- Overall cost of living (compared to national average): +15.5%
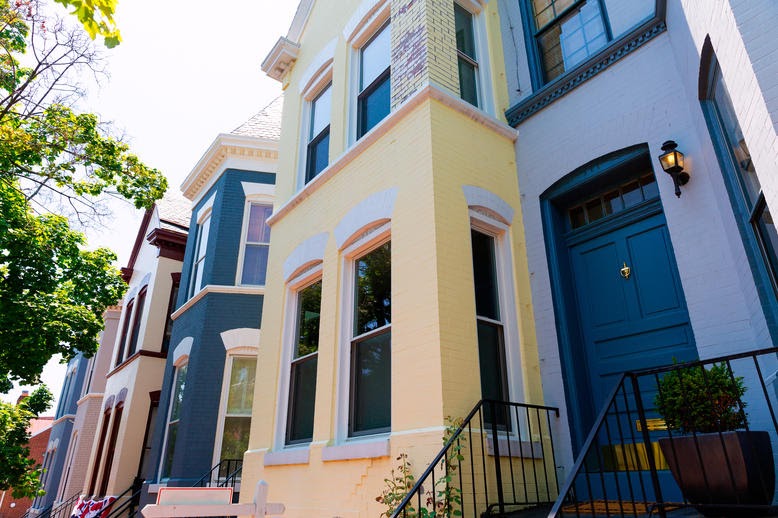
Photo Credit: Alamy Stock Photo
7. Washington-Arlington-Alexandria, DC-VA-MD-WV
- Price for a 2k square foot home: $629,582
- Median list price: $499,900
- Median price per square foot: $314.79
- Monthly price for a 2-bedroom apartment: $1,891
- Overall cost of living (compared to national average): +17.4%

Photo Credit: Alamy Stock Photo
8. Sacramento-Roseville-Folsom, CA
- Price for a 2k square foot home: $625,850
- Median list price: $589,000
- Median price per square foot: $312.93
- Monthly price for a 2-bedroom apartment: $1,610
- Overall cost of living (compared to national average): +5.2%
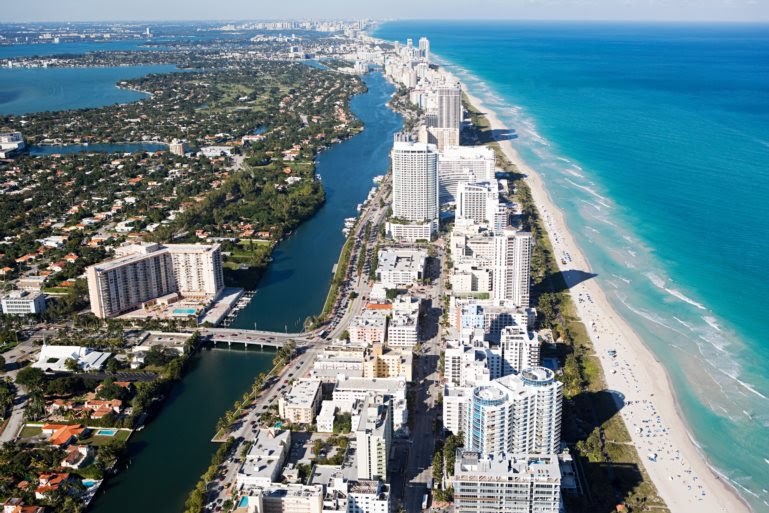
Photo Credit: Alamy Stock Photo
9. Miami-Fort Lauderdale-Pompano Beach, FL
- Price for a 2k square foot home: $601,242
- Median list price: $399,450
- Median price per square foot: $300.62
- Monthly price for a 2-bedroom apartment: $1,644
- Overall cost of living (compared to national average): +11.7%

Photo Credit: Alamy Stock Photo
10. Portland-Vancouver-Hillsboro, OR-WA
- Price for a 2k square foot home: $575,306
- Median list price: $527,250
- Median price per square foot: $287.65
- Monthly price for a 2-bedroom apartment: $1,620
- Overall cost of living (compared to national average): +5.0%
Large metros with the least expensive homes

Photo Credit: Alamy Stock Photo
1. Cleveland-Elyria, OH
- Price for a 2k square foot home: $213,696
- Median list price: $209,950
- Median price per square foot: $106.85
- Monthly price for a 2-bedroom apartment: $925
- Overall cost of living (compared to national average): -10.1%
TRENDING
How much does a concrete slab cost? The answer depends on several factors, including how thick the concrete needs to be, whether or not any formwork is needed, and whether you need old concrete removed first.

Photo Credit: Alamy Stock Photo
2. Indianapolis-Carmel-Anderson, IN
- Price for a 2k square foot home: $257,679
- Median list price: $283,607
- Median price per square foot: $128.84
- Monthly price for a 2-bedroom apartment: $993
- Overall cost of living (compared to national average): -8.9%

Photo Credit: Alamy Stock Photo
3. Birmingham-Hoover, AL
- Price for a 2k square foot home: $260,975
- Median list price: $269,950
- Median price per square foot: $130.49
- Monthly price for a 2-bedroom apartment: $1,081
- Overall cost of living (compared to national average): -11.7%

Photo Credit: Alamy Stock Photo
4. St. Louis, MO-IL
- Price for a 2k square foot home: $282,018
- Median list price: $261,400
- Median price per square foot: $141.01
- Monthly price for a 2-bedroom apartment: $1,000
- Overall cost of living (compared to national average): -9.9%

Photo Credit: Alamy Stock Photo
5. Buffalo-Cheektowaga, NY
- Price for a 2k square foot home: $283,832
- Median list price: $249,900
- Median price per square foot: $141.92
- Monthly price for a 2-bedroom apartment: $982
- Overall cost of living (compared to national average): -5.5%

Photo Credit: Alamy Stock Photo
6. Oklahoma City, OK
- Price for a 2k square foot home: $288,927
- Median list price: $301,050
- Median price per square foot: $144.46
- Monthly price for a 2-bedroom apartment: $962
- Overall cost of living (compared to national average): -10.2%

Photo Credit: Alamy Stock Photo
7. Louisville/Jefferson County, KY-IN
- Price for a 2k square foot home: $294,673
- Median list price: $262,450
- Median price per square foot: $147.34
- Monthly price for a 2-bedroom apartment: $972
- Overall cost of living (compared to national average): -10.4%
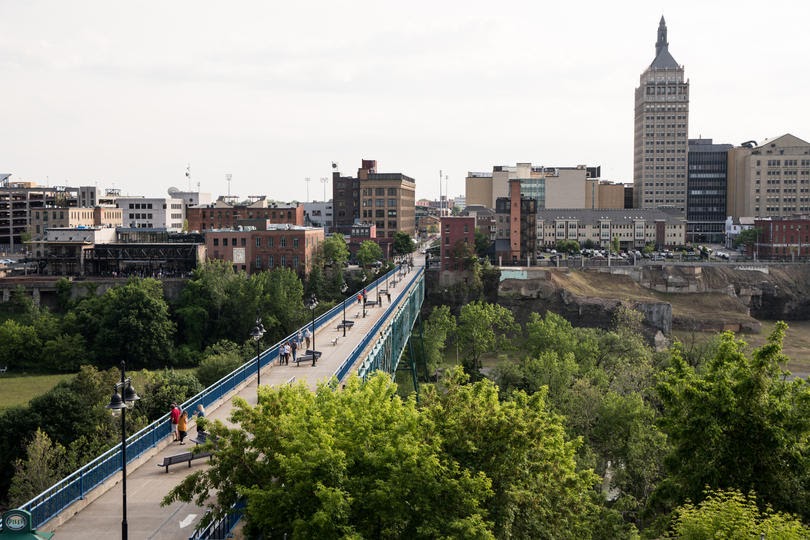
Photo Credit: Alamy Stock Photo
8. Rochester, NY
- Price for a 2k square foot home: $305,362
- Median list price: $293,400
- Median price per square foot: $152.68
- Monthly price for a 2-bedroom apartment: $1,065
- Overall cost of living (compared to national average): -2.9%
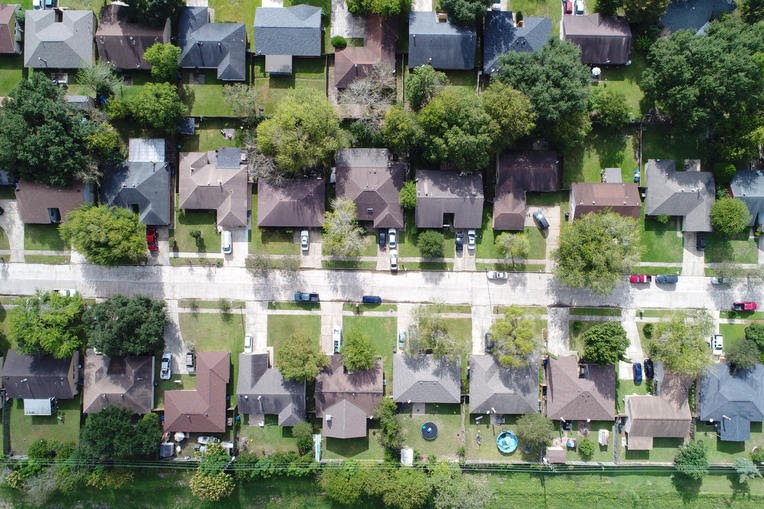
Photo Credit: Alamy Stock Photo
9. Houston-The Woodlands-Sugar Land, TX
- Price for a 2k square foot home: $313,947
- Median list price: $340,624
- Median price per square foot: $157.00
- Monthly price for a 2-bedroom apartment: $1,258
- Overall cost of living (compared to national average): +1.7%

Photo Credit: Alamy Stock Photo
10. San Antonio-New Braunfels, TX
- Price for a 2k square foot home: $325,376
- Median list price: $312,500
- Median price per square foot: $162.69
- Monthly price for a 2-bedroom apartment: $1,191
- Overall cost of living (compared to national average): -6.7%
Detailed findings & methodology
The data used in this analysis is from Realtor.com’s Real Estate Data: Inventory-Monthly, the U.S. Census Bureau’s2019 American Community Survey, the U.S. Bureau of Economic Analysis Regional Price Parity dataset, and the U.S. Department of Housing and Urban Development’s (HUD)50th Percentile Rent Estimates. To determine the locations where homes and apartments are the most expensive, researchers ranked locations by the price for a 2,000 square foot home. This was calculated using Realtor’s median cost per square foot. In the event of a tie, Realtor’s median listing price was used.
To determine the monthly price for a two-bedroom apartment, researchers aggregated county-level data from HUD. Overall cost of living (compared to the national average) was determined from the U.S. Bureau of Economic Analysis Regional Price Parities dataset.
Due to data availability issues, certain metropolitan areas and states were not included in the analysis. To improve relevance, only remaining metropolitan areas with at least 100,000 residents were included. Additionally, metros were grouped into cohorts based on population size: small (100,000–349,999), midsize (350,000–999,999), and large (1,000,000 or more).