Intro
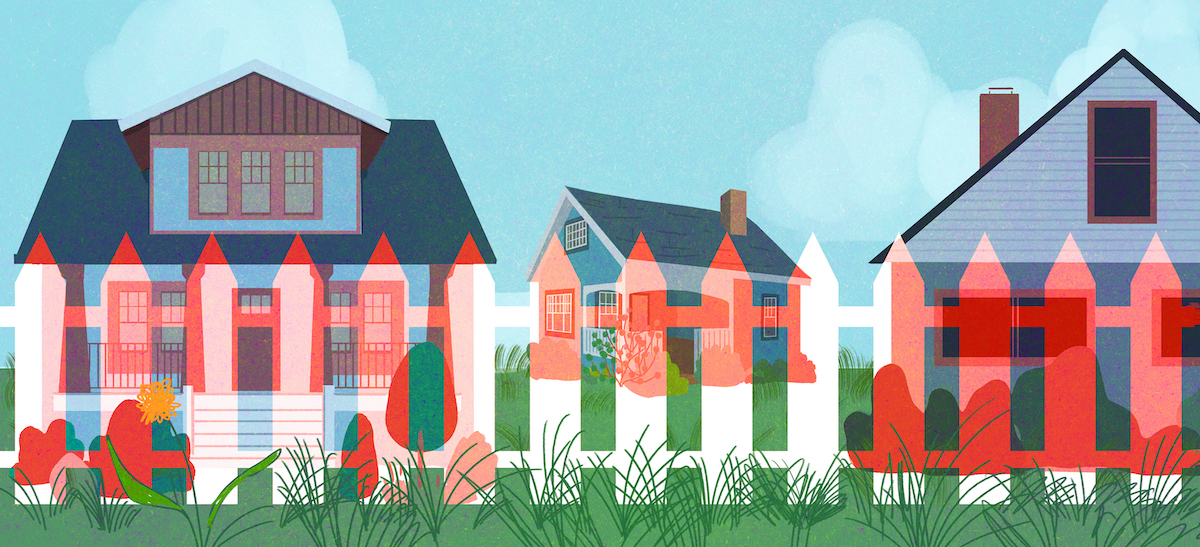
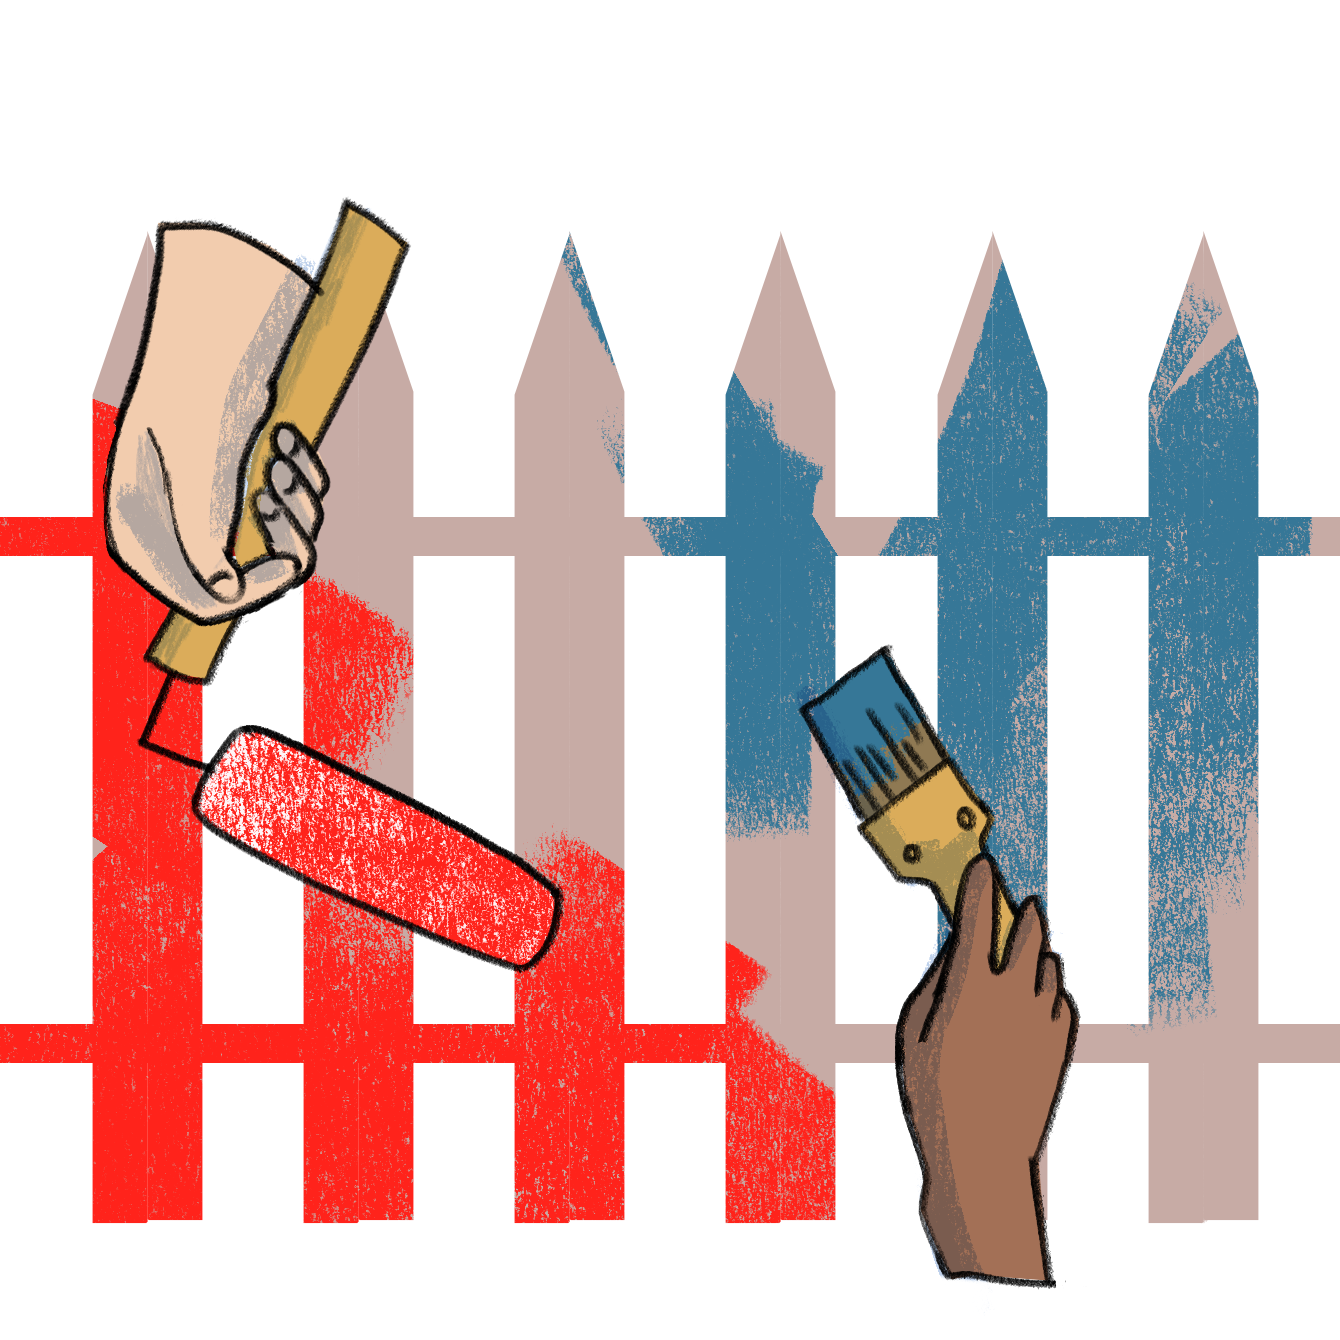
As we’re nearing another presidential election, we wondered whether the political leaning of Americans on both sides of the aisle has any relation to home improvement trends. Do people in Blue states invest in eco-improvements? Are houses in Red States more likely to be, well, red? Is American housing as divided as the country is said to be?
The answers to some of these questions might surprise you. Read on below.
Key Findings
- Red states are 53% more likely to look for fencing contractors
- Blue states are 36% more likely to hire paving contractors
- 16% of homes in Blue states are powered by solar vs 4% in Red states
- Most states that prefer to paint houses red are Red States
- 19 out of 20 states with cheapest houses are Red States
- In a divided country, 50% of people want their kitchens to be open
Fences are Red, Driveways are Blue
Do people who live in the states that voted for a candidate who promised to build a wall in 2016 tend to build more fence and wall themselves? According to our data, the answer is yes.
Fencing contractors were 53% more popular in the Red states, and the services of contractors dealing with exterior house walls were 21% more in demand in the Republican-leaning states.
Meanwhile, in the Democrat-leaning states, the services of paving contractors were 36% more in demand, along with fire and chimney maintenance (+19.7%), architecture and design (+12.5%), and painting (+12%)
Democrat-leaning states were more likely to need help with gardening and landscaping, while Republican-leaning states had a superior demand for installation of outdoor features, such as docks, pergolas, and yard signs.
The Sky is Blue, Too
On the topic of renewable energy, despite sunshine generally persisting in the south of the United States (and south often means more sunshine), it’s not the Red states that are ahead in solar power!
In fact, homes in Blue states are more than four times more likely to be powered by the sun, compared to their counterparts in the Red states.
Leading the charge are Hawaii, California, and Nevada, where according to the figures we found, more than half of the homes are powered by the energy of the sun.
The only Red state that comes close to the shining example set by the three Blue states is Utah, where just under one-third (31.6%) of all homes get their power from solar
The best places to see smaller white houses are New York, Maryland and California.
Do house colors trend politically?
The red and blue divide of U.S. politics does seem to play out somewhat in the paint color preferences. Colors from the red part of the spectrum were prevalent in Florida, Michigan, North Carolina, Oklahoma, and Pennsylvania—all of which went Republican in 2016.
Bucking the trend were Colorado where an ostensibly red color called “Moroccan Ruby” was the most popular, as well as Missouri.
Not Much Love for a White House
Given all these political correlations, is there any love for white houses? In absence of more recent data, the best we have is a study by a paint company Behr from 2017, which suggested that only two or three states prefer to paint their houses white, (depending on which hues you count towards white).
Whether the shades the paint manufacturer called “Swiss Coffee” is a shade of white or “Wine Hot” – a shade of red, can of course, be debated (as can the logic behind this whole section!).
It would appear that the color in which people chose to paint their houses has little to do with politics, which we can all agree is probably a good thing.
Red Means Affordable? The States with the Cheapest Housing in the U.S.
Affordable housing has long been on the Democrat party’s agenda, but does that mean that housing in Blue states is more affordable? Let’s have a quick look at the housing prices.
The results tell a peculiar story: 19 of the 20 states with cheapest average house price voted Republican in the last election. The cheapest is West Virginia, where a home would set you back an average of $107,762, as well as Mississippi, where homes cost typically just over $127k.
Only one Blue state cracked the top 20—Illinois, and it’s in 17th spot with a typical property on the market being worth around $209k.
While house prices alone might be the best measure of housing affordability, as the incomes across the United States vary significantly, the Blue states don’t perform well on that metric.
Once again, West Virginia came out the most affordable, with the average house price to annual household income ratio of only 3:2. The ratio in Illinois was at 2:1.The only other blue state that cracked the top 20 most affordable houses was Connecticut, where significantly higher incomes meant that a typical house costs 2.3 times the annual income of an average family.
In Divided America, a Push For More Open-Plan Housing
Despite the prevailing narrative of a divided country, Americans take a different approach to their homes. They want them more open!
Figures released by the National Association of Home Builders (NAHB) in 2004 put the share of U.S. homebuyers who were looking for an open kitchen-family room at 29%. Come 2013, that figurehad risen to 37%.
Thirteen years later, a study conducted by the NAHB in 2017 found that 32% of homebuyers wanted either a completely open kitchen-family room arrangement, while 45% had the same view on combining kitchen and dining areas.
This trend continued through to 2019, when a more recent survey by NAHB uncovered that more than four in ten (43%) buyers wanted a fully open kitchen-family room, while 50% preferred their kitchen-dining layout to be completely open.
And the homebuilders responded in kind. An industry report from last year found nearly two out of three (65%) newly built homes included an open kitchen-family area, and almost half (47%) included a room combining the kitchen and dining.
—
Of course, by no means are we implying that voting behavior has everything to do with contractor demand, choice of paint color, or preference for an open-plan or separate kitchen, especially when analyzed at the state level. A Blue and Red state is a plurality, meaning many people of both parties live in each and every one!
All the complexity and election math aside, this study is simply an observation of trends in housing and politics, which, when projected onto each other for no good reason other than curiosity, result in some peculiar (and fun) observations.
==
Sources and methodology
- Figures on contractor demand were taken from Porch.com web analytics.
- Solar power statistics were taken from Solar Energy Industries Association, and the number of housing units – from U.S. Census Bureau, Population Estimates Program
- House prices were taken from Zillow, and household incomes – from the American Community Survey.
- Paint color preferences were obtained from a study by BEHR, featured on ApartmentTherapy.com.
- States that voted Republican in 2016 were deemed Red, states that voted Democrat – Blue. Election results were taken from the Federal Election Commission report.
