
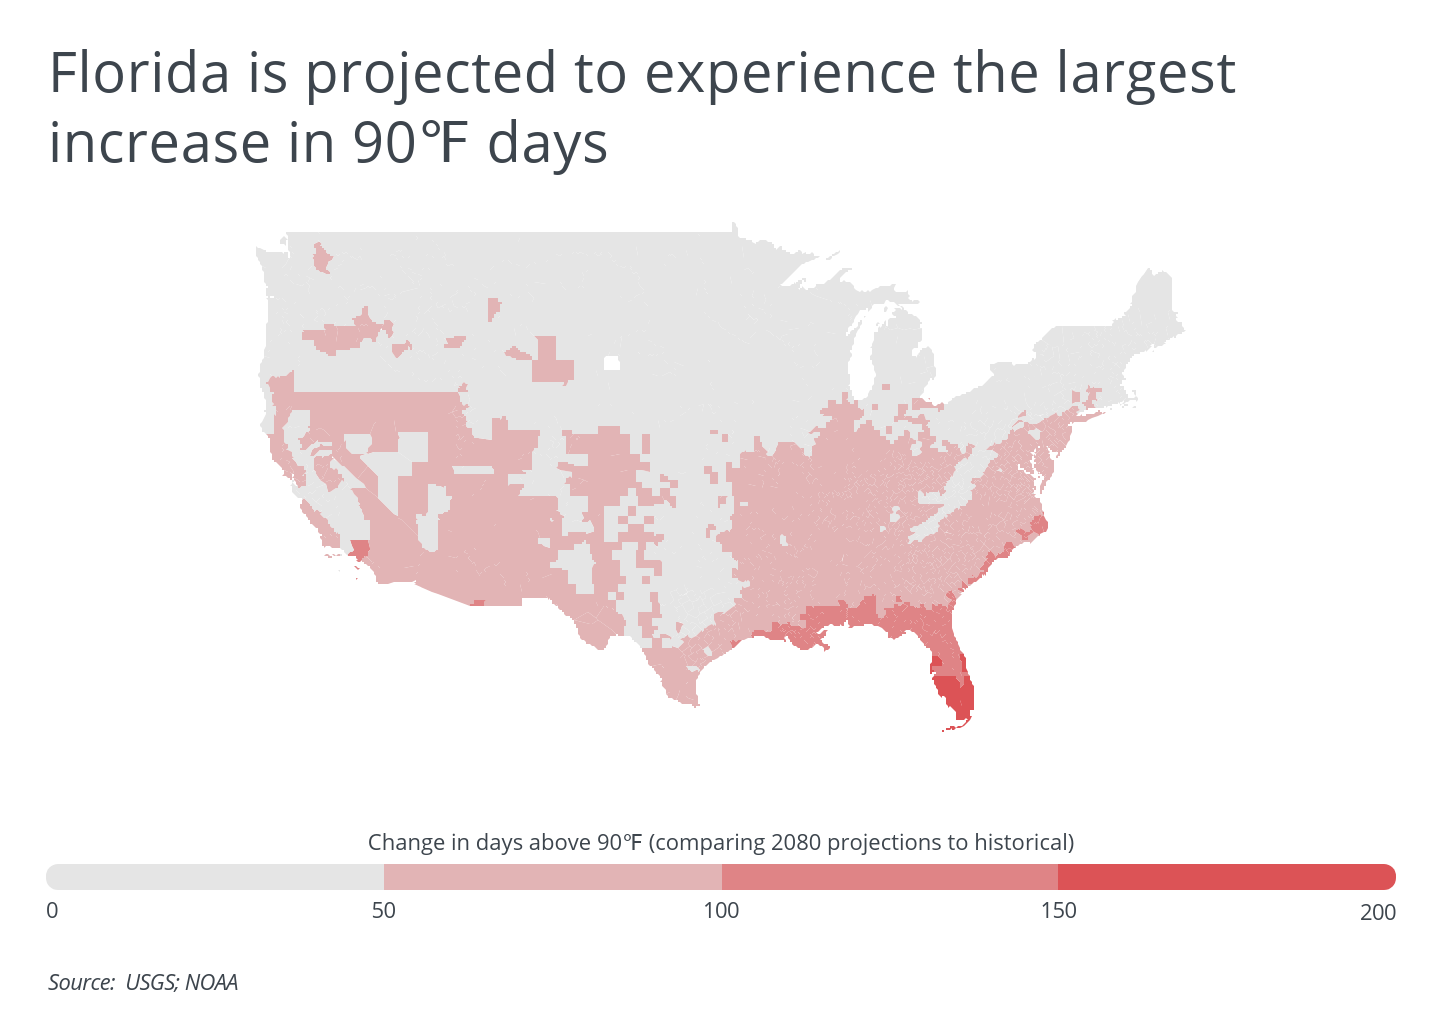
Under President Biden, the U.S. has pledged to cut greenhouse gas emissions by at least 50% by 2030. This pledge will require aggressive action and is almost double the target that the U.S. made under the 2015 Paris Climate Agreement. However, without significant action by the U.S. and other major polluting countries, scientists predict that global temperatures will continue to rise. In the absence of a significant curb in greenhouse gas emissions, data from the U.S. Geological Survey (USGS) shows that some parts of the U.S. will spend over 60% of the year with temperatures above 90℉ by the year 2080.
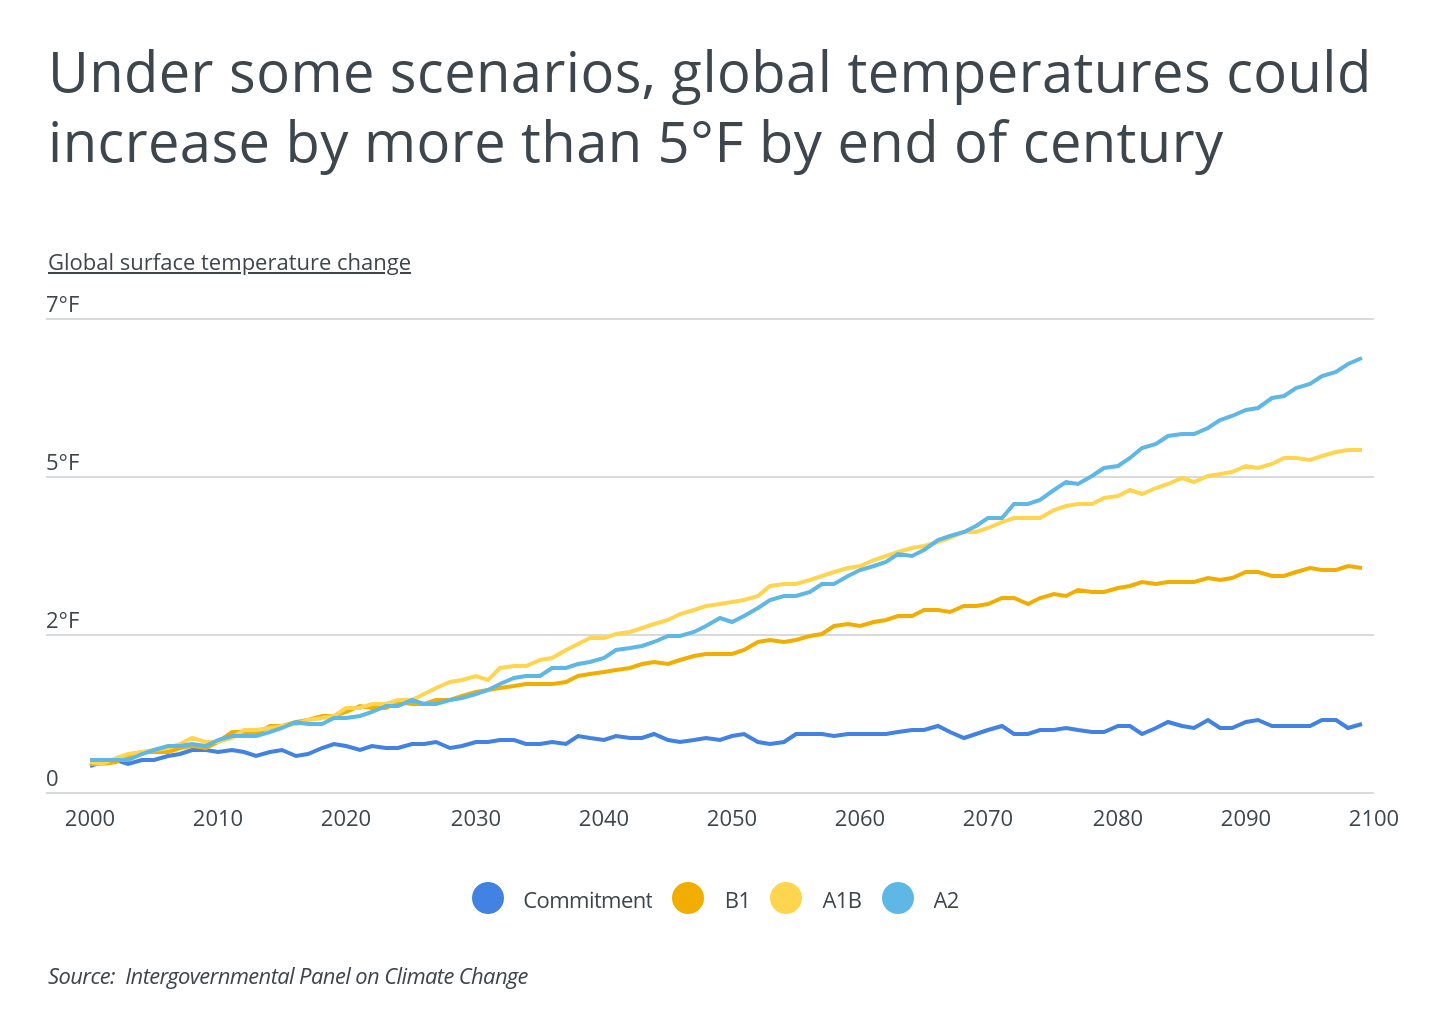
The Intergovernmental Panel on Climate Change (IPCC)—the United Nations body that evaluates the science related to climate change—predicts that under certain scenarios global temperatures could increase by upwards of 5℉ or 6℉ by the end of the century. In the most dire scenario (scenario A2), mean global surface temperatures would be nearly 6.5℉ higher relative to historical average temperatures from the years 1980 to 1999. However, global warming and temperature increases are not uniform, and some places will experience temperature increases that are much greater than average.
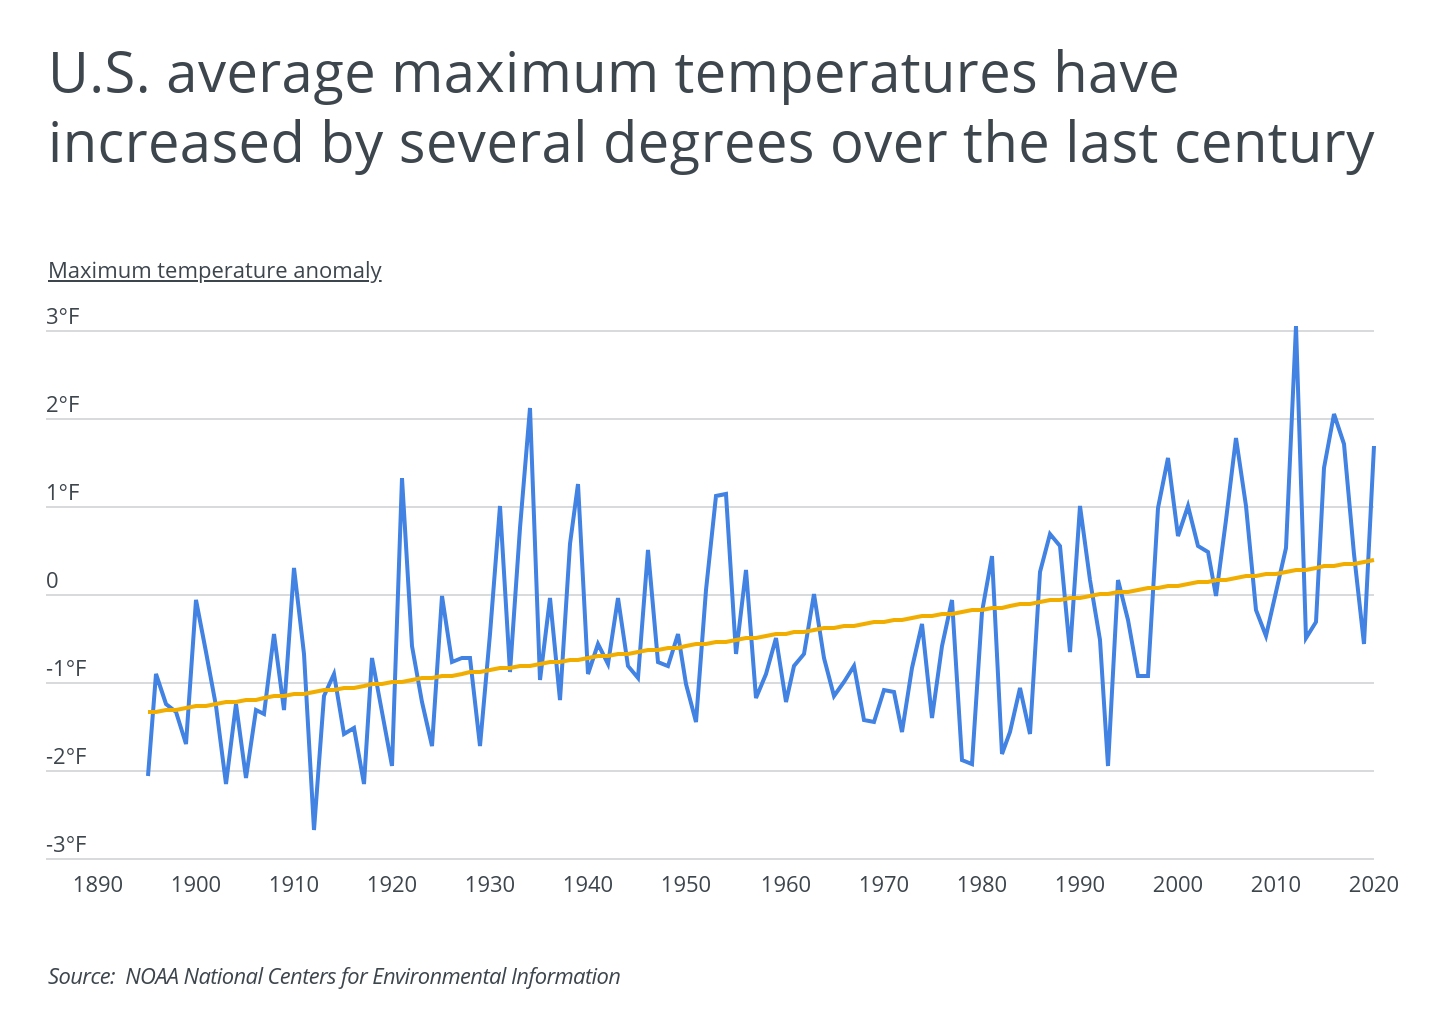
In addition to a rise in mean global temperatures, climate change will continue to bring more unusually hot summer days. In the U.S., mean maximum temperatures have increased by several degrees since the late 1800s. More common extreme summer heat waves will make living in some parts of the country more uncomfortable and dangerous. Heat can worsen droughts, and hot, dry conditions will increase wildfire risk. Human health will also be impacted as heat-related illnesses become more prevalent.
RELATED
Summer is around the corner. If it’s time to upgrade or replace your unit, find out what the typical hvac unit replacement cost is in your area with Porch.
Some parts of the U.S. already have a high number of extremely hot days every year, but even places with a more mild climate could see a significant increase in extreme temperature events. To find the counties projected to experience the hottest weather, researchers at Porch analyzed data from the USGS and NOAA. Researchers calculated the projected number of days per year with a temperature of 90℉ or higher for the year 2080, the historical number of days per year with a temperature of 90℉ or higher, and the historical average summer maximum and minimum temperatures. The projections assume the IPCC’s high emissions scenario (A2).
To improve relevance, only counties with at least 200,000 people were included in the analysis. Additionally, counties were grouped into the following cohorts based on population size:
- Small counties: 200,000–349,999
- Midsize counties: 350,000–749,999
- Large counties: 750,000 or more
Here are the counties projected to experience the hottest weather.

Large Counties Projected to Experience the Hottest Weather

Photo Credit: Alamy Stock Photo
15. Kern County, CA
- Projected number of days per year w/ temp above 90°F (for year 2080): 152
- Historical number of days per year w/ temp above 90°F: 119
- Historical average summer max temperature: 92.2°F
- Historical average summer min temperature: 61.4°F
TRENDING
Vinyl is very good at reflecting radiant heat. Some vinyl products can even reduce noise by as much as 45%. Learn what it would cost to install vinyl siding for your home.

Photo Credit: Alamy Stock Photo
14. Bexar County, TX
- Projected number of days per year w/ temp above 90°F (for year 2080): 158
- Historical number of days per year w/ temp above 90°F: 112
- Historical average summer max temperature: 94.9°F
- Historical average summer min temperature: 71.5°F

Photo Credit: Alamy Stock Photo
13. El Paso County, TX
- Projected number of days per year w/ temp above 90°F (for year 2080): 159
- Historical number of days per year w/ temp above 90°F: 94
- Historical average summer max temperature: 93.8°F
- Historical average summer min temperature: 65.8°F

Photo Credit: Alamy Stock Photo
12. Riverside County, CA
- Projected number of days per year w/ temp above 90°F (for year 2080): 161
- Historical number of days per year w/ temp above 90°F: 91
- Historical average summer max temperature: 97.1°F
- Historical average summer min temperature: 68.6°F

Photo Credit: Alamy Stock Photo
11. Clark County, NV
- Projected number of days per year w/ temp above 90°F (for year 2080): 168
- Historical number of days per year w/ temp above 90°F: 117
- Historical average summer max temperature: 95.9°F
- Historical average summer min temperature: 69.2°F

Photo Credit: Alamy Stock Photo
10. Pinellas County, FL
- Projected number of days per year w/ temp above 90°F (for year 2080): 175
- Historical number of days per year w/ temp above 90°F: 0
- Historical average summer max temperature: 89°F
- Historical average summer min temperature: 73.9°F

Photo Credit: Alamy Stock Photo
9. Hillsborough County, FL
- Projected number of days per year w/ temp above 90°F (for year 2080): 185
- Historical number of days per year w/ temp above 90°F: 51
- Historical average summer max temperature: 89.7°F
- Historical average summer min temperature: 71.6°F

Photo Credit: Alamy Stock Photo
8. Orange County, FL
- Projected number of days per year w/ temp above 90°F (for year 2080): 188
- Historical number of days per year w/ temp above 90°F: 57
- Historical average summer max temperature: 90.8°F
- Historical average summer min temperature: 71.1°F

Photo Credit: Alamy Stock Photo
7. Pima County, AZ
- Projected number of days per year w/ temp above 90°F (for year 2080): 191
- Historical number of days per year w/ temp above 90°F: 118
- Historical average summer max temperature: 97.5°F
- Historical average summer min temperature: 68.6°F

Photo Credit: Alamy Stock Photo
6. Miami-Dade County, FL
- Projected number of days per year w/ temp above 90°F (for year 2080): 204
- Historical number of days per year w/ temp above 90°F: 10
- Historical average summer max temperature: 89.8°F
- Historical average summer min temperature: 72.6°F

Photo Credit: Alamy Stock Photo
5. Maricopa County, AZ
- Projected number of days per year w/ temp above 90°F (for year 2080): 205
- Historical number of days per year w/ temp above 90°F: 139
- Historical average summer max temperature: 101.3°F
- Historical average summer min temperature: 72.5°F

Photo Credit: Alamy Stock Photo
4. Palm Beach County, FL
- Projected number of days per year w/ temp above 90°F (for year 2080): 209
- Historical number of days per year w/ temp above 90°F: 11
- Historical average summer max temperature: 90.2°F
- Historical average summer min temperature: 71.3°F

Photo Credit: Alamy Stock Photo
3. Lee County, FL
- Projected number of days per year w/ temp above 90°F (for year 2080): 211
- Historical number of days per year w/ temp above 90°F: 8
- Historical average summer max temperature: 90.8°F
- Historical average summer min temperature: 72.3°F
RELATED
How much does it cost to replace a bathtub? Use our cost calculator to find a range of prices in your area.

Photo Credit: Alamy Stock Photo
2. Broward County, FL
- Projected number of days per year w/ temp above 90°F (for year 2080): 212
- Historical number of days per year w/ temp above 90°F: 9
- Historical average summer max temperature: 90.2°F
- Historical average summer min temperature: 72.0°F

Photo Credit: Alamy Stock Photo
1. Hidalgo County, TX
- Projected number of days per year w/ temp above 90°F (for year 2080): 213
- Historical number of days per year w/ temp above 90°F: 132
- Historical average summer max temperature: 95.9°F
- Historical average summer min temperature: 74.3°F
Detailed Findings & Methodology
Perhaps not surprisingly, most of the counties projected to experience the greatest absolute number of extreme heat days (greater than 90°F) in the future are spread out across the southern United States. Interestingly, though, is that counties in Florida are projected to experience the largest increase in the number of extreme heat days when comparing future projections to the historical record. Historically, many coastal communities in Florida reported very few, if any, days that exceeded 90°F, but models predict these areas could experience more than 150 days of extreme heat annually as the end of the century approaches. Increases in temperature combined with Florida’s sea level rise risks make it one of the most vulnerable states to climate change.
To find the counties projected to experience the hottest weather, researchers at Porch analyzed the latest data from NOAA’s Climate Normals Dataset and the USGS’s 1/8th-degree-CONUS Daily Downscaled Climate Projections, accessed from the CDC’s National Environmental Public Health Tracking Network. The USGS data contains the projected number of days per year with a temperature of 90℉ or higher for the year 2080 under a high greenhouse gas emissions scenario (A2) as well as the historical number of days per year with a temperature of 90℉ or higher (using the average over the years 1980 to 2010). NOAA’s Climate Normals data provides the historical average summer maximum and minimum temperatures, averaged over the years 1901–2000.
To improve relevance, only counties with at least 200,000 people were included in the analysis. Additionally, counties were grouped into the following cohorts based on population size:
- Small counties: 200,000–349,999
- Midsize counties: 350,000–749,999
- Large counties: 750,000 or more


