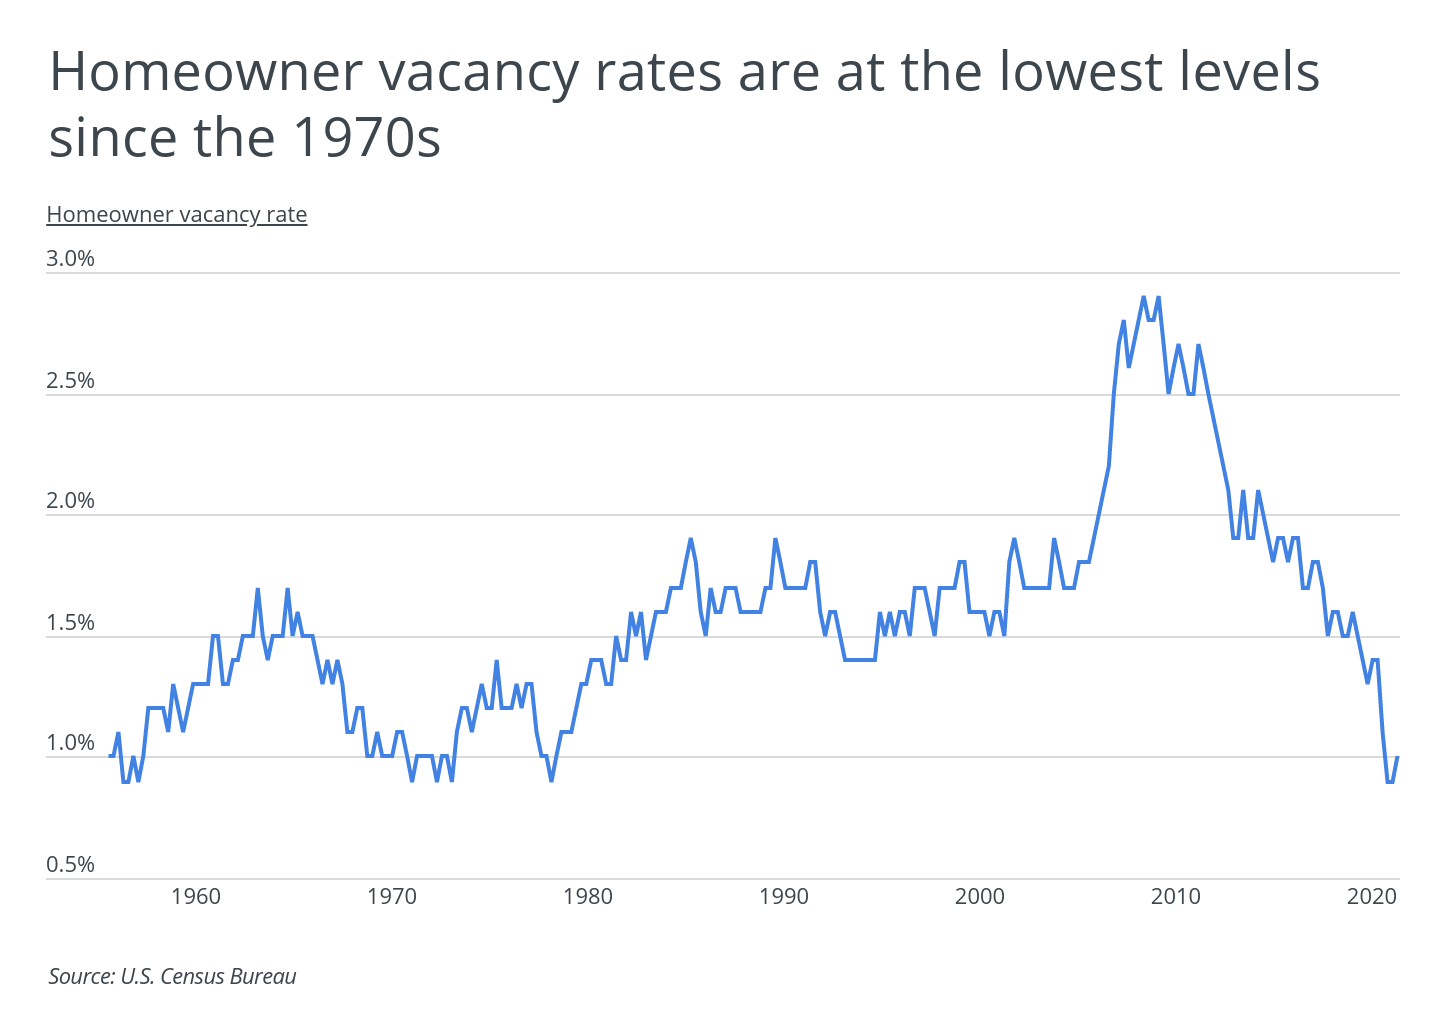
The U.S. is facing a severe housing shortage as the number of homes for sale hits new lows, driving up home prices and making homeownership less affordable. At the same time, buyers are eager to take advantage of record low interest rates. However, finding an affordable home in many parts of the country is incredibly challenging. According to the latest data from the Census Bureau, the homeowner vacancy rate—the share of owner-occupied housing units that are vacant and for sale—is just 1.0%.
Since reaching a record high of 2.9% in 2008 in the midst of the Great Recession, the homeowner vacancy rate in the U.S. has trended downward. After diving to 0.9% last spring in the early stages of the COVID-19 pandemic, the homeowner vacancy rate has inched back upwards. The low rate indicates a housing shortage at the national level, but tracking the homeowner vacancy rate at the metro level can help identify cities with bigger supply-demand imbalances. Changes in homebuyer preferences have resulted in large changes in vacancy rates year-over-year for some metros. The current shift towards working from home—and a shift in preferences away from crowded cities—has spurred demand for homes in smaller cities and towns.
Even before the COVID-19 pandemic hit, the construction industry was struggling to fill a severe housing shortage. The pandemic has only made this more challenging as construction in many parts of the country has faced stoppages, and the price of materials has increased. The number of new housing units authorized, housing starts, and new housing units completed fell drastically during the 2008 housing market collapse. While these numbers have been steadily climbing since 2012, they remain well below the levels seen in 2005. The current supply of new homes has not been able to keep pace with demand.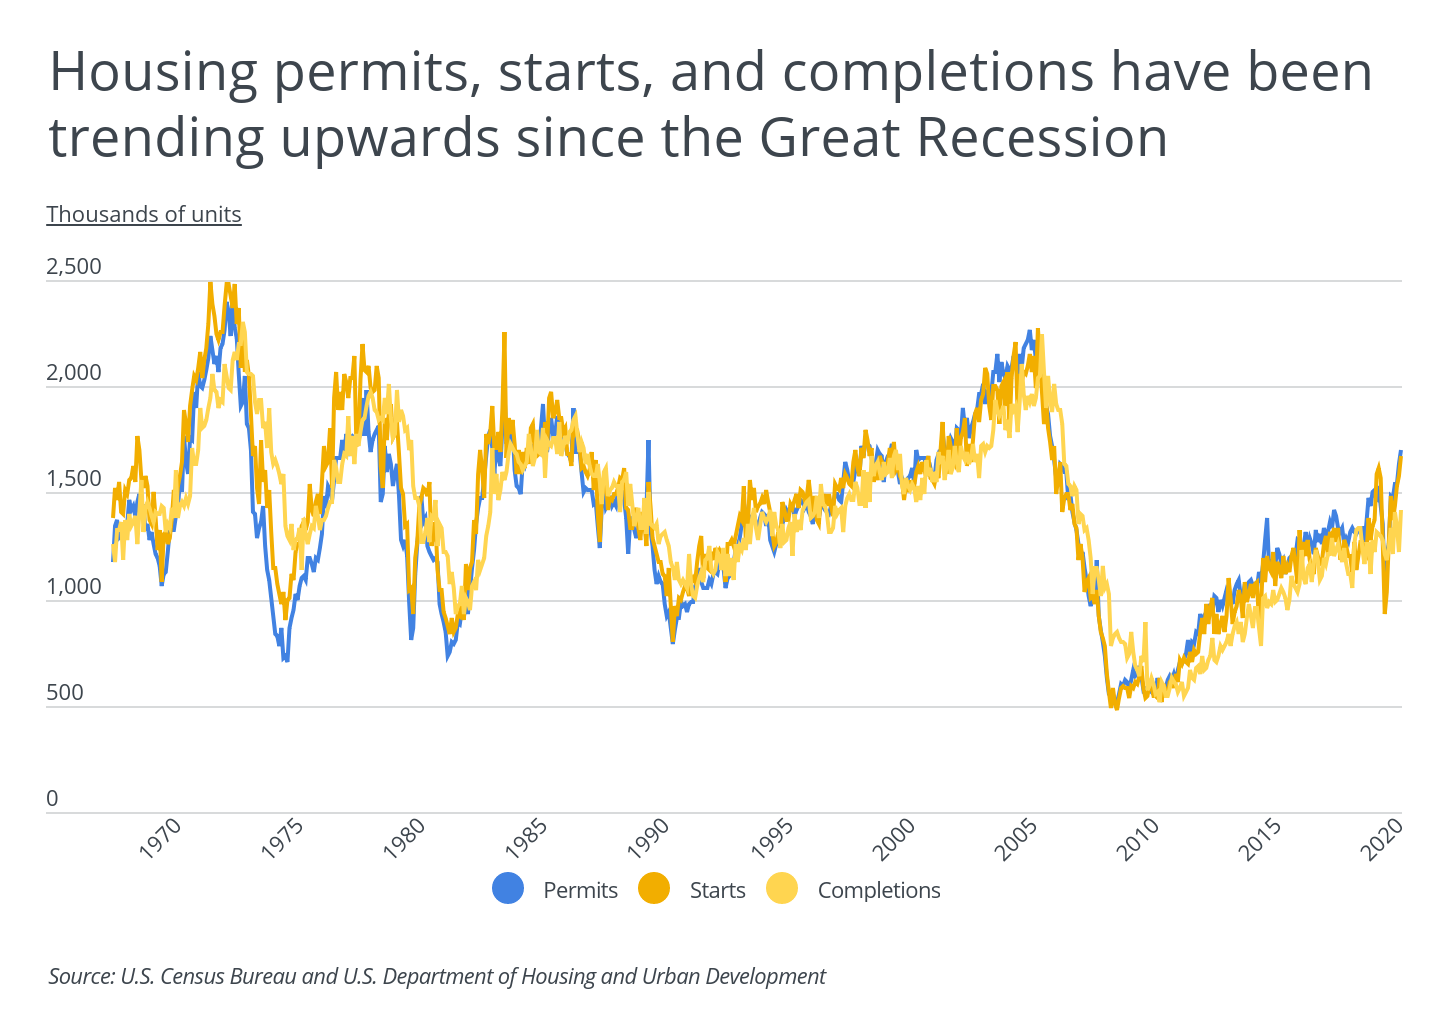
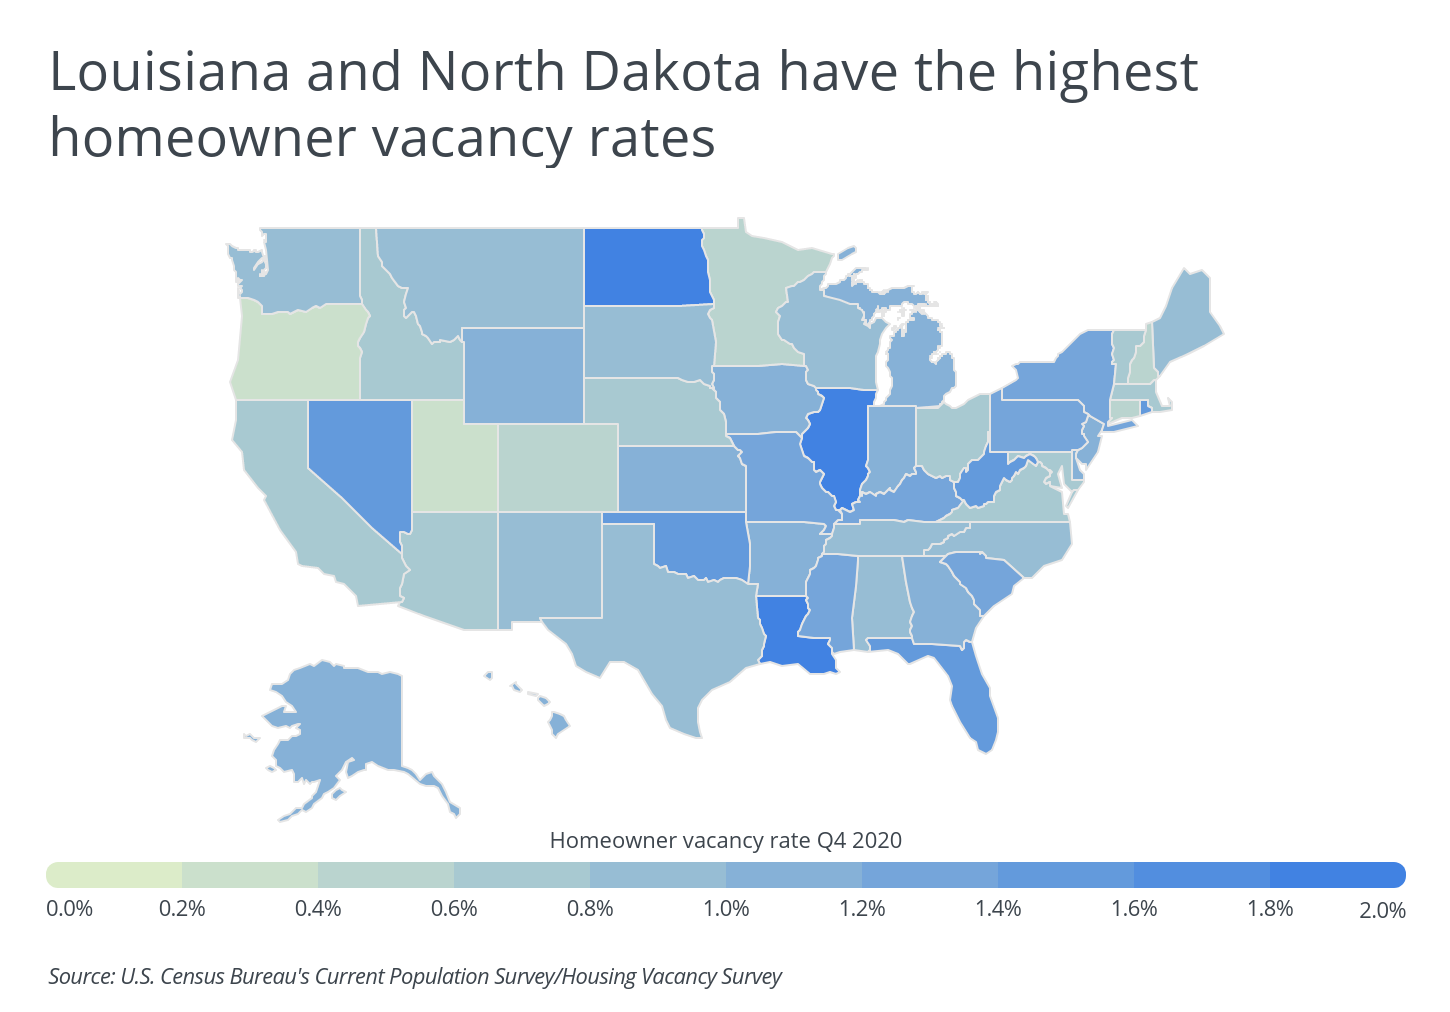
While the U.S. is grappling with a serious housing shortage nationally, the severity of the housing shortage varies widely by location due to factors such as affordability and local job market conditions. Overall, the Western U.S. has lower homeowner vacancy rates, indicating a lower stock of available homes, compared to the eastern half of the country. Louisiana and North Dakota have the highest homeowner vacancy rates in the U.S., at 2.0% and 1.9%, respectively. At the opposite end of the spectrum, Oregon and Utah, both with homeowner vacancy rates of 0.2%, have the lowest share of vacant homes in the country.
DID YOU KNOW?
You can increase the resale value of your home and get a little extra privacy with a wood privacy fence. Read all about wood fence installation to plan your project, and be sure to check out our fence cost calculator for pricing info about all types of fences.
To determine the metros with the highest (and lowest) homeowner vacancy rates, researchers at Porch analyzed data from the U.S. Census Bureau’s Current Population Survey/Housing Vacancy Survey and Building Permits Survey as well as home price data from Realtor.com. The researchers ranked metro areas according to homeowner vacancy rates in the fourth quarter of 2020. In the event of a tie, rates from previous quarters were used. Researchers also calculated the total housing units authorized in 2020, the median home price, and the homeownership rate.
Here are the metros with the highest and lowest homeowner vacancy rates.
Large Metros With the Highest Homeowner Vacancy Rates
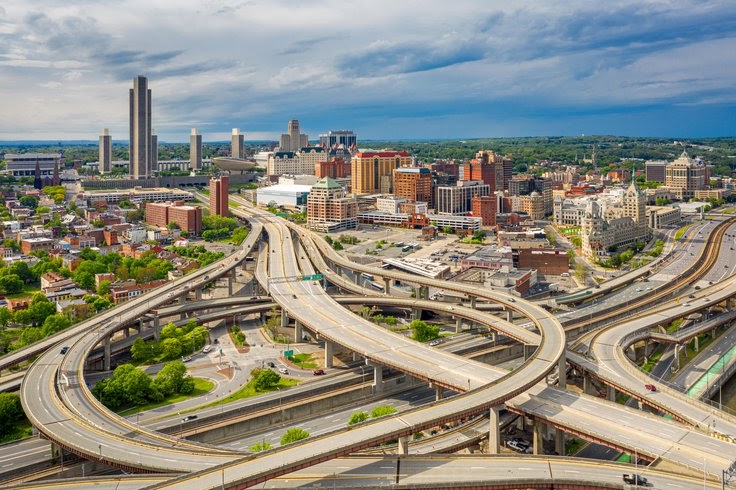
Photo Credit: Alamy Stock Photo
1. Albany-Schenectady-Troy, NY
- Homeowner vacancy rate Q4 2020: 4.9%
- Total housing units authorized in 2020 (per 10K residents): 23
- Median home price: $360,050
- Homeownership rate: 73.1%

Photo Credit: Alamy Stock Photo
2. Charleston-North Charleston, SC
- Homeowner vacancy rate Q4 2020: 3.7%
- Total housing units authorized in 2020 (per 10K residents): 107
- Median home price: $529,050
- Homeownership rate: 73.7%
RELATED
Whether you’re planning to put your house on the market soon, or if you just want to give your house a fresh look, power washing your home can work wonders. Learn how it works and how much it would cost to power wash a house with Porch.

Photo Credit: Alamy Stock Photo
3. Baton Rouge, LA
- Homeowner vacancy rate Q4 2020: 2.7%
- Total housing units authorized in 2020 (per 10K residents): 45
- Median home price: $275,050
- Homeownership rate: 71.6%
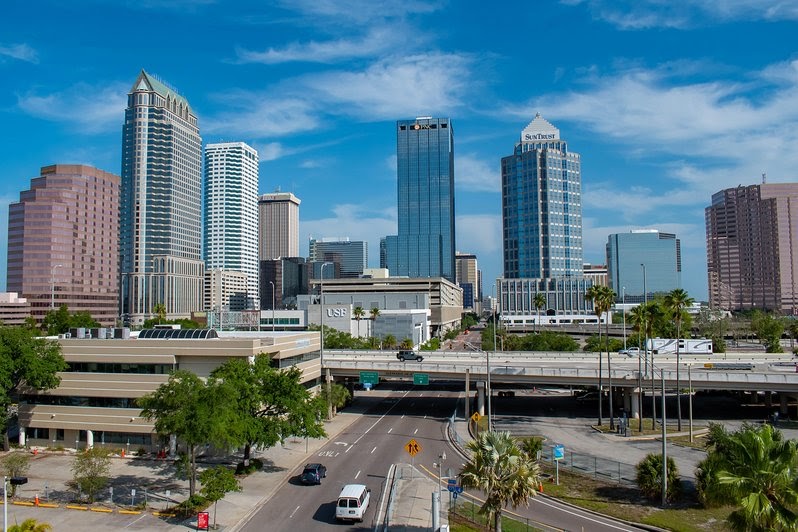
Photo Credit: Alamy Stock Photo
4. Tampa-St. Petersburg-Clearwater, FL
- Homeowner vacancy rate Q4 2020: 2.2%
- Total housing units authorized in 2020 (per 10K residents): 63
- Median home price: $302,380
- Homeownership rate: 69.3%
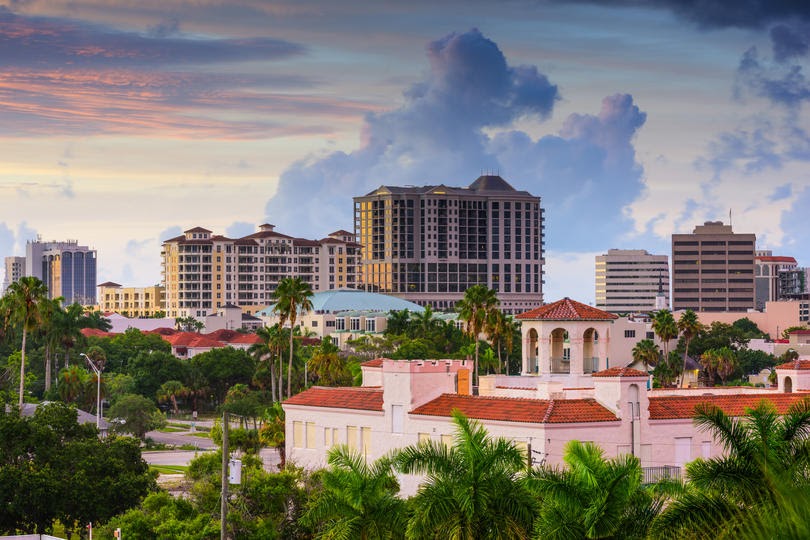
Photo Credit: Alamy Stock Photo
5. North Port-Sarasota-Bradenton, FL
- Homeowner vacancy rate Q4 2020: 1.9%
- Total housing units authorized in 2020 (per 10K residents): 113
- Median home price: $396,150
- Homeownership rate: 75.5%

Photo Credit: Alamy Stock Photo
6. Chicago-Naperville-Elgin, IL-IN-WI
- Homeowner vacancy rate Q4 2020: 1.9%
- Total housing units authorized in 2020 (per 10K residents): 16
- Median home price: $337,970
- Homeownership rate: 68.4%
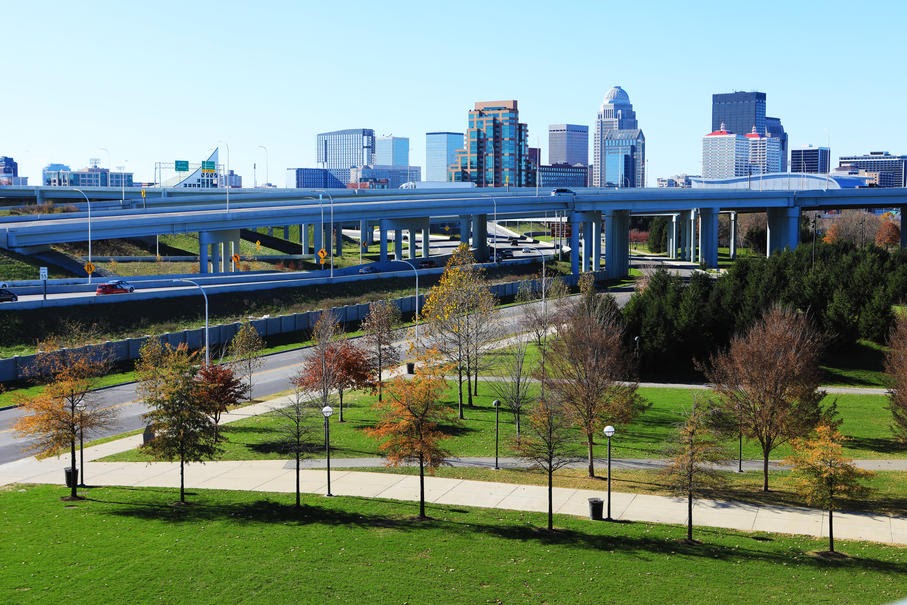
Photo Credit: Alamy Stock Photo
7. Louisville-Jefferson County, KY-IN
- Homeowner vacancy rate Q4 2020: 1.7%
- Total housing units authorized in 2020 (per 10K residents): 35
- Median home price: $249,950
- Homeownership rate: 66.8%

Photo Credit: Alamy Stock Photo
8. Little Rock-North Little Rock-Conway, AR
- Homeowner vacancy rate Q4 2020: 1.7%
- Total housing units authorized in 2020 (per 10K residents): 35
- Median home price: $232,950
- Homeownership rate: 66.5%

Photo Credit: Alamy Stock Photo
9. Tulsa, OK
- Homeowner vacancy rate Q4 2020: 1.7%
- Total housing units authorized in 2020 (per 10K residents): 49
- Median home price: $294,950
- Homeownership rate: 62.1%

Photo Credit: Alamy Stock Photo
10. Charlotte-Concord-Gastonia, NC-SC
- Homeowner vacancy rate Q4 2020: 1.5%
- Total housing units authorized in 2020 (per 10K residents): 92
- Median home price: $385,050
- Homeownership rate: 74.9%
Large Metros With the Lowest Homeowner Vacancy Rates
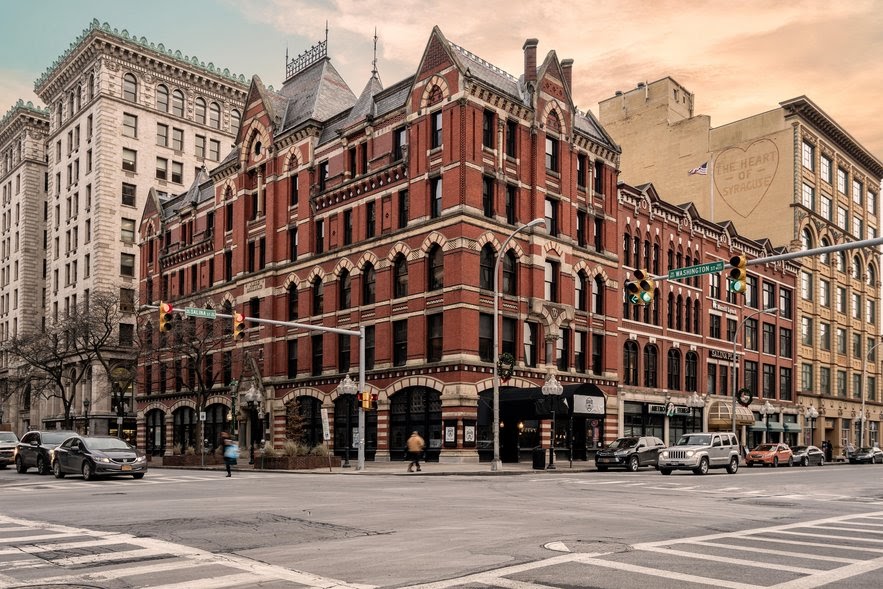
Photo Credit: Alamy Stock Photo
1. Syracuse, NY
- Homeowner vacancy rate Q4 2020: <0.05%
- Total housing units authorized in 2020 (per 10K residents): 4
- Median home price: $189,950
- Homeownership rate: 65.3%
TRENDING
In the colder months, it’s important to have a working and reliable water heater. If it’s about time to replace yours, find out how much a water heater costs and what the labor cost to install a water heater is.
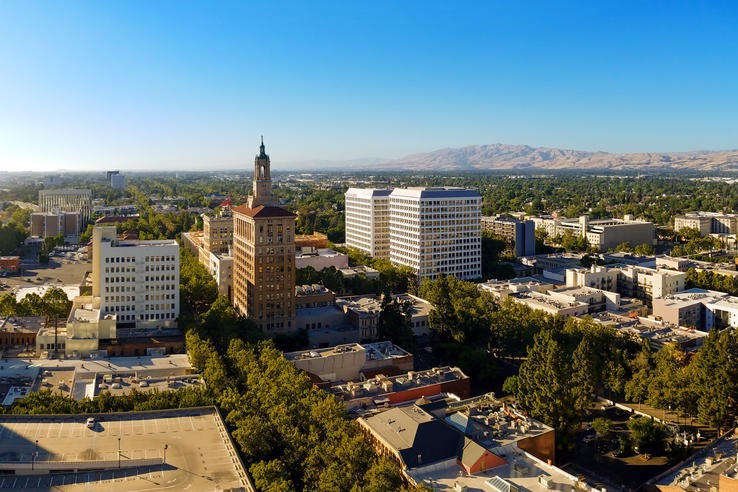
Photo Credit: Alamy Stock Photo
2. San Jose-Sunnyvale-Santa Clara, CA
- Homeowner vacancy rate Q4 2020: <0.05%
- Total housing units authorized in 2020 (per 10K residents): 30
- Median home price: $1,198,938
- Homeownership rate: 51.6%
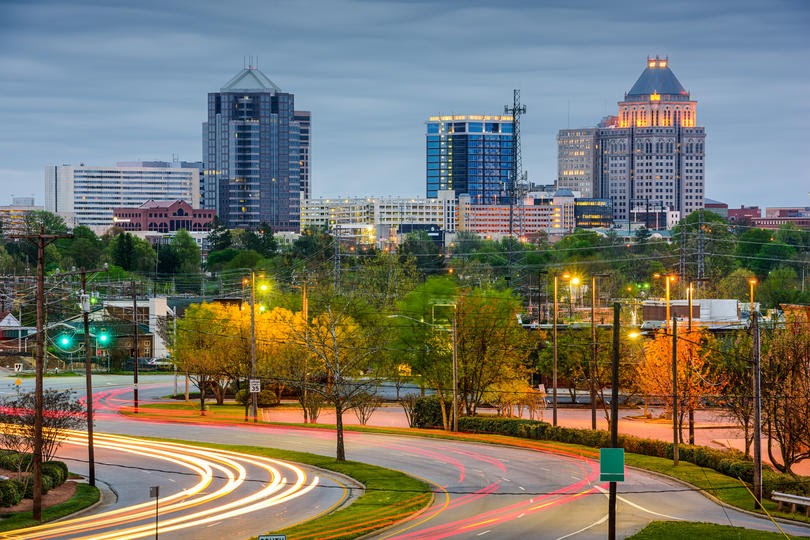
Photo Credit: Alamy Stock Photo
3. Greensboro-High Point, NC
- Homeowner vacancy rate Q4 2020: <0.05%
- Total housing units authorized in 2020 (per 10K residents): 41
- Median home price: $279,050
- Homeownership rate: 66.9%
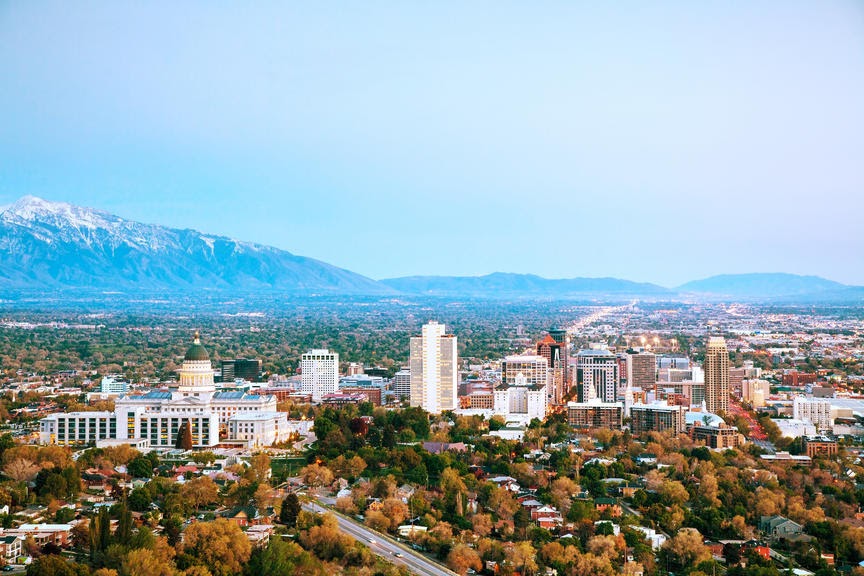
Photo Credit: Alamy Stock Photo
4. Salt Lake City, UT
- Homeowner vacancy rate Q4 2020: <0.05%
- Total housing units authorized in 2020 (per 10K residents): 89
- Median home price: $599,950
- Homeownership rate: 69.3%

Photo Credit: Alamy Stock Photo
5. New Haven-Milford, CT
- Homeowner vacancy rate Q4 2020: <0.05%
- Total housing units authorized in 2020 (per 10K residents): 13
- Median home price: $289,950
- Homeownership rate: 62.0%

Photo Credit: Alamy Stock Photo
6. Akron, OH
- Homeowner vacancy rate Q4 2020: <0.05%
- Total housing units authorized in 2020 (per 10K residents): 8
- Median home price: $145,050
- Homeownership rate: 66.4%
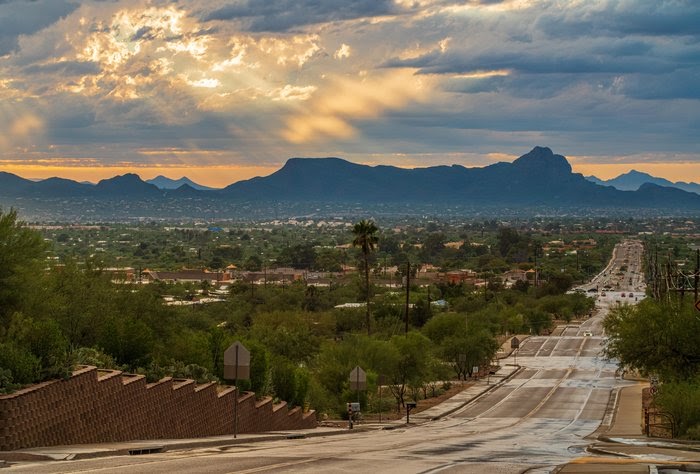
Photo Credit: Alamy Stock Photo
7. Tucson, AZ
- Homeowner vacancy rate Q4 2020: <0.05%
- Total housing units authorized in 2020 (per 10K residents): 47
- Median home price: $340,050
- Homeownership rate: 61.0%

Photo Credit: Alamy Stock Photo
8. Bridgeport-Stamford-Norwalk, CT
- Homeowner vacancy rate Q4 2020: <0.05%
- Total housing units authorized in 2020 (per 10K residents): 20
- Median home price: $747,050
- Homeownership rate: 63.3%
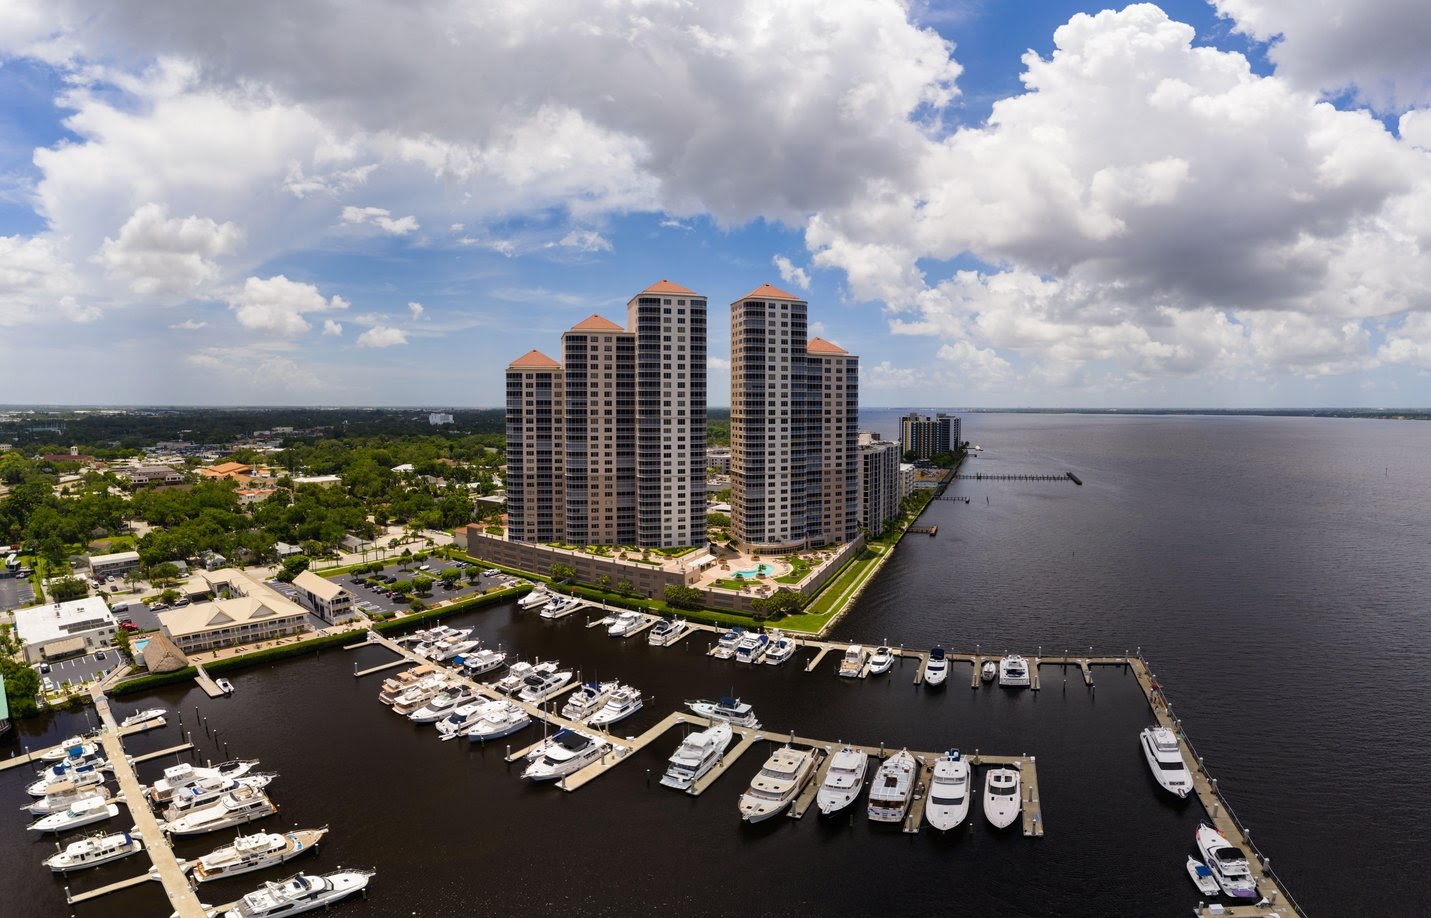
Photo Credit: Alamy Stock Photo
9. Cape Coral-Fort Myers, FL
- Homeowner vacancy rate Q4 2020: <0.05%
- Total housing units authorized in 2020 (per 10K residents): 139
- Median home price: $340,000
- Homeownership rate: 79.2%
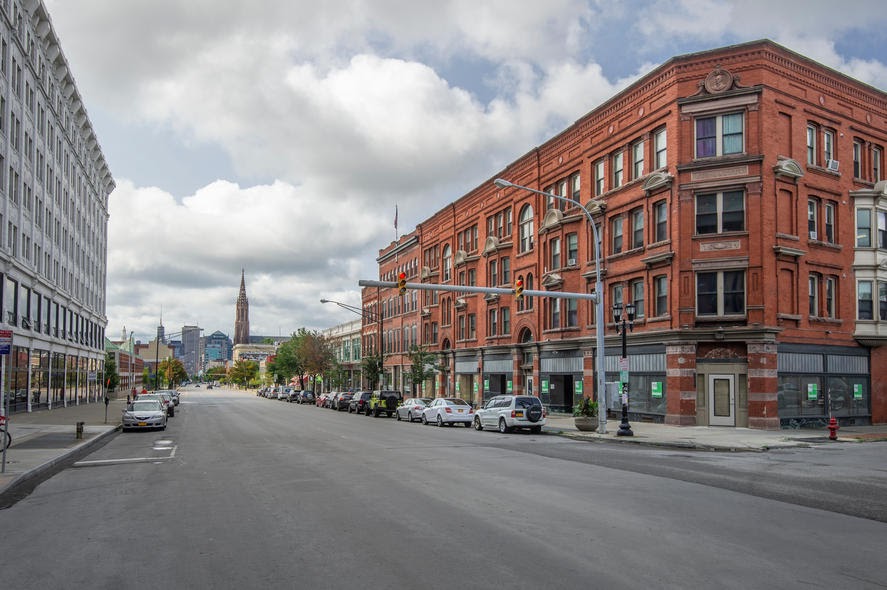
Photo Credit: Alamy Stock Photo
10. Buffalo-Cheektowaga, NY
- Homeowner vacancy rate Q4 2020: 0.3%
- Total housing units authorized in 2020 (per 10K residents): 13
- Median home price: $240,050
- Homeownership rate: 73.2%
Detailed Findings & Methodology
The metros with the most vacant homes are scattered across the East Coast, Midwest, and South. At nearly 5.0% and almost five times the national rate, the Albany metro area has the highest homeowner vacancy rate. The homeownership rate in Albany—73.1%—is also higher than the national rate (65.8%). Indeed, homeownership rates are higher than the national rate for all the metros in the top 10 except for the Tulsa metro area. Home prices in these metros skew lower than the national level.
Among the metros with the fewest vacant homes, home prices in these metros vary substantially, ranging from quite low to very high compared to the national median. There’s also no strong correlation between vacancies and construction activity, indicating that some areas will continue to face significant housing shortages/surpluses in the coming years.
To determine the metros with the highest (and lowest) homeowner vacancy rates, researchers analyzed the latest data from the U.S. Census Bureau’s Current Population Survey/Housing Vacancy Survey. Researchers also used the Census Bureau’s Building Permits Survey in their analysis, as well as home price data from Realtor.com. The researchers ranked the 75 largest metropolitan areas by their homeowner vacancy rate in the fourth quarter of 2020. In the event of a tie, the metro with the higher homeowner vacancy rate for the previous quarter (or quarters) was ranked higher. Researchers sourced the total housing units authorized in 2020 from the Building Permits Survey—adjusted per 10,000 residents using population data from the Census Bureau—and the median home price data from Realtor.com. Homeownership rates are from the Current Population Survey/Housing Vacancy Survey.


