
Live in it or list it?
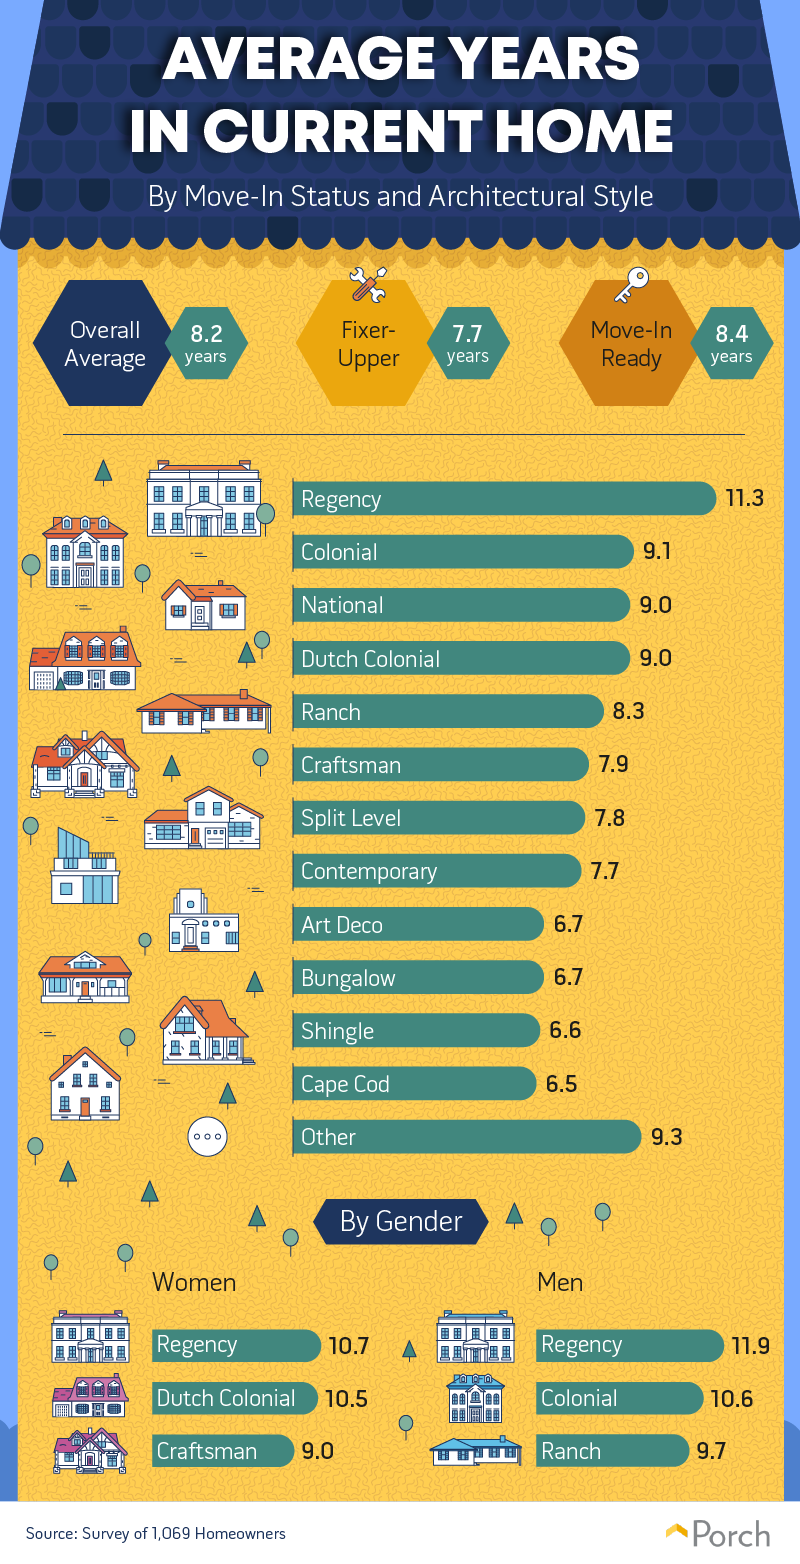 Homebuyers told the National Association of Realtors they expected to live in their home for a median of 15 years. Nearly one-fifth of buyers in 2018 said they planned never to leave their new home. Intention is one thing, but the reality can be something else. We asked survey respondents how long they lived in their current home. Then we looked at its move-in status and how architectural style impacted a home’s longevity. Overall, people stayed longer in their move-in ready homes. Of all architectural styles, regency homeowners reported living in their current residence the longest. They lived in their regency home for over two years longer than any other homeowner group. This was true for both men and women, although women reported living in their regency home longer than men. For men, Dutch colonial homes proved almost as sticky as regency homes. Women also tended to stay in colonial homes for over a decade, but they were more likely to be of the standard colonial style as opposed to Dutch colonial. The architectural styles with the shortest longevity were Cape Cod and shingle homes. So if you’re shopping for your forever home, you might steer away from these two.
Accidental fixer-uppers
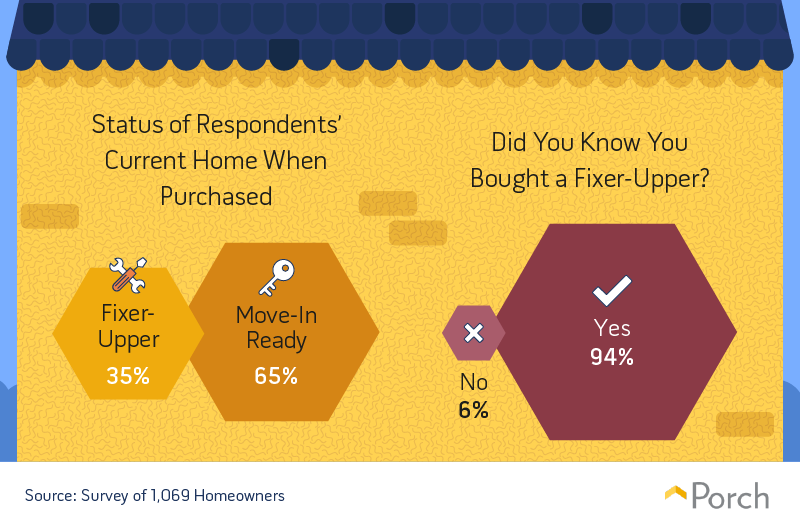 Considering the average purchase price of a fixer-upper on the TV show “Fixer Upper”, based in Waco, Texas ($178,449) and the average resale value ($297,488), fixer-uppers have their appeal. Yet, despite the difference in purchase price and after repair resale value, the majority of survey respondents opted for move-in ready homes for their current residence. Over one-third of our survey respondents live in fixer-uppers. Of those who did buy a fixer-upper, most said they knew what they were getting into. An unfortunate few thought they were getting a turnkey home. Luckily, only 6 percent were accidental fixer-upper homeowners. Most homebuyers got what they wanted.
Staying on budget?
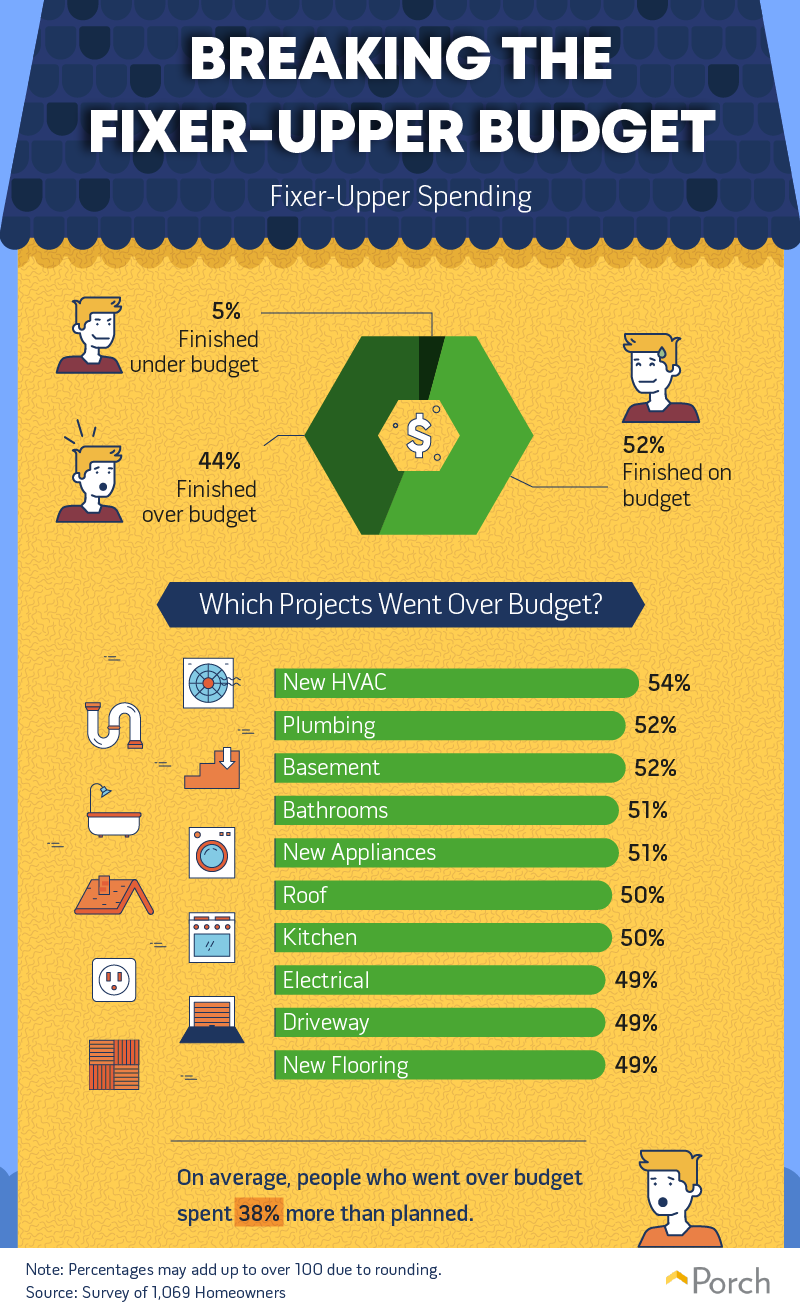 Here’s something you could do with that extra $100,000 you saved by buying a fixer-upper: Use it to put in new HVAC and plumbing. New HVAC and plumbing projects were most likely to go over budget, according to fixer-upper homeowners. Other common over-budget renovations included new appliances, electrical, and new flooring. The rooms most likely to go over budget were basements and bathrooms, with kitchens not far behind. Over half of fixer-upper homeowners managed to stay on budget, but 44 percent spent more than planned, going over budget by 38 percent on average. A scarce few (5 percent) managed to stay under budget on their fixer-uppers. To those under-spenders, we salute you.
Why buy a turnkey home?
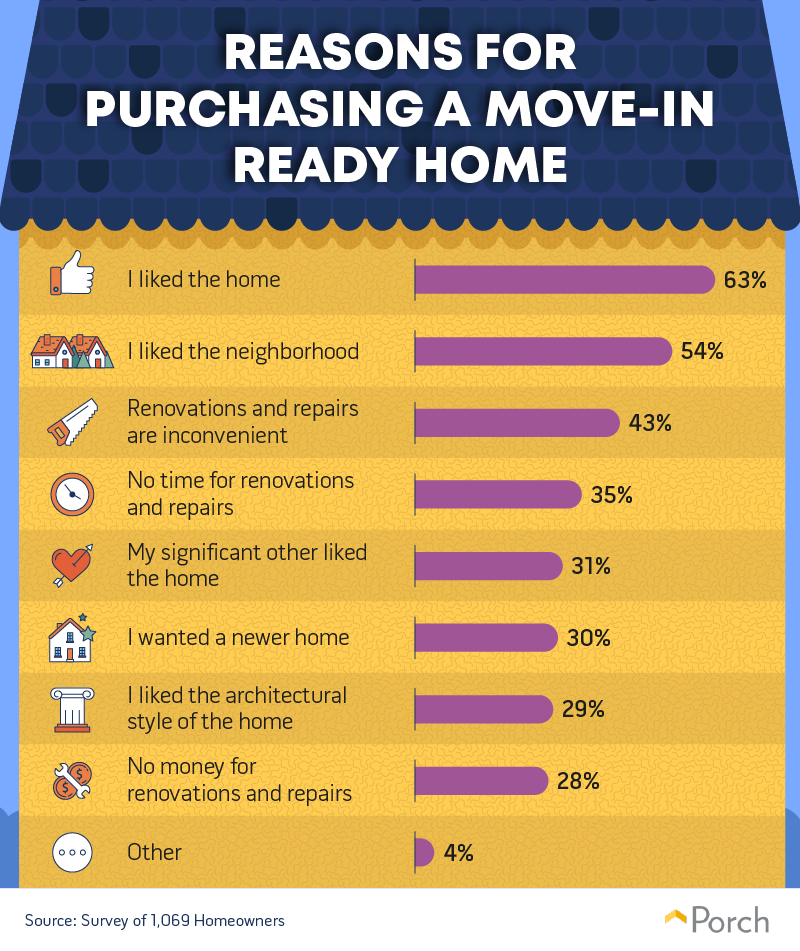 Knowing America’s (and Joanna Gaines’) love of a good deal, we asked homeowners why they bought a move-in ready home. Most homeowners chose turnkey because they liked the home (63 percent) or the neighborhood (54 percent). If it ain’t broke, why fix it, right? Especially considering how inconvenient and time-consuming renovating can be. In fact, the inconvenience and time required to make repairs and renovations were the next most cited reasons for choosing turnkey homes. They were an even greater deterrent for homebuyers than the cost of repairing a fixer-upper.
Why buy a fixer-upper?
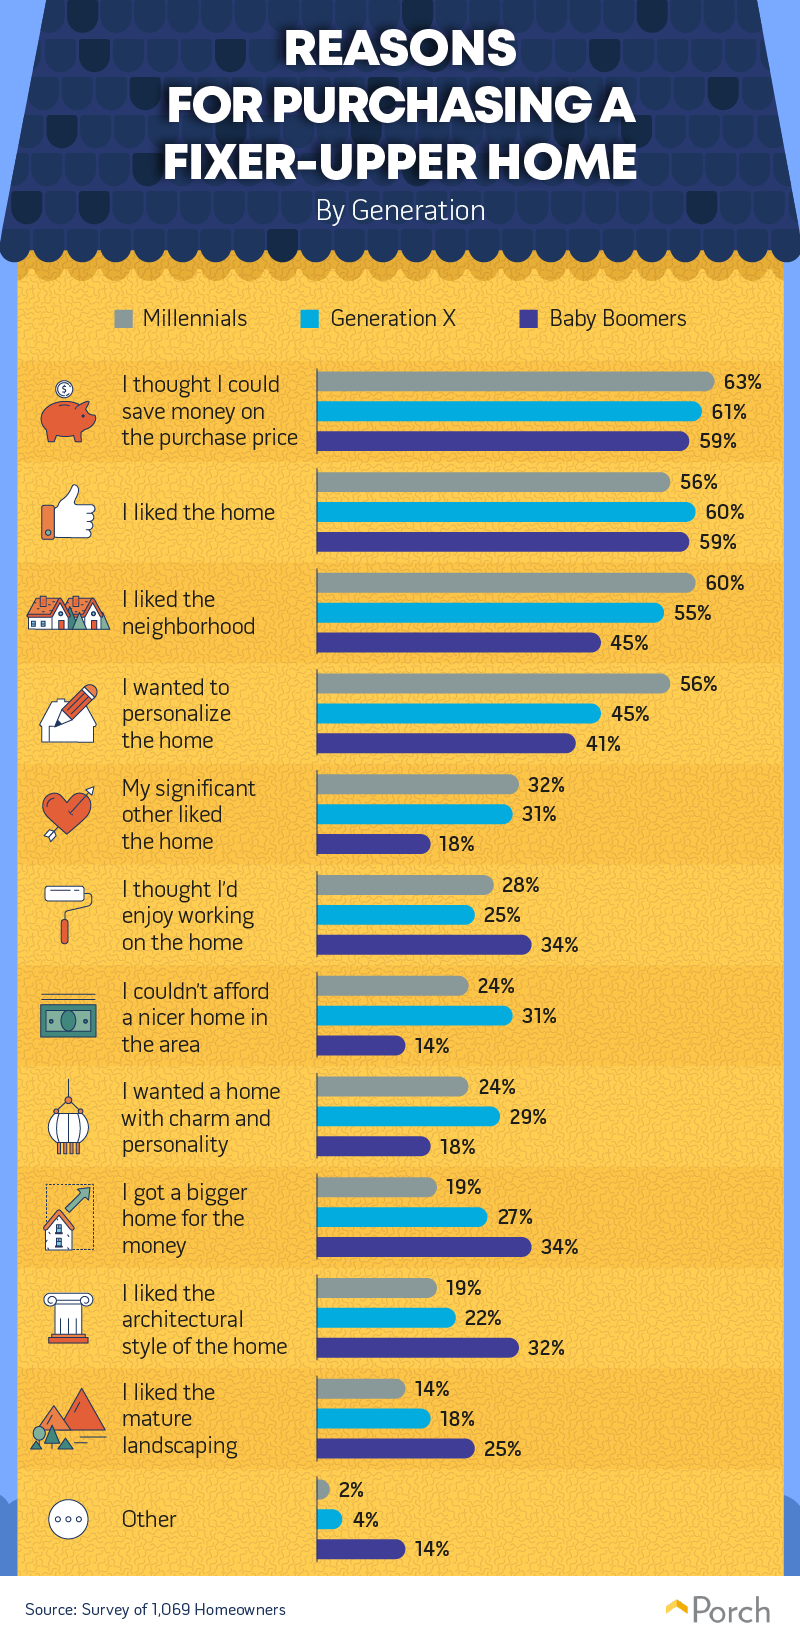 Homeowners who chose to buy a fixer-upper were also likely to do so because they liked the home or neighborhood. But even more chose a fixer-upper because they thought they could save money on the purchase price. Millennials were the most likely to put price ahead of home or neighborhood appeal. Gen Xers and baby boomers were almost as likely to choose a fixer-upper because they liked the home or location as they were to buy because the price was right. Baby boomers were more likely than Gen Xers and millennials to fix up a home because they thought they’d enjoy doing it. Gen Xers were more likely than any other generation to choose a fixer-upper because they wanted a home with charm and personality. Meanwhile, millennials were the most eager to personalize their fixer-upper home.
Dollars and cents
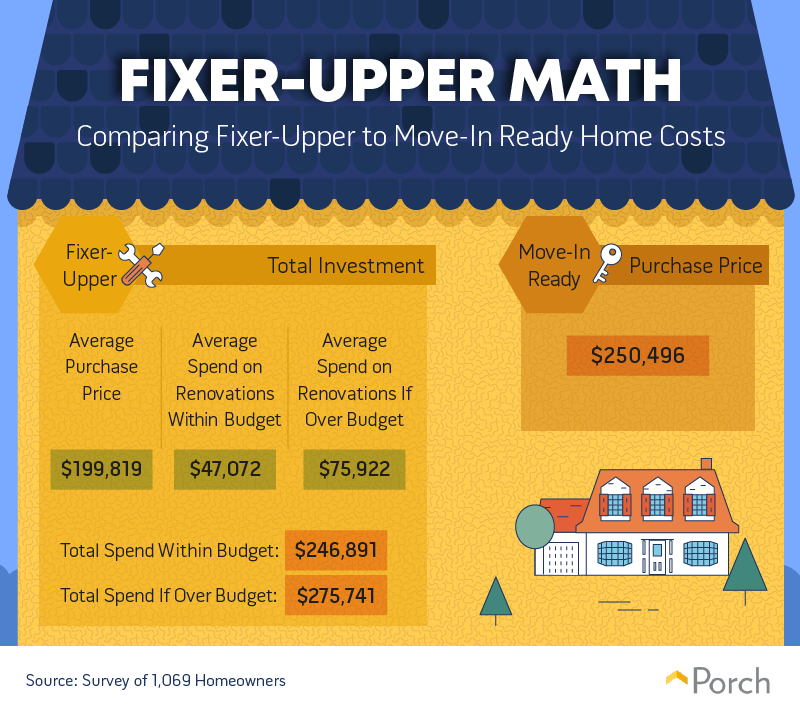 Even though the majority of fixer-upper homeowners thought they could save money, they actually spent about the same or more than their move-in ready counterparts. On average, respondents paid just over $250,000 for move-in ready homes. Meanwhile, fixer-uppers cost slightly under $200,000, on average. After renovations, though, fixer-upper homeowners ended up spending almost $247,000 in total when they managed to stay within budget. Fixer-upper homeowners who went over budget spent over $25,000 more than move-in ready homebuyers for a total cost of $275,741.
Home do-overs
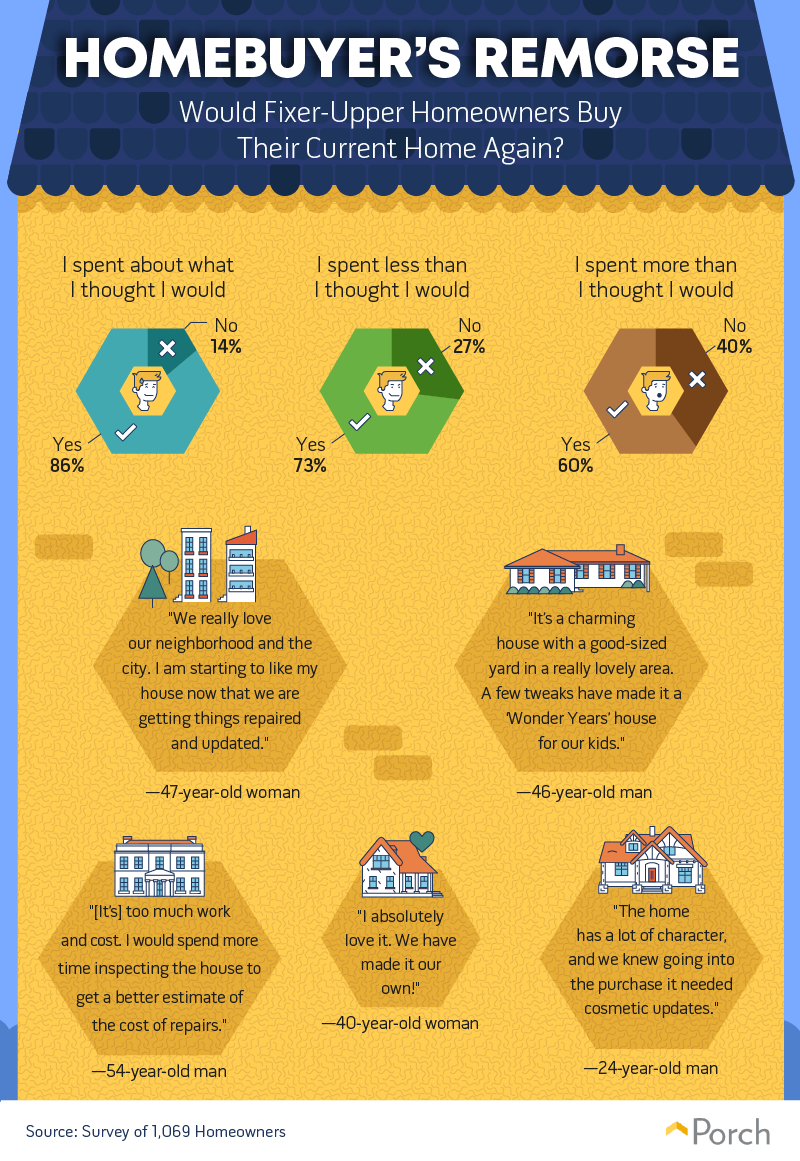 When it’s all said and done, would fixer-upper home buyers do it all again? The answer is that it depends. Eighty-six percent of homeowners who spent about what they thought they would on renovations would buy the same house again compared to only 60 percent of those who went over budget. If they could do it again, regretful fixer-upper homeowners say they would spend more time on inspections and be sure to get better cost estimates for the repairs their home needed. The best ways to avoid fixer-upper regret according to the co-hosts of HGTV’s “Property Brothers” is to budget appropriately and then spend wisely. If you’re a newer home renovator, start on smaller projects first, then build up to bigger renovations with an eye toward function over aesthetic.
Influence of home improvement shows
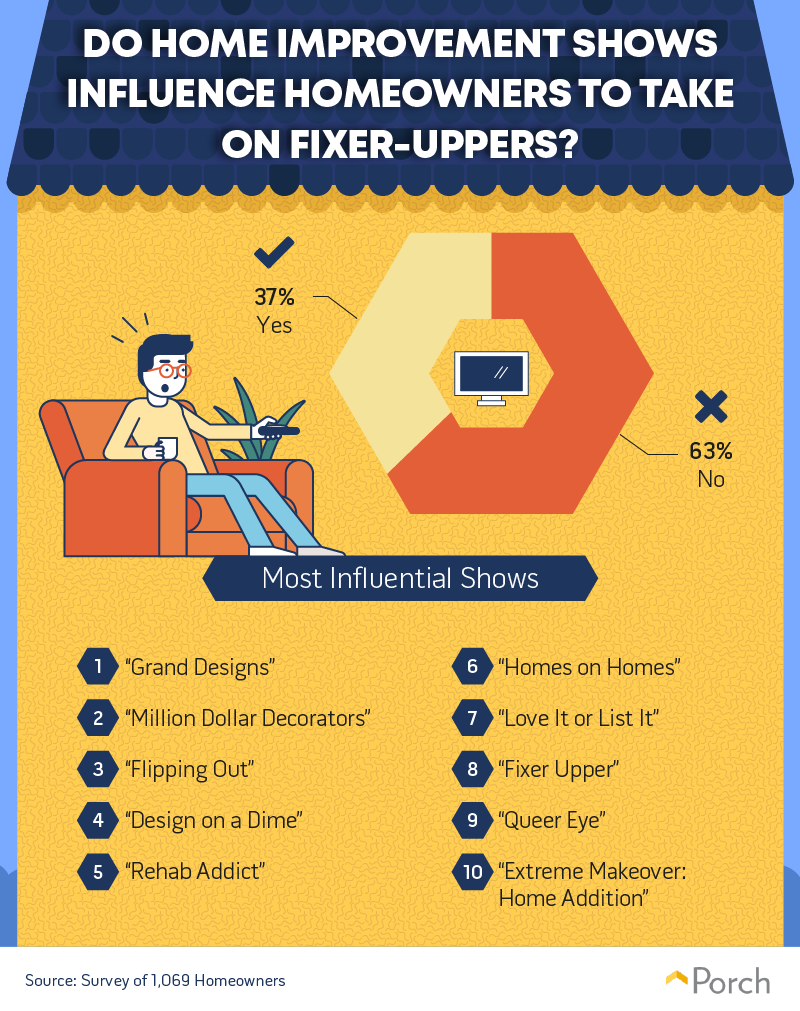 This leads us to the real question that keeps us up at night: How influential are shows like “Fixer Upper” on homeowners’ purchase decisions? Does watching a home improvement show inspire people to take on their own home projects? The answer, it turns out, is probably not. Almost two-thirds of fixer-upper homebuyers said home improvement shows had no influence on their purchase decision. That said, certain shows had greater influence than others. While not the most popular show by viewership, “Grand Designs” watchers said they were influenced most to take on a project home. “Fixer Upper” audiences were in eighth place. Sorry, Joanna. In fact, “Queer Eye” was nearly as influential as “Fixer Upper” coming in at ninth place overall.
Fix it or leave it?
Whether you’re elbow-deep in fixer-upper renovations or just dipping your finger into surface improvements on your turnkey home, adding a touch of customization to your home can be one of life’s most rewarding projects. At Porch, we want to help you transform your house into your dream home with the right windows and appliances. Tell us what you need to make your dream a reality, and we’ll help you get started. From HVAC to landscapes, we’re here to help you find the help and resources you need at a price that’ll fit your budget.
Methodology and limitations
We conducted a survey of 1,069 homeowners who live in the United States. 1,779 people attempted to take the survey; however, 710 people were disqualified because they were not homeowners. Of the final 1,069 respondents, 51 percent were women, 48 percent were men, and less than 1 percent chose not to identify their gender. Respondents ranged in age from 19 to 77 with a median age of 37. To collect the highest quality data possible, we used an attention-check question to assist in identifying respondents who didn’t answer questions truthfully or rushed through answers. Respondents who were clearly not paying attention or failed the attention-check were disqualified from the final analysis. The survey data we are presenting is self-reported by respondents. Selective memory, telescoping, attribution, and exaggeration are some of the known issues with self-reported survey data. When stating how long people had lived in their current home, we couldn’t identify how long they intended to stay in their current home. Respondents were asked if any home improvement shows influenced them to purchase a fixer-upper. If respondents said the show influenced them “a great deal,” “somewhat,” or “very much,” they were grouped into the “yes” cohort. If respondents responded “not at all” or “very little,” they were grouped into the “no” cohort. For the “Fixer-Upper Math” graphic, we exclude outliers from the calculations to avoid skewed data. Finally, to determine if a home was move-in ready or a fixer-upper, we asked respondents to identify the status of the home they currently lived in upon moving in. If respondents said it needed “very few repairs” or if it was “completely move-in ready,” they were grouped into the “move-in ready” bucket. If respondents said their home “needed some repairs,” “needed a lot of repairs,” or “needed virtually everything repaired,” they were grouped into the “Fixer-Upper” bucket.
Sources
- https://info.bankofamerica.com/homebuyers-report/
- https://www.nar.realtor/sites/default/files/documents/2018-home-buyers-and-sellers-generational-trends-03-14-2018.pdf
- https://www.architecturaldigest.com/story/little-known-fixer-upper-facts
- https://www.zillow.com/home-values/
- https://www.bobvila.com/slideshow/meet-the-next-generation-of-high-tech-kitchen-appliances-48628
- https://www.cnbc.com/2019/01/22/property-brothers-advice-for-the-68-percent-of-millennials-who-would-buy-a-fixer-upper.html
Fair use statement
If you like the work we put into this article, please use our images and data for noncommercial purposes. When you do share it with your own audience, make sure to attribute this page with a link so that we can get credit for fixing this page up!
