
Resident realities
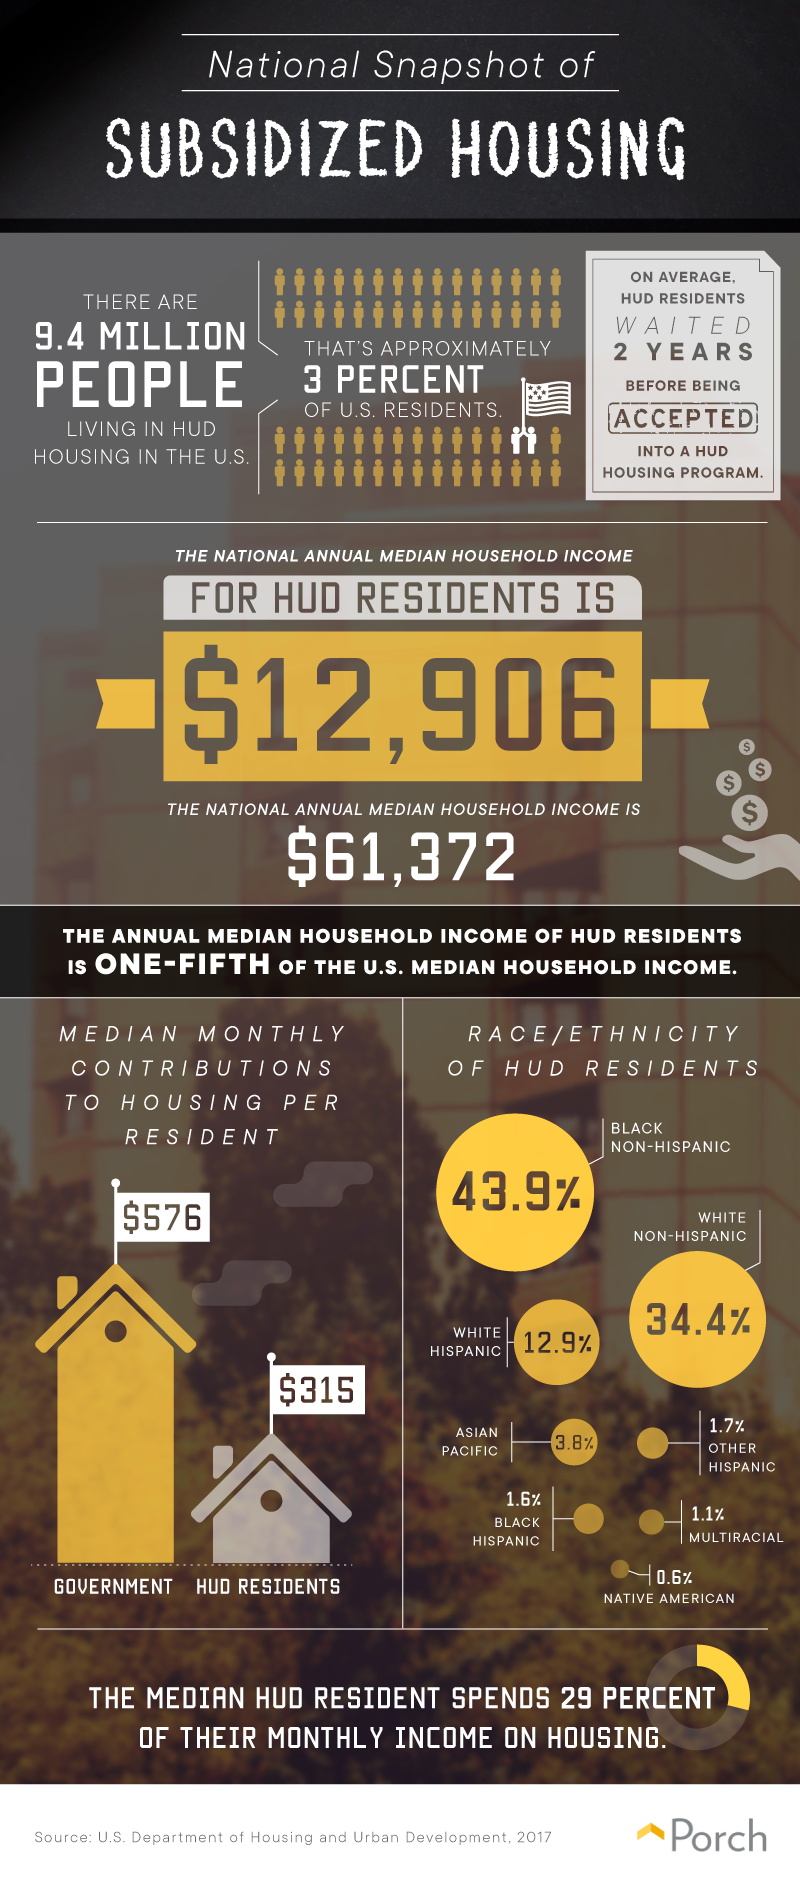 According to HUD data, 9.4 million Americans reside in federally subsidized housing, accounting for roughly 3 percent of the national population. The residents are beneficiaries of one of three major forms of federal housing assistance: public housing, privately owned subsidized housing, and the housing choice voucher program (often called Section 8). With each of these particular kinds of housing assistance, need typically exceeds available resources, and competition for benefits can be fierce. Consequently, the average HUD resident spends two years on a waitlist before being accepted into any federal housing program. Families who do receive federal housing assistance would certainly struggle to find affordable alternatives: The annual median income for HUD households is $12,906, roughly a fifth of the national median household earnings. Additionally, residents spend roughly 29 percent of their monthly income on housing, amounting to a median contribution of $315 a month. While HUD currently requires residents to spend 30 percent of their monthly income on rent, elderly and disabled residents are exempt from this rule. Moreover, the ethnic composition of HUD residents reflects broader economic inequalities: Whereas black individuals account for 13 percent of the American public, they represent 44 percent of those receiving federal housing assistance. This finding corresponds roughly to the demographics of economically disadvantaged citizens: The black poverty rate is more than twice the white poverty rate, a disparity that has existed for decades.
HUD history: population and policies
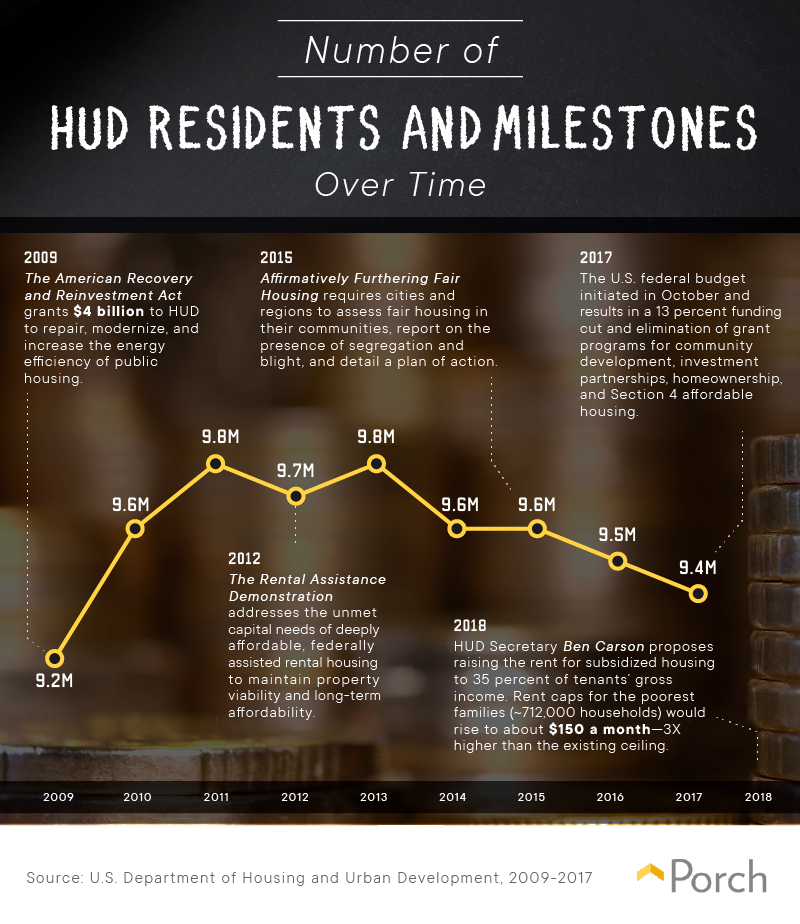 The number of Americans receiving some form of HUD assistance has fluctuated somewhat in recent years, sometimes in response to policy changes at the national level. Following 2009’s American Recovery and Reinvestment Act, a massive stimulus package designed to reverse the effects of the Great Recession, major renovations of public housing stock began—and HUD resident totals climbed steadily. HUD’s Rental Assistance Demonstration program then debuted in 2012, facilitating the transfer of some public housing units to the private sector. This initiative, which Secretary Carson has endorsed enthusiastically, converts public housing facilities to privately run Section 8 units, with the expectation that the new owners would fund repairs. Between 2013 and 2017, the number of residents in federally subsidized housing declined significantly. This trend could reflect improvements in the national economy over this period: The country gained more than 2 million jobs every year from 2011 through 2017, ostensibly enabling many families to leave public housing entirely. Indeed, when Carson proposed rent increases for HUD residents in 2017, he argued that the move would encourage families to increase their incomes, leading to self-sufficiency. Opponents, however, warned that the policy would thrust residents out of public housing because they cannot afford it—potentially creating a crisis in homelessness.
Cost contributions: government vs. residents
 Although recipients of federal housing subsidies typically contribute 30 percent of their incomes each month for rent and utilities, there are exceptions: Certain deductions are permitted, and some families pay a flat rate instead. Accordingly, the average resident’s monthly contribution amounted to a slightly smaller slice of earnings, ranging from 27.9 percent of their monthly income in 2009 to 29.3 percent in 2017. While resident and government contributions have both increased incrementally in recent years, inflation accounts for much of that trend. Unfortunately, HUD residents’ incomes have not kept pace – only 1/5th of the national median household income. According to federal data, their buying power has actually declined since 2009. Of course, HUD residents’ incomes vary substantially in different parts of the country, reflecting disparities in the costs of living. In the northeast, HUD residents’ incomes tended to be relatively high, likely reflecting the expense of residing in some of the region’s major metropolitan areas. The same held true in California, where housing demand has pushed rents out of reach for many working families. HUD incomes were relatively high in Alaska as well. While some parts of the state offer comparably low costs of living, others can be quite expensive because of limited housing stock and big utility bills.
Availability around the country
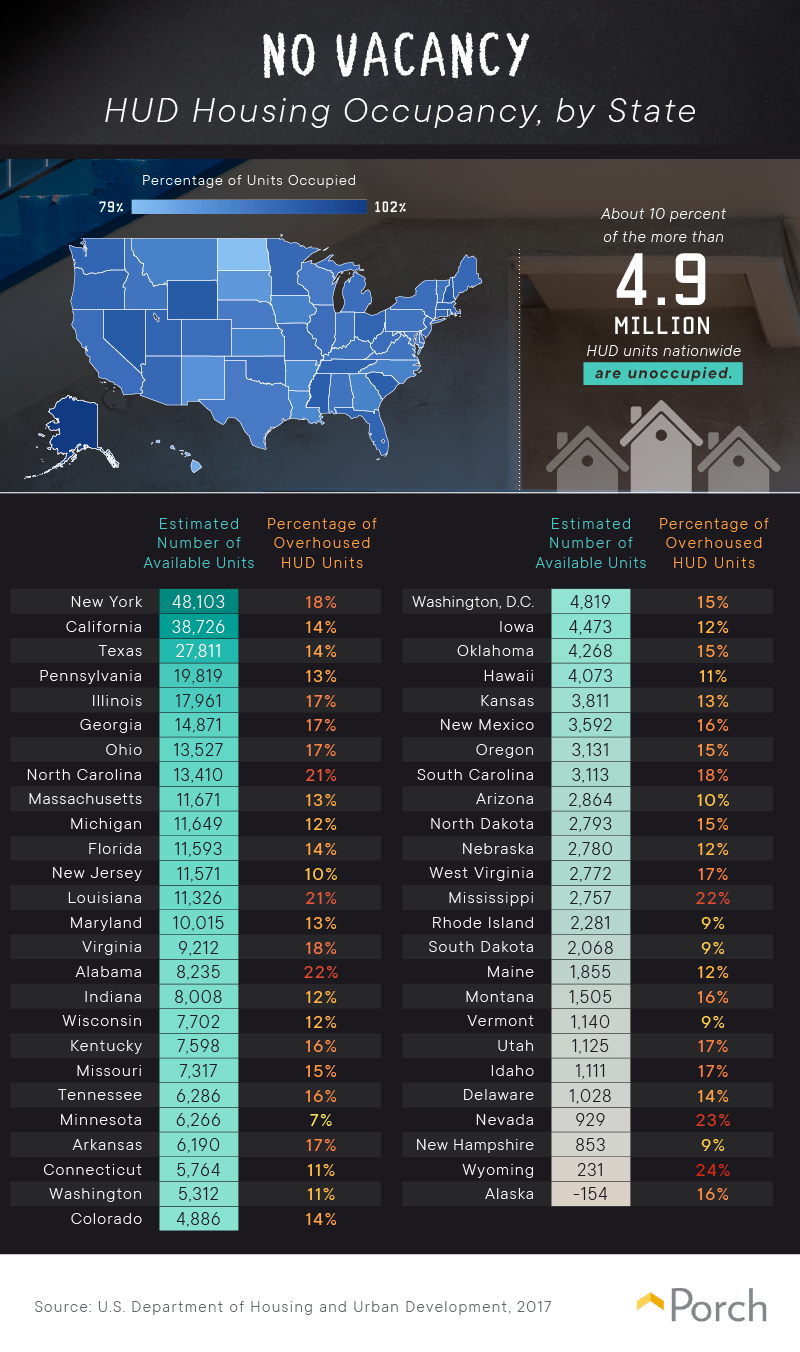 Affordable housing is in critically short supply nationwide. Currently, 11 million families spend more than half their monthly incomes on rent. Accordingly, it should come as no surprise that most public housing units are occupied in each state, and open spots are especially scarce in some places. In Alaska, HUD figures actually suggest that public units are over 100 percent capacity, likely due to the severe overcrowding of homes in some parts of the state. Critics say that public housing shortages stem from stingy funding at the federal level: Despite long waiting lists and budgetary shortfalls for necessary repairs, Congress has steadily reduced funding for capital improvements in public housing since 2000. Certainly, some available units exist in each state, but demand vastly exceeds supply even in places with relatively large public housing portfolios. In California, for example, there were nearly 39,000 available units, but researchers estimate there are merely 21 public housing units for every 100 eligible families. Another challenge pertains to “over-housing,” in which a family occupies a public housing unit with more bedrooms than HUD deems necessary to meet their needs. In some states, such as Alabama, more than 1 in 5 occupied units qualified as over-housed, further complicating availability.
Gendered housing hardship?
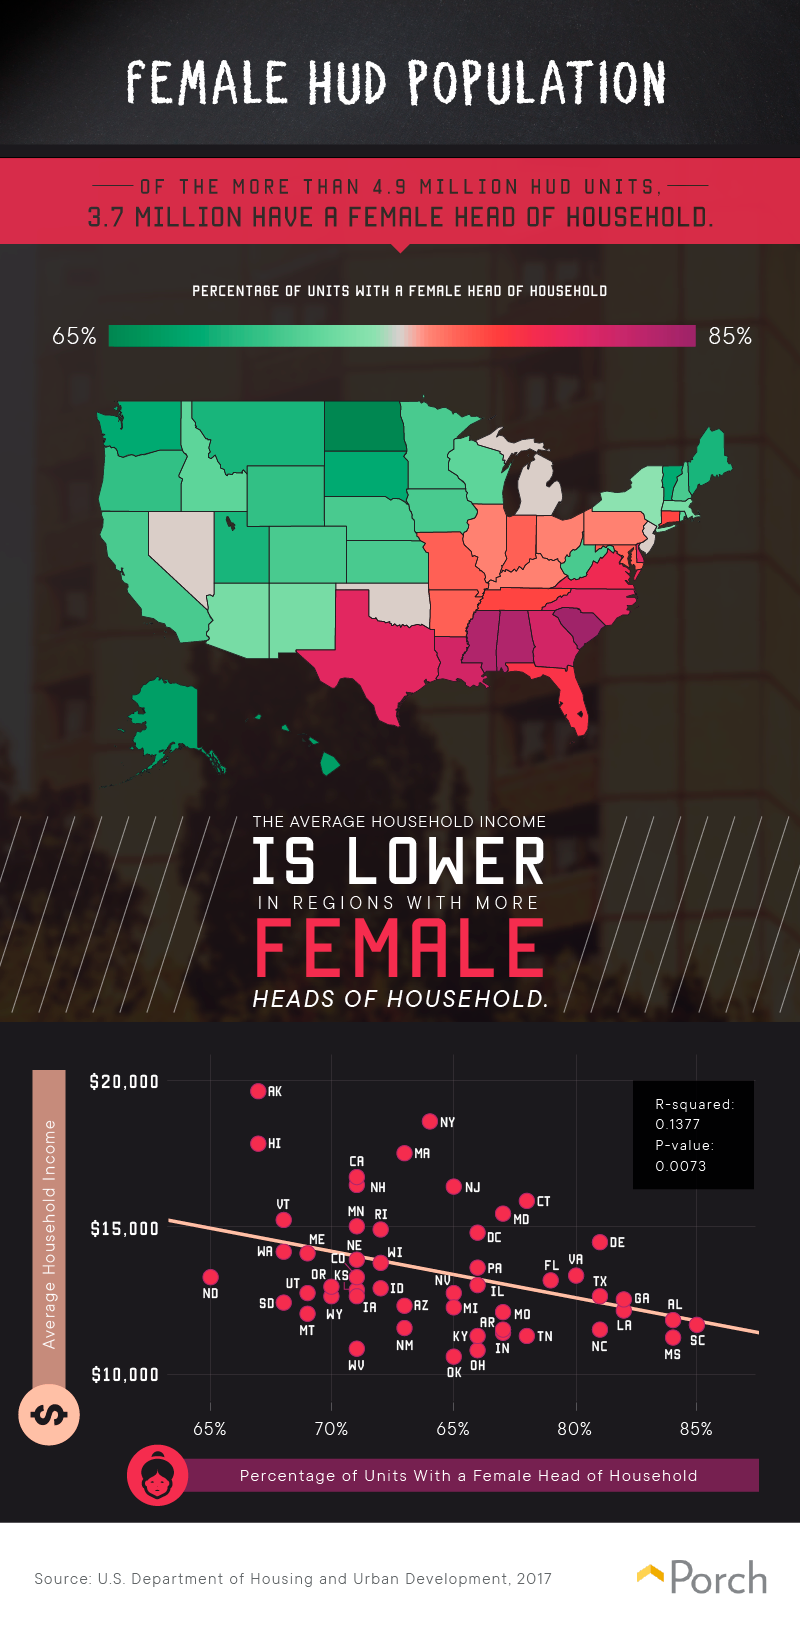 Our findings suggest that women head the vast majority of HUD households: In many states, three-quarters of families receiving federal housing subsidies have a female head of household. This finding reaffirms data about the disproportionate impact of poverty on single women and children. Female Americans have higher poverty rates than their male counterparts, and half of the children in female-headed households fall below federal poverty thresholds. Accordingly, our findings present a strong negative correlation between the percentage of HUD households headed by women and average residents’ incomes in each state. Where women represent a relatively high percentage of HUD residents, occupants of public housing tend to earn less overall. Scholars suggest a number of factors that might contribute to this trend, but the most obvious may be the gender wage gap. Although compensation for men and women has grown closer in recent decades, a sizeable income gulf remains. Another element may relate to mass incarceration. While male parents serve prison sentences, women are left to balance work and child care duties. Subsequently, many formerly incarcerated men are banned from public housing on the basis of their convictions, perpetuating the heavily female composition of residents.
Homeownership: aspiration to attainment
Our findings reveal a large segment of American society is desperately in need of affordable housing options, with a corresponding scarcity of vacancies in many states. Moreover, resident demographics mirror longstanding inequalities: Women and minorities are disproportionately represented among those who rely on HUD for a place live. Our findings may not present any neat resolutions, however. At the national level, the debate rages on about which policies will help low-income families escape poverty. But we do hope our data encourage empathy for those who depend on federal housing subsidies. Faced with so great a need, it is incumbent on our country to seek sustainable solutions. Of course, high housing costs affect every sector of the American economy. Even families with substantial incomes must carefully consider their options before buying or renovating a home of their own. Without expert guidance, home improvement can quickly turn from an excellent investment to a financial disaster. At Porch, we strive to provide homeowners with the information and recommendations they need to tackle any home improvement project. From comprehensive cost guides to local pro referrals, we offer everything you need to make your dream renovation a reality including a guarantee.
Methodology and limitations
For this project, we used the “Summary of All HUD Programs” data from the U.S. Department of Housing and Urban Development from 2009 to 2017. We only analyzed data from the 50 states, excluding U.S. territories such as Guam, Puerto Rico, the U.S. Virgin Islands, Northern Mariana Islands, and other territories within the data set. We examined the details from 4,901,738 HUD units in the U.S. and 9,394,593 people who live in those units. These data come from a government program, and therefore, it is possible that researcher bias may have affected data collection or presentation. For more information regarding the data, please visit the U.S. Department of Housing and Urban Development.
Sources
- https://www.thedailybeast.com/fdr-signs-affordable-housing-into-law
- https://www.npr.org/2018/04/25/605900171/hud-unveils-plan-to-increase-rent-on-millions-receiving-federal-housing-assistan
- https://www.politico.com/story/2018/06/08/ben-carson-triple-rents-for-poorest-households-634986
- https://www.huffingtonpost.com/entry/housing-crisis-inequality-harvard-report_us_5b27c1f1e4b056b2263c621e
- https://www.census.gov/quickfacts/fact/table/US/PST045217
- https://www.hud.gov/topics/rental_assistance
- https://www.marketplace.org/2018/01/03/wealth-poverty/its-long-wait-section-8-housing-us-cities
- https://www.citylab.com/equity/2018/04/hud-ben-carson-work-requirements-rent-hikes/558920/
- https://www.census.gov/quickfacts/fact/table/US/PST045217
- https://www.epi.org/publication/poverty-persists-50-years-after-the-poor-peoples-campaign-black-poverty-rates-are-more-than-twice-as-high-as-white-poverty-rates/
- https://www.brookings.edu/blog/the-avenue/2017/02/22/eight-years-later-what-the-recovery-act-taught-us/
- https://www.citylab.com/equity/2017/04/the-hopes-and-fears-around-ben-carsons-favorite-public-housing-program/523926/
- https://www.forbes.com/sites/chuckjones/2018/01/06/president-trumps-first-year-of-job-growth-was-below-president-obamas-last-six-years/#4b38130025ab
- https://www.politico.com/story/2018/04/25/carson-proposes-that-poor-should-pay-more-rent-504401
- https://www.cbpp.org/research/housing/policy-basics-federal-rental-assistance
- https://data.bls.gov/cgi-bin/cpicalc.pl?cost1=265&year1=200901&year2=201701
- http://www.latimes.com/business/hiltzik/la-fi-hiltzik-housing-crisis-20180330-story.html
- https://www.investopedia.com/articles/personal-finance/091415/how-much-money-do-you-need-live-alaska.asp
- https://www.npr.org/2018/01/09/576535681/advocates-fear-tax-bill-will-worsen-u-s-affordable-housing-shortage
- https://www.adn.com/alaska-news/rural-alaska/2018/02/11/arctic-rife-with-housing-problems-according-to-new-report/
- https://money.cnn.com/2017/01/14/news/economy/public-housing-ben-carson/index.html
- https://www.citylab.com/equity/2017/03/americas-affordable-housing-shortage-mapped/518391/
- https://www.hud.gov/sites/documents/16-02PIHN.pdf
- https://www.usnews.com/news/healthiest-communities/articles/2018-09-12/poverty-in-america-new-census-data-paint-an-unpleasant-picture
- https://mic.com/articles/184396/the-us-gender-wage-gap-is-narrowing-but-women-still-face-higher-poverty-rates#.LKBdpyqlm
- https://www.urban.org/urban-wire/three-ways-mass-incarceration-affects-women-color
- https://www.icrw.org/publications/regender-gender-stat-affordable-housing/
Fair Use Statement
There’s no rental fee for this content: Use it or share it however you’d like, so long as you do so for noncommercial purposes. Just do us one favor: Link back to this page so that others can explore our work in full.