The booming real estate market has been one of the most noteworthy stories of the pandemic-era economy. Demand for residential real estate increased early on in the pandemic at a time when living and working space took on greater importance. Government stimulus in response to COVID-19’s economic effects, low mortgage interest rates, and high savings rates and investment returns have given more households the financial means to enter the real estate market. And yet, the supply of homes has been historically low for much of this same period, only recently returning to pre-pandemic levels. Many current owners have been hesitant to sell and shop for new homes in such a competitive market. Meanwhile, homebuilding has been challenged by supply and building material shortages that have made it hard to keep up with demand.
The forces of high demand and limited supply have produced dramatic price increases in the housing market since the start of the pandemic. While prices had been climbing steadily since the end of the last recession, the rate of growth has been much higher since the beginning of 2020. Home prices have risen by more than 20% over that period, with the typical home price in the U.S. crossing over $300,000 for the first time in history, according to data from Zillow.

The pandemic has also led people to reconsider where they live and work, which will have its own effects on housing markets in the U.S. Many employers are now permanently offering telework, hybrid schedules, or other flexible arrangements that offer employees more choice of where to live. Meanwhile, Millennials—now the largest living generation—are becoming a major force in the real estate market, with many looking for affordable places to settle their growing families.
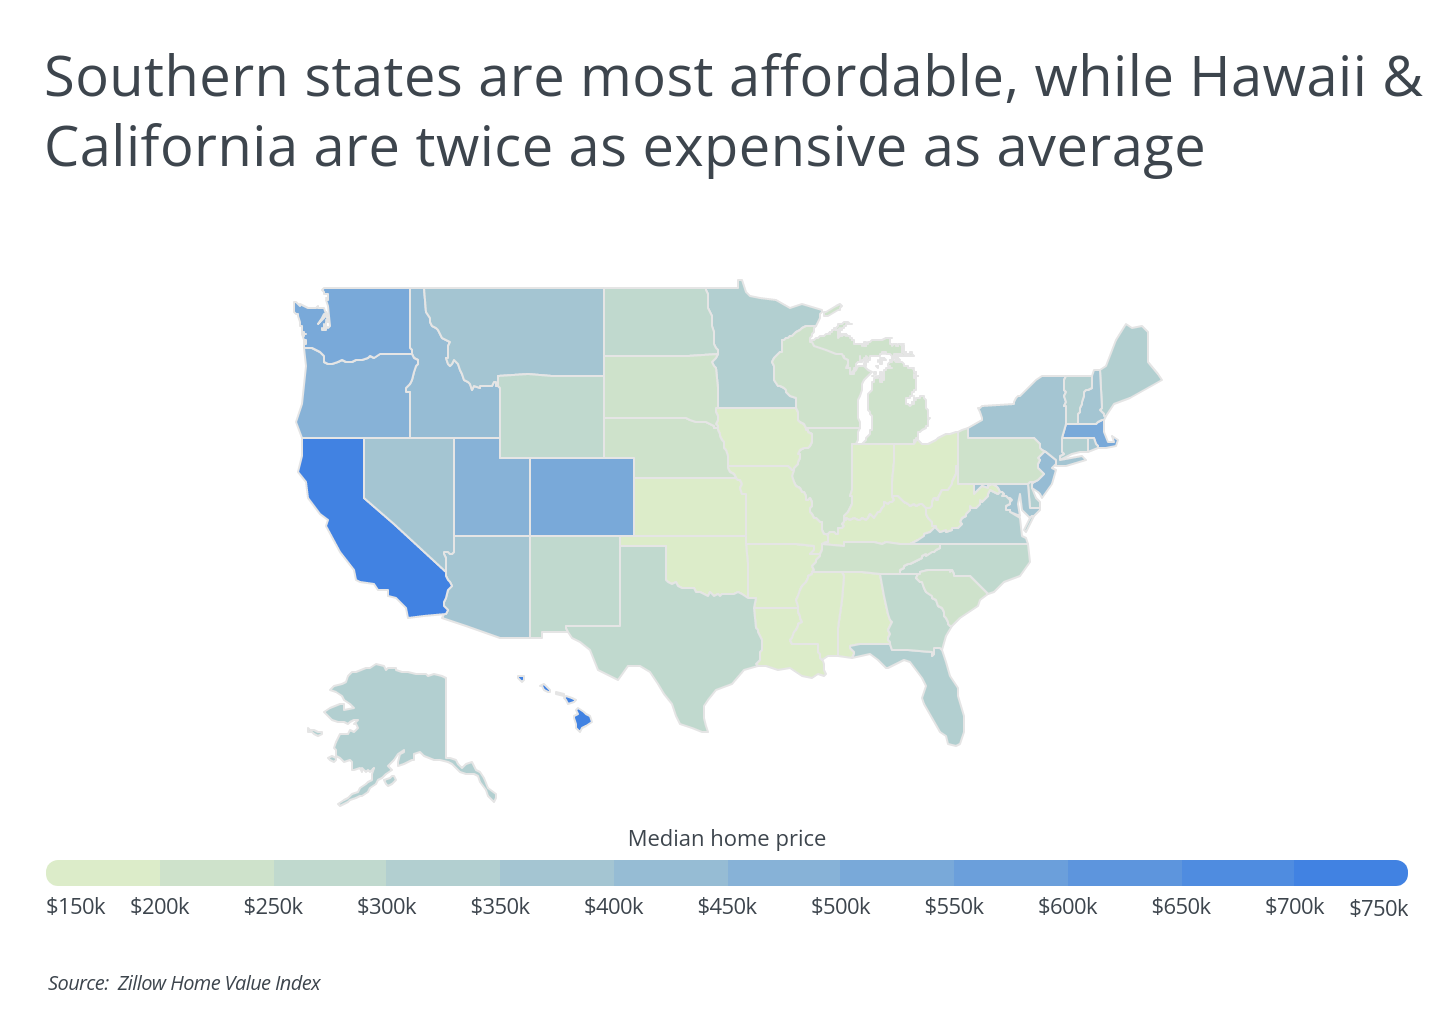
With these factors at play, some states may prove less desirable given their significantly higher price points. The geographic disparities between home prices in the U.S. can be enormous, with some states costing more than double the national level. For example, the median home price in Hawaii—the most expensive state—is $764,146, which is more than twice the national median and over six times more expensive than the median home in West Virginia, which sells for $118,581.
TRENDING
Is it time for a new perimeter fence around your home? Each type of material used for fencing will cost a different amount per square foot. Give our fence cost calculator a try for a quick estimate.
In general, states on the coasts like California, Massachusetts, and Washington are also among the most expensive locales, while homebuyers who prioritize affordability should look to the South and Midwest. Home prices are lower in these regions for a variety of reasons, including local laws and ordinances that affect how easy it is to build homes, as in places like Texas, and stagnant or declining populations that reduce demand for housing, as in Rust Belt locations like Ohio and Michigan.
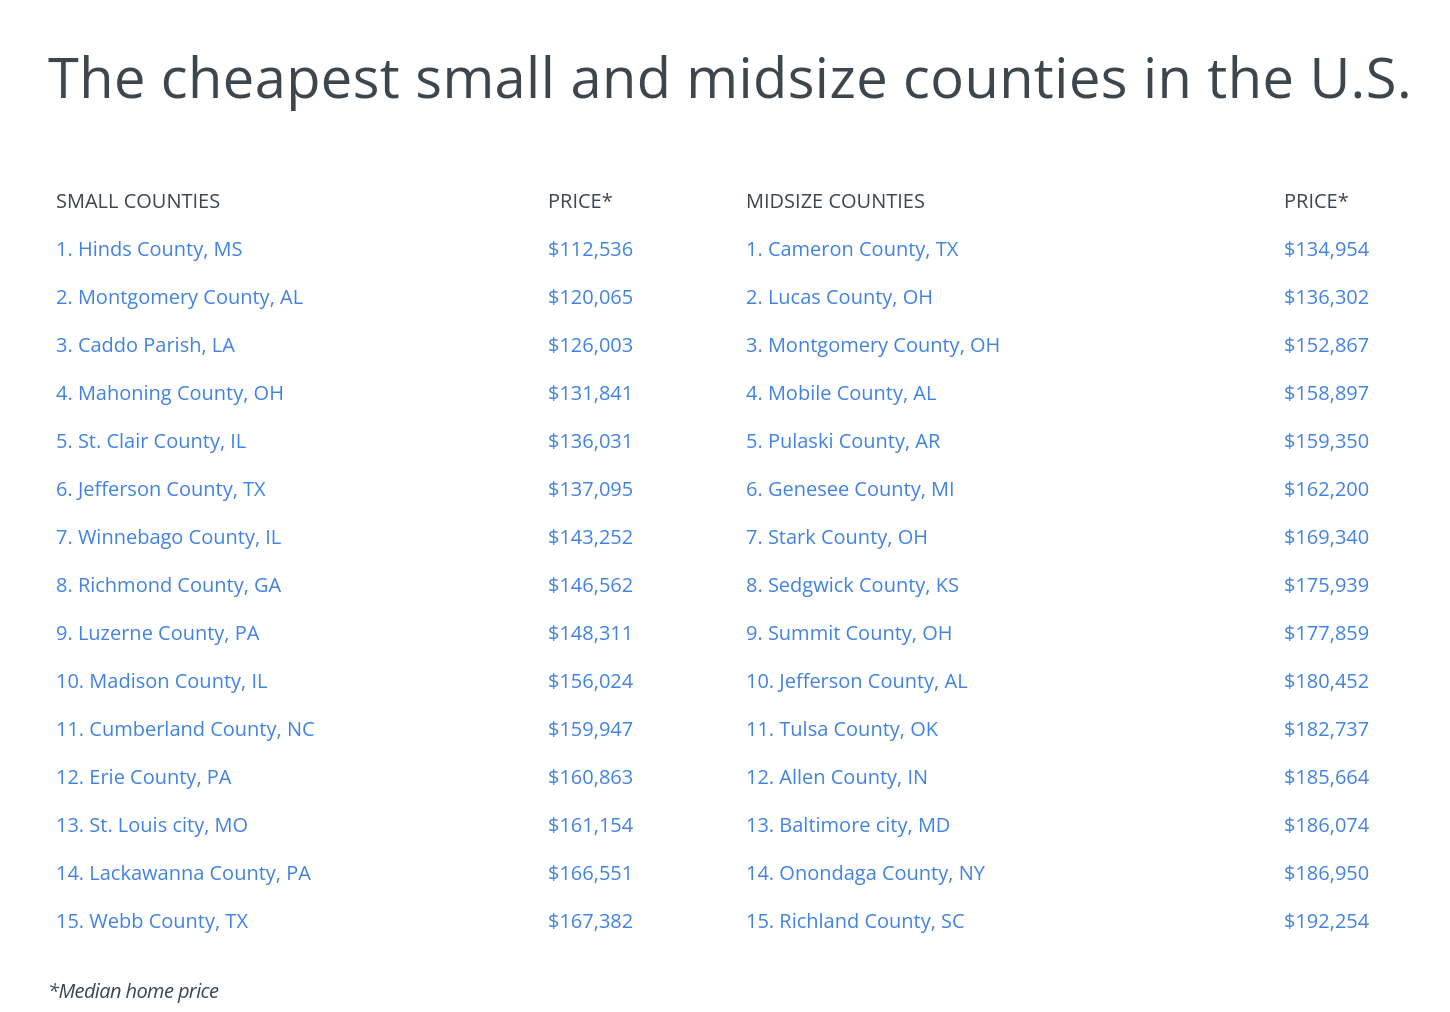
To identify the cheapest locations in the U.S., researchers at Porch analyzed county-level home price data from Zillow. The researcher also calculated changes in home price, and included median household income data from the Census Bureau. To improve relevance, only counties with at least 200,000 residents were included. Additionally, counties were grouped into cohorts based on population size: small (200,000–349,999), midsize (350,000–749,999), and large (750,000 or more).
Here are the least expensive counties in the U.S.
The Cheapest Large Counties in the U.S.

Photo Credit: f11photo / Shutterstock
15. Bexar County, TX
- Median home price: $239,387
- 1-year change in home price: 18.9%
- 5-year change in home price: 43.8%
- Median household income: $58,964

Photo Credit: Felix Lipov / Shutterstock
14. Erie County, NY
- Median home price: $235,120
- 1-year change in home price: 24.1%
- 5-year change in home price: 56.2%
- Median household income: $60,652
RELATED
How much does it cost to install kitchen cabinets? Your actual price will depend on your location, job size, conditions and finish options you choose.

Photo Credit: Jerry Kozlowski / Shutterstock
13. Macomb County, MI
- Median home price: $230,614
- 1-year change in home price: 18.8%
- 5-year change in home price: 50.2%
- Median household income: $64,947

Photo Credit: Gang Liu / Shutterstock
12. Philadelphia County, PA
- Median home price: $225,317
- 1-year change in home price: 13.7%
- 5-year change in home price: 57.1%
- Median household income: $47,474

Photo Credit: aceshot1 / Shutterstock
11. Hamilton County, OH
- Median home price: $215,550
- 1-year change in home price: 18.6%
- 5-year change in home price: 57.0%
- Median household income: $60,198

Photo Credit: Sean Pavone / Shutterstock
10. Allegheny County, PA
- Median home price: $214,885
- 1-year change in home price: 20.1%
- 5-year change in home price: 46.5%
- Median household income: $64,871

Photo Credit: Sean Pavone / Shutterstock
9. Jefferson County, KY
- Median home price: $213,807
- 1-year change in home price: 13.0%
- 5-year change in home price: 40.2%
- Median household income: $59,049

Photo Credit: f11photo / Shutterstock
8. Milwaukee County, WI
- Median home price: $194,600
- 1-year change in home price: 20.1%
- 5-year change in home price: 54.6%
- Median household income: $53,418

Photo Credit: Sean Pavone / Shutterstock
7. Marion County, IN
- Median home price: $192,836
- 1-year change in home price: 17.6%
- 5-year change in home price: 61.3%
- Median household income: $50,458

Photo Credit: Sean Pavone / Shutterstock
6. Shelby County, TN
- Median home price: $190,127
- 1-year change in home price: 18.7%
- 5-year change in home price: 65.2%
- Median household income: $52,614

Photo Credit: Sean Pavone / Shutterstock
5. Cuyahoga County, OH
- Median home price: $180,455
- 1-year change in home price: 20.7%
- 5-year change in home price: 57.5%
- Median household income: $52,423

Photo Credit: Sean Pavone / Shutterstock
4. Oklahoma County, OK
- Median home price: $179,654
- 1-year change in home price: 14.4%
- 5-year change in home price: 33.7%
- Median household income: $56,235

Photo Credit: Sean Pavone / Shutterstock
3. El Paso County, TX
- Median home price: $168,218
- 1-year change in home price: 19.2%
- 5-year change in home price: 36.8%
- Median household income: $48,903
TRENDING
Tile brings beauty and durability to your home, and it comes in an endless array of materials, colors, and shapes. Use our comprehensive guide to help you determine how much it will cost to install tile in your home.

Photo Credit: f11photo / Shutterstock
2. Wayne County, MI
- Median home price: $145,614
- 1-year change in home price: 21.0%
- 5-year change in home price: 72.9%
- Median household income: $50,753

Photo Credit: Alamy Stock Photo
1. Hidalgo County, TX
- Median home price: $142,667
- 1-year change in home price: 13.0%
- 5-year change in home price: 38.9%
- Median household income: $41,800
Methodology & Detailed Findings
Data on median home values are from Zillow’s Zillow Home Value Index while data on median household income are from the U.S. Census Bureau American Community Survey. To identify the cheapest locations in the U.S., researchers looked at those places with the lowest price for a typical house. To improve relevance, only locations with at least 200,000 residents were included. Additionally, locations were grouped into cohorts based on population size: small (200,000–349,999), midsize (350,000–749,999), and large (750,000 or more).


