
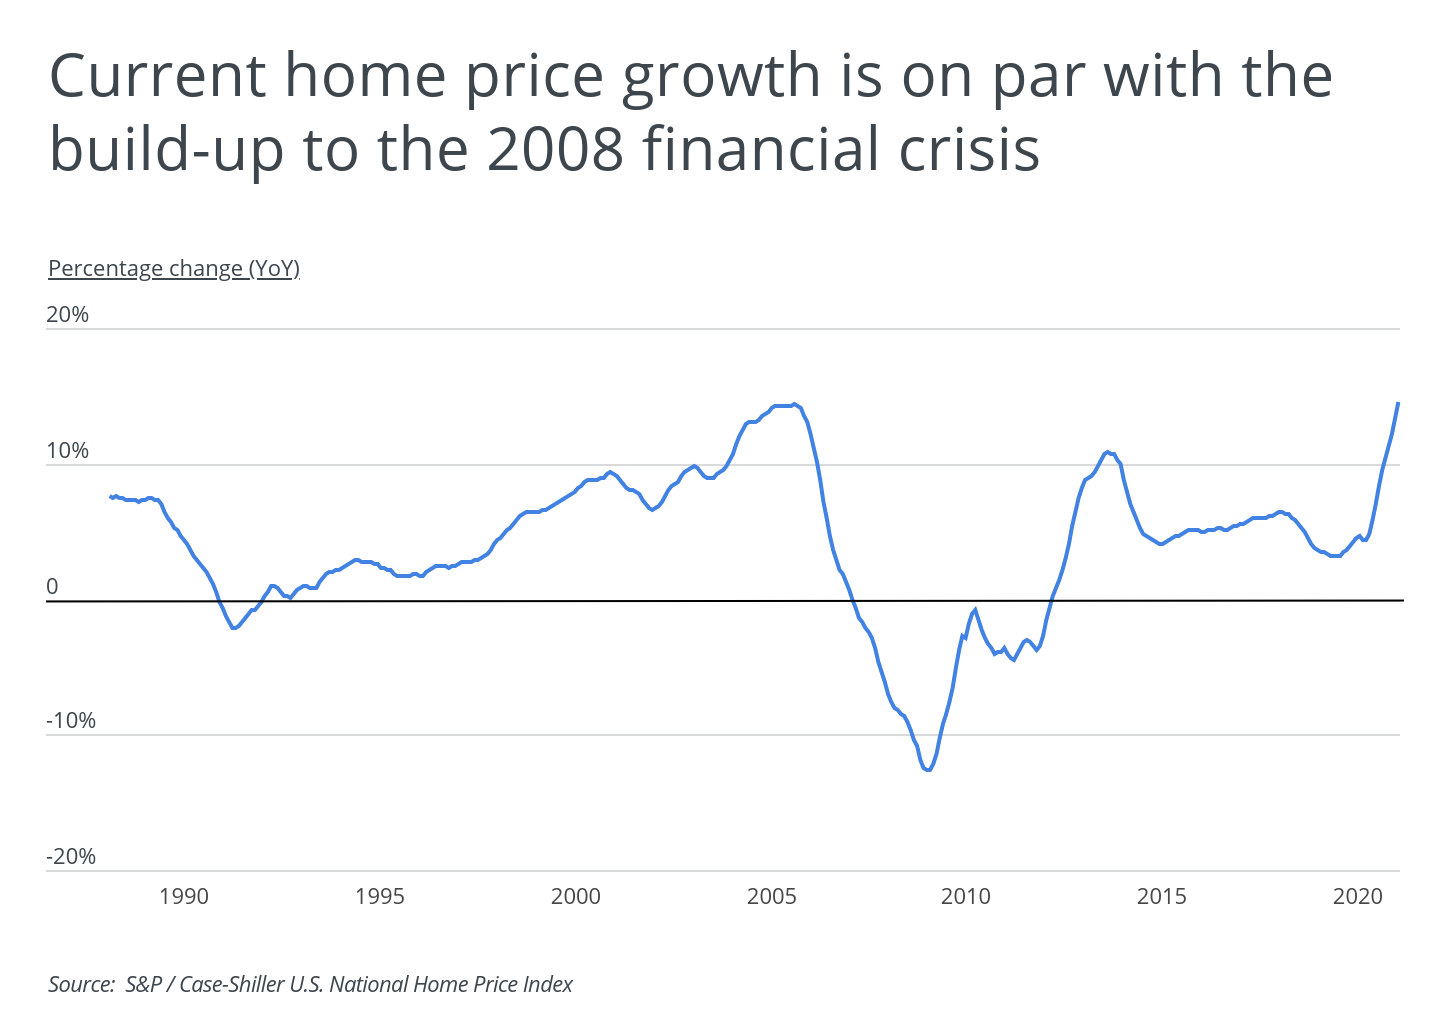
The U.S. real estate market is reaching unprecedented heights. Over the past 18 months, home prices across the nation have shot up to levels unseen since the build-up to the 2008 financial crisis. In April 2021, the year-over-year growth of the Case-Shiller Index, the premier metric for housing prices, eclipsed 14.5% for the first time in its history.
Amid such sharp rises in price, housing markets across the country were ablaze this past year. Redfin data revealed the percentage of homes selling above asking priceshot up 13 percentage points compared to pre-pandemic levels. Also, post-pandemic buyers are more determined to get what they need, especially if they are looking into a remote work type of life. More than 60% of buyers were putting offers on houses sight unseen and the number of homes being bought without an inspection nearly doubled compared to the previous year. The message was clear: Buyers knew the real estate market was hot, and they did everything they could to get homes under contract and close the sale.
For those who were shut out of the real estate market because they were outbid or outpriced, things will not likely get better in the next year, according to Zillow. National projections indicate a decisive upward trend in the Zillow Home Value Index, with some metropolitan areas projecting increases that are more than double the national average.
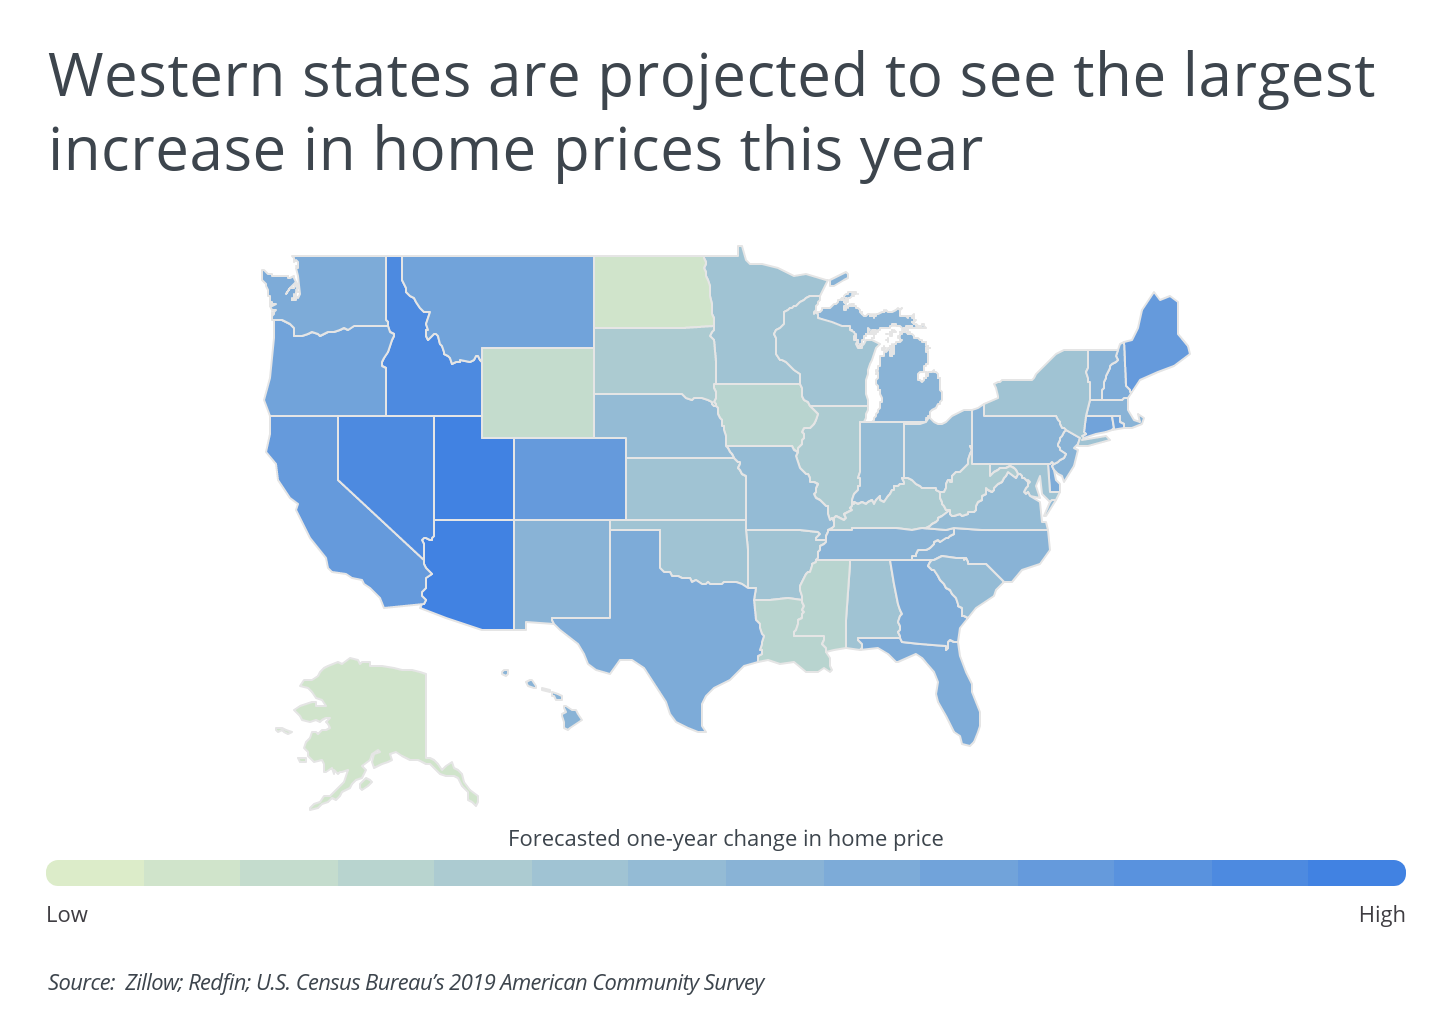
At the state level, Zillow projections show that Western states will lead the increase in home prices. While it’s no surprise that California—a desirable destination—is among the top five states for the biggest projected home-price increases, it’s real estate markets in lesser-heralded Western states that occupy the top four spots: Utah, Arizona, Idaho and Nevada.
The growth of the real estate market can be attributed to various factors:
- Local market conditions
- Socio-economic factors
- Government policies
- Interest rates
- Local living conditions
In California, the increasing population has led to a higher demand for housing. This is not only true for California; the trend has been observed in densely populated urban areas and developing regions across the USA and the world. As more people seek homeownership, the demand for housing has surged worldwide. Developers and investors have capitalized on the opportunity by supporting construction projects in urban and suburban areas. The increase of new built houses and the growth of the real estate market has transformed the landscape of many regions and contributed to the overall development and prosperity of the housing sector.
RELATED
How much does it cost to install carpet? How about an AC unit installation? Get all your home improvement questions answered with Porch.
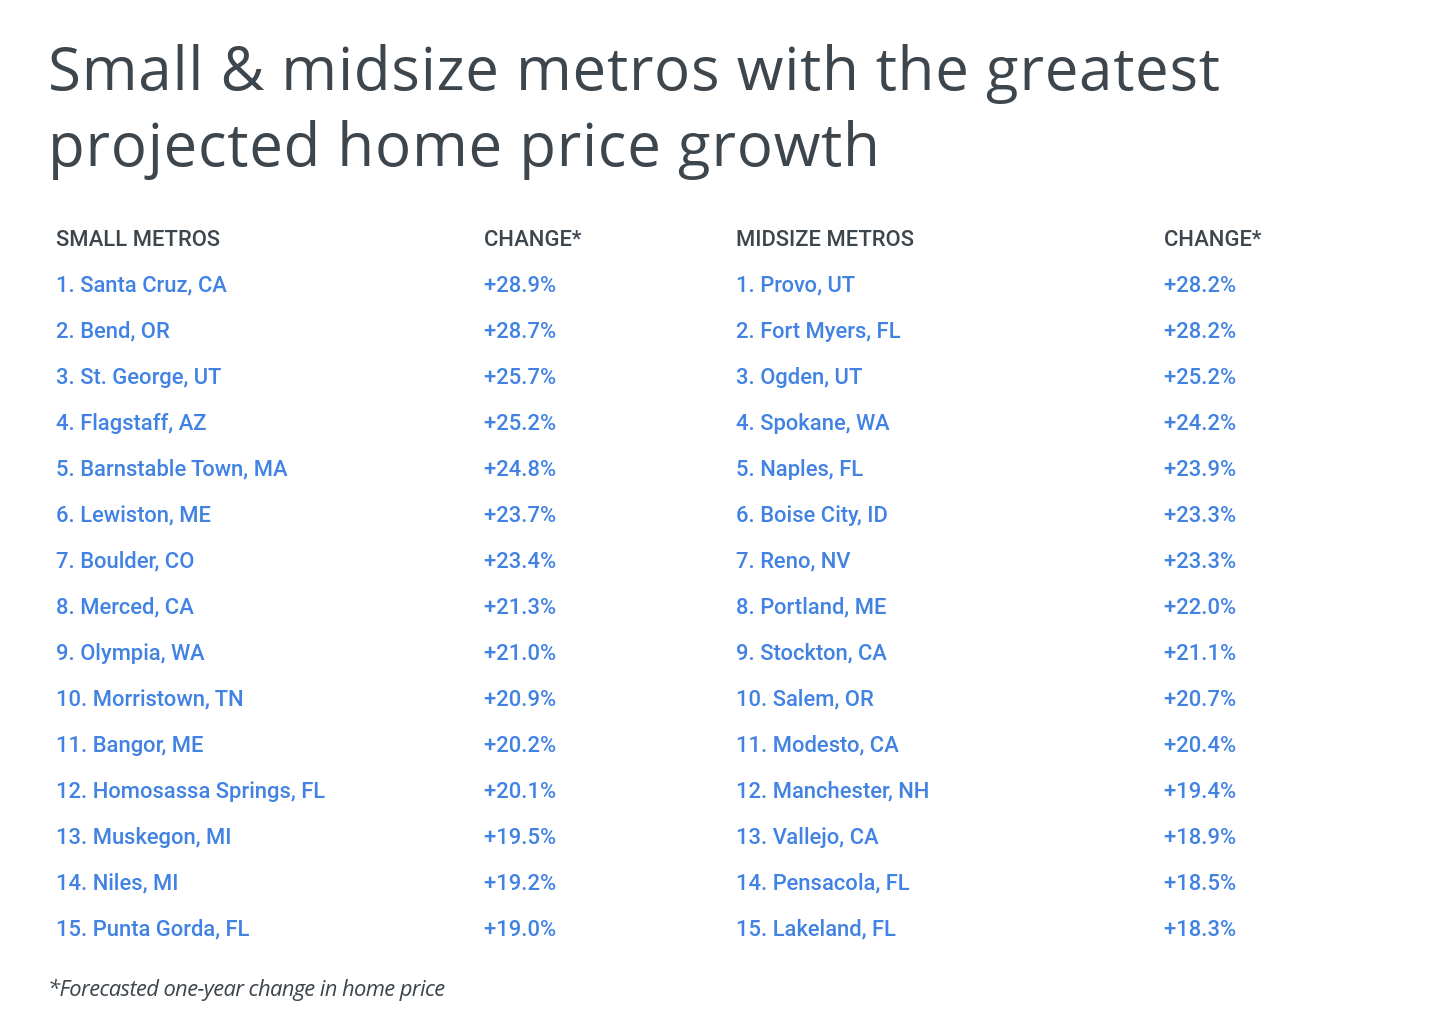
To determine the real estate markets expected to grow the most in the next year, researchers at Porch analyzed data from Zillow, Redfin, and the Census Bureau. Its researchers calculated the forecasted one-year change in home price, previous one-year change in home price, sale-to-list price ratio, and the home price-to-income ratio. To improve relevance, only metropolitan areas with at least 100,000 residents were included. Additionally, metros were grouped into cohorts based on population size: small (100,000–349,999), midsize (350,000–999,999), and large (1,000,000 or more).
Here are the real estate markets projected to grow the most over the next year.
Large Metros With the Greatest Projected Home Price Growth

Photo Credit: Sean Pavone / Shutterstock
15. Tucson, AZ
- Forecasted one-year change in home price: +18.6%
- Previous one-year change in home price: +19.0%
- Current median home price: $273,526
- Sale-to-list price ratio: 101%
- Median household income: $56,169
- Home price-to-income ratio: 4.87X

Photo Credit: Andriy Blokhin / Shutterstock
14. Sacramento, CA
- Forecasted one-year change in home price: +18.7%
- Previous one-year change in home price: +17.1%
- Current median home price: $516,489
- Sale-to-list price ratio: 104%
- Median household income: $76,706
- Home price-to-income ratio: 6.73X
TRENDING
Are your kitchen cabinets looking a little worn out? It might be a good time for an upgrade. Take a look at what it would cost to install kitchen cabinets in your home.

Photo Credit: Bonnie Fink / Shutterstock
13. Tampa, FL
- Forecasted one-year change in home price: +18.8%
- Previous one-year change in home price: +17.7%
- Current median home price: $276,685
- Sale-to-list price ratio: 100%
- Median household income: $57,906
- Home price-to-income ratio: 4.78X

Photo Credit: ESB Professional / Shutterstock
12. Pittsburgh, PA
- Forecasted one-year change in home price: +19.8%
- Previous one-year change in home price: +15.0%
- Current median home price: $190,588
- Sale-to-list price ratio: 100%
- Median household income: $62,638
- Home price-to-income ratio: 3.04X

Photo Credit: stellamc / Shutterstock
11. Fresno, CA
- Forecasted one-year change in home price: +19.8%
- Previous one-year change in home price: +16.4%
- Current median home price: $321,266
- Sale-to-list price ratio: 100%
- Median household income: $57,518
- Home price-to-income ratio: 5.59X

Photo Credit: Nicholas Courtney / Shutterstock
10. Denver, CO
- Forecasted one-year change in home price: +20.8%
- Previous one-year change in home price: +15.2%
- Current median home price: $529,969
- Sale-to-list price ratio: 104%
- Median household income: $85,641
- Home price-to-income ratio: 6.19X

Photo Credit: Mihai_Andritoiu / Shutterstock
9. Dallas-Fort Worth, TX
- Forecasted one-year change in home price: +21.1%
- Previous one-year change in home price: +14.4%
- Current median home price: $297,044
- Sale-to-list price ratio: 102%
- Median household income: $72,265
- Home price-to-income ratio: 4.11X

Photo Credit: f11photo / Shutterstock
8. San Francisco, CA
- Forecasted one-year change in home price: +21.2%
- Previous one-year change in home price: +11.6%
- Current median home price: $1,255,661
- Sale-to-list price ratio: 107%
- Median household income: $114,696
- Home price-to-income ratio: 10.95X

Photo Credit: Jon Bilous / Shutterstock
7. Riverside, CA
- Forecasted one-year change in home price: +21.8%
- Previous one-year change in home price: +19.0%
- Current median home price: $472,569
- Sale-to-list price ratio: 102%
- Median household income: $70,954
- Home price-to-income ratio: 6.66X
Photo Credit: trekandshoot / Shutterstock
6. Las Vegas, NV
- Forecasted one-year change in home price: +23.3%
- Previous one-year change in home price: +12.7%
- Current median home price: $339,768
- Sale-to-list price ratio: 100%
- Median household income: $62,107
- Home price-to-income ratio: 5.47X

Photo Credit: Maciej Bledowski / Shutterstock
5. Salt Lake City, UT
- Forecasted one-year change in home price: +23.5%
- Previous one-year change in home price: +20.6%
- Current median home price: $486,928
- Sale-to-list price ratio: 104%
- Median household income: $80,196
- Home price-to-income ratio: 6.07X
Photo Credit: Uladzik Kryhin / Shutterstock
4. San Jose, CA
- Forecasted one-year change in home price: +24.5%
- Previous one-year change in home price: +11.4%
- Current median home price: $1,384,778
- Sale-to-list price ratio: 107%
- Median household income: $130,865
- Home price-to-income ratio: 10.58X

Photo Credit: Dancestrokes / Shutterstock
3. San Diego, CA
- Forecasted one-year change in home price: +24.7%
- Previous one-year change in home price: +19.6%
- Current median home price: $754,557
- Sale-to-list price ratio: 103%
- Median household income: $83,985
- Home price-to-income ratio: 8.98X
RELATED
Looking for detailed cost estimates and FAQs regarding new baseboards for your home? Try Porch’s comprehensive baseboard installation guide.

Photo Credit: Gregory E. Clifford / Shutterstock
2. Phoenix, AZ
- Forecasted one-year change in home price: +26.2%
- Previous one-year change in home price: +23.5%
- Current median home price: $367,484
- Sale-to-list price ratio: 102%
- Median household income: $67,896
- Home price-to-income ratio: 5.41X

Photo Credit: Roschetzky Photography / Shutterstock
1. Austin, TX
- Forecasted one-year change in home price: +37.1%
- Previous one-year change in home price: +30.5%
- Current median home price: $458,885
- Sale-to-list price ratio: 109%
- Median household income: $80,954
- Home price-to-income ratio: 5.67X
Detailed Findings & Methodology
At the metro level, there is a positive correlation between the forecasted one-year change in home price and the ratio of home price to household income. This means that in already unaffordable real estate markets with high home prices relative to income, prices are projected to continue rising more quickly than average. Standout examples of this trend include Santa Cruz, San Jose, and San Diego in California and Flagstaff, AZ.
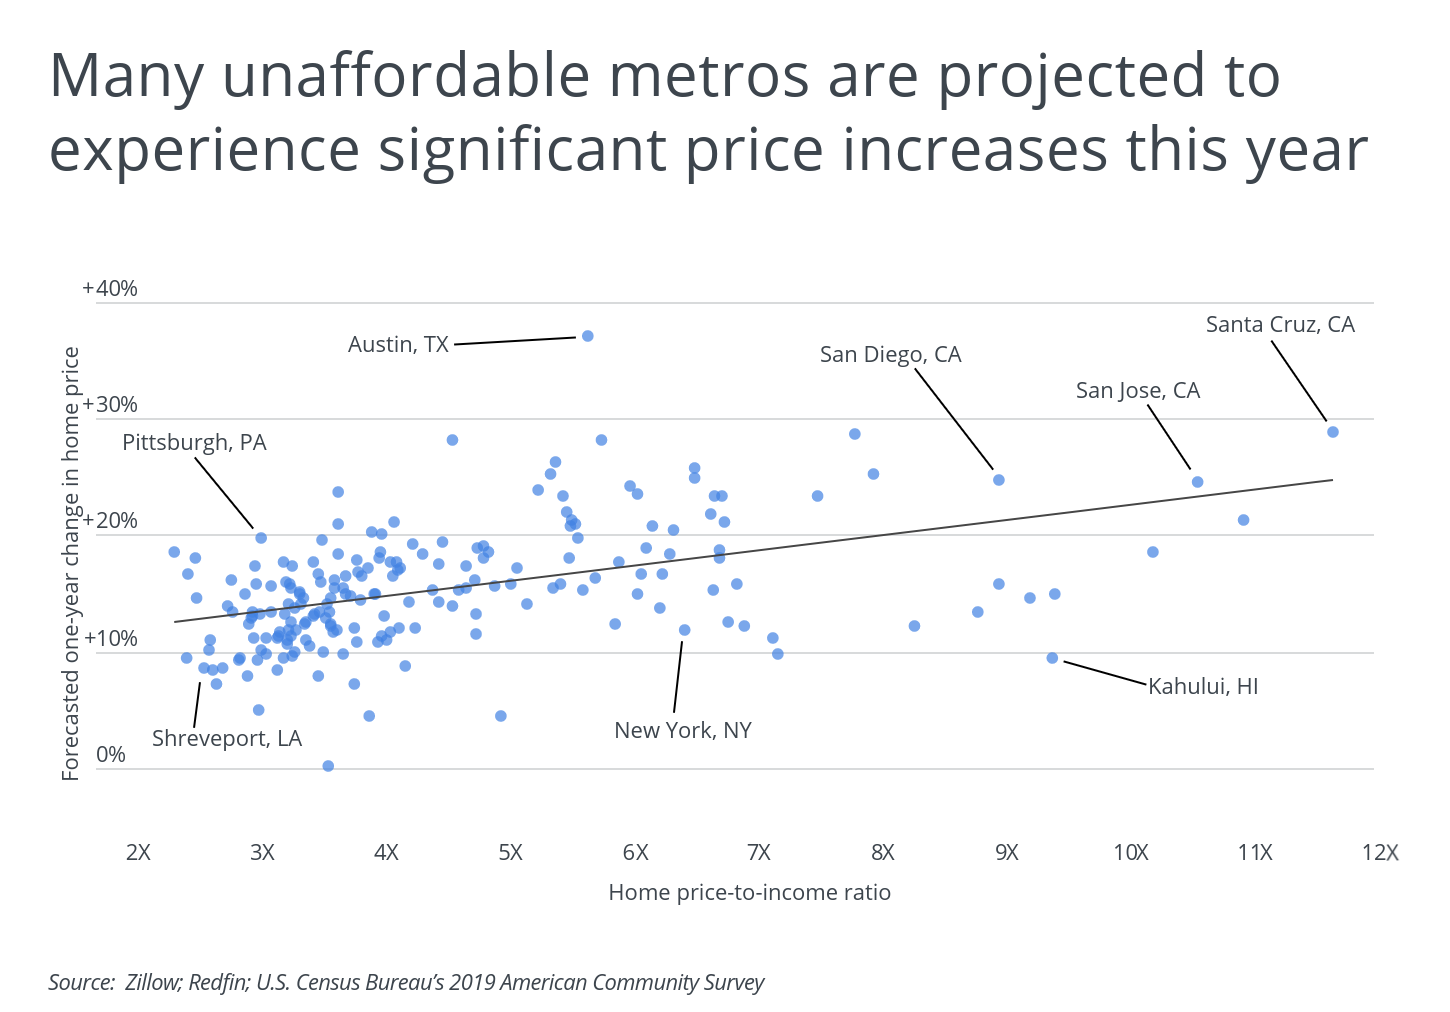
The data used in this analysis is from Zillow, Redfin, and the U.S. Census Bureau’s 2019 American Community Survey. To determine the real estate markets expected to grow the most in the next year, researchers calculated the forecasted one-year change in home price. In the event of a tie, the location with the higher previous one-year change in home price was ranked higher. To improve relevance, only metropolitan areas with at least 100,000 residents were included. Additionally, metros were grouped into cohorts based on population size: small (100,000–349,999), midsize (350,000–999,999), and large (1,000,000 or more).


