The effects of global climate change will be an inescapable fact of life in the decades to come. Environmental factors like air quality and biodiversity will be adversely affected with more carbon emissions in the atmosphere. Migration and population patterns may change as some areas become too hot or too vulnerable to flooding to live in. The economy will likely need to transform practices in agriculture, manufacturing, and energy consumption to mitigate the impacts of a changing climate.
While many of these impacts may not be fully apparent until well into the future, others can already be clearly observed. One example is weather: it’s easy to see that severe weather events are becoming more frequent and more intense over time, and for some regions of the U.S., the risks are high and only likely to increase.
Data from NOAA shows that the number of billion-dollar weather events has been on a steady upward trajectory in recent years. Those that pose the greatest flood risk—tropical cyclones, severe storms, and floods—are all occurring with much greater frequency in the last decade or so compared to prior years, and they are becoming more expensive, too.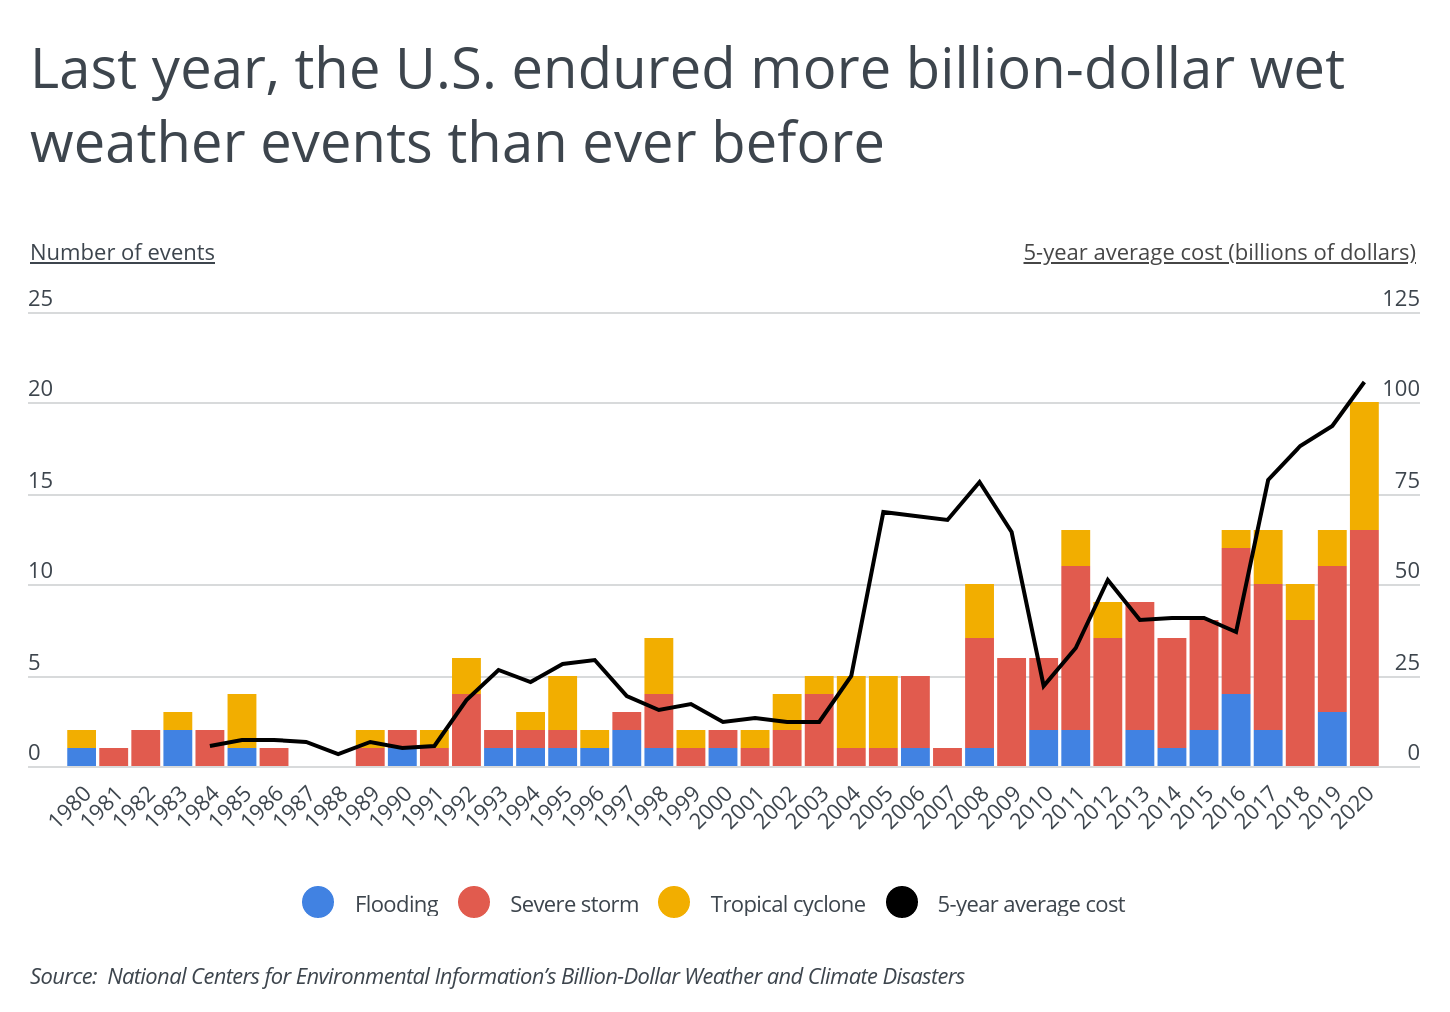
Five-year average costs of these major disasters spiked in 2005 after a then-record-setting Atlantic hurricane season, featuring Hurricane Katrina—at $125 billion in damage, the costliest ever—along with several other major hurricanes including Rita ($18.5 billion) and Wilma ($19 billion). But years like 2005 are becoming more common: 2017 had three of the most expensive hurricanes ever: Harvey, Maria, and Irma; 2018 saw nearly $50 billion in damages combined from Hurricanes Florence and Michael; and 2020 set a record with 30 named tropical cyclones, including seven that topped $1 billion in damages—plus an additional 13 severe storms that year that crossed the billion-dollar threshold.
In any given year, spring and summer tend to see the highest number of wet-weather disaster events. From 1980 to 2021, the most events occurred in April and May, with severe storms and flooding being common as the weather grows warmer and wetter. During the summer and into the fall, the Atlantic hurricane season picks up between June and November and tropical cyclones become the most prominent threat.
RELATED
If you’re looking to replace baseboards in your home because of water damage or simply to upgrade the look of your home, consider reading our comprehensive baseboard installation guide, complete with FAQs and detailed cost estimates.
In addition to being distributed differently by time of year, these types of wet-weather disasters are distributed differently by region. Some states, especially in the Southeast, are most likely to be hit by these sorts of events, with climates that are more susceptible to severe storms, locations that place them in the path of tropical cyclones, and geographic features like coastlines, rivers, or hillsides that make them vulnerable to flooding. According to data from First Street Foundation, Louisiana, Florida, and West Virginia have the highest percentage of housing units currently at risk of flooding, with more than 20% of properties vulnerable in each state. As severe weather events grow more common, those same states are projected to be the most vulnerable moving forward as well.
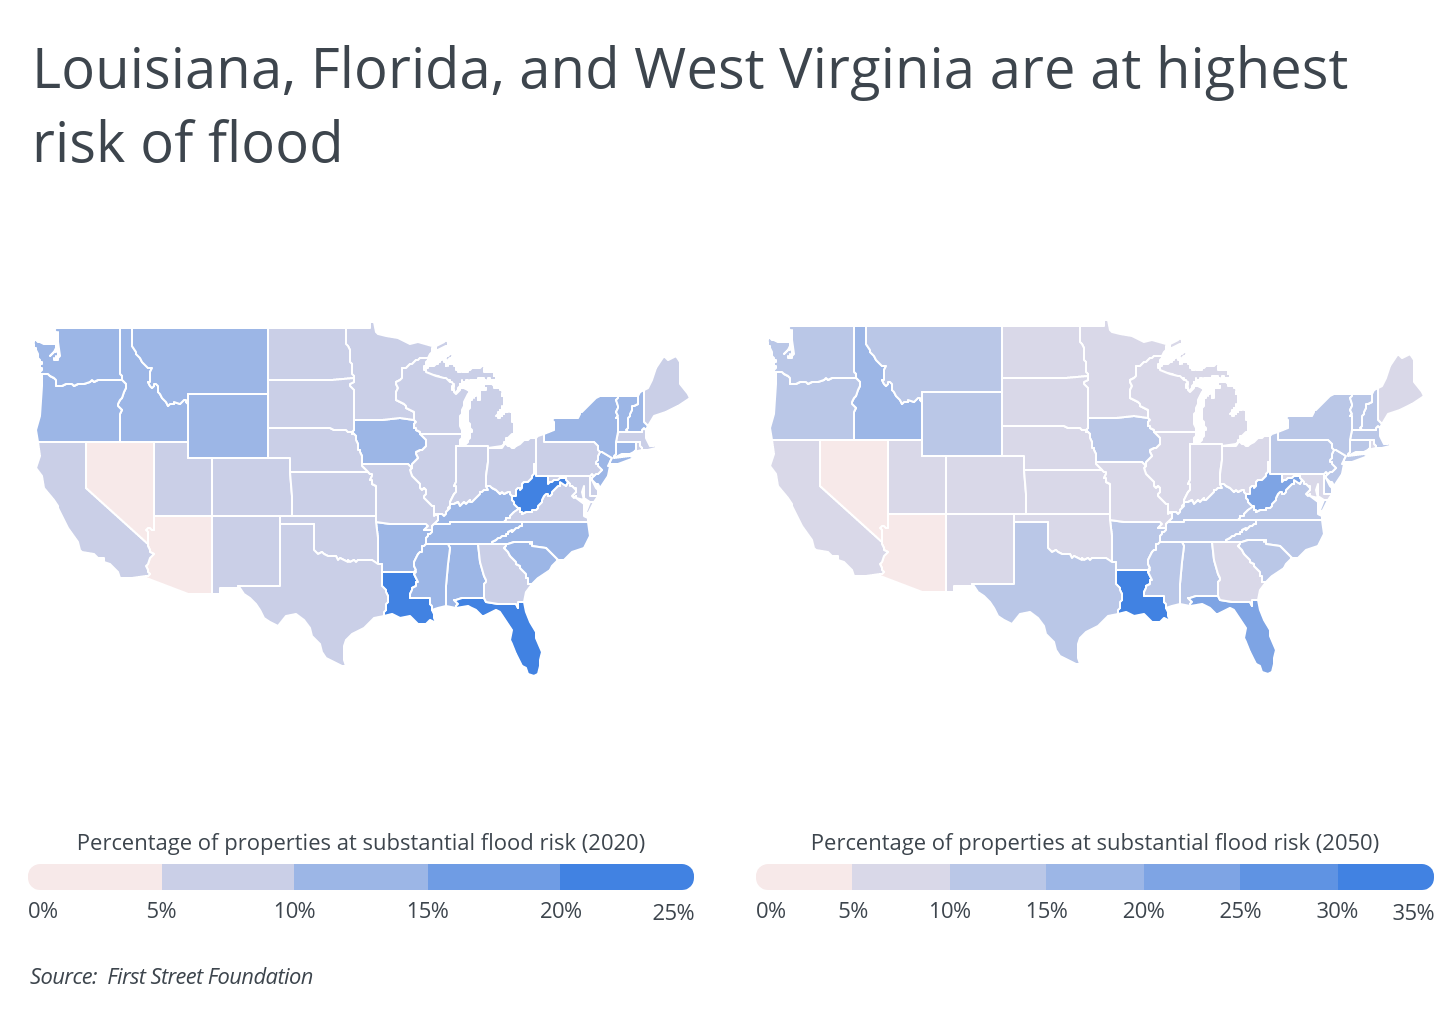
For states like Florida and Louisiana, one of the major risk factors is the high concentration of residents living on the coast, and the same is true of coastal locations in other states. As climate change increases sea level, many counties along the Gulf of Mexico and Atlantic Oceans will feel the effects. Regular tidal flooding will strike lower-lying coastal areas more often, and when tropical storms hit, the damages from storm surge will be even greater.
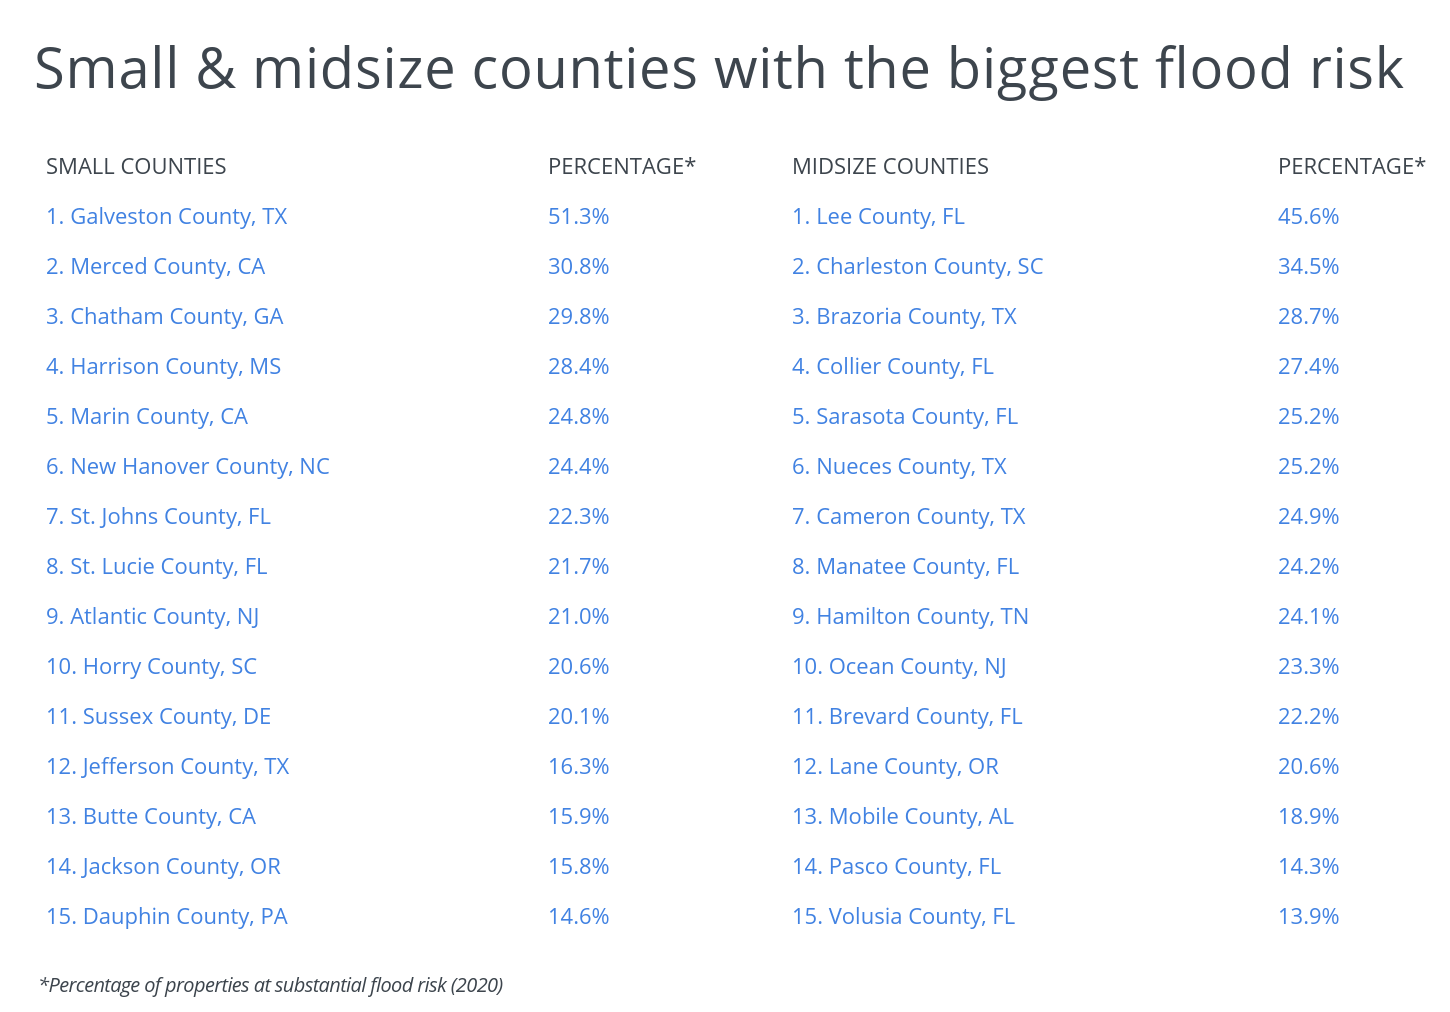
To find the counties that have the biggest flood risks, researchers at Porch used data from First Street Foundation, the National Centers for Environmental Information, and the U.S. Census Bureau. Researchers ranked counties based on the percentage of properties at substantial flood risk in 2020—defined as being projected to experience a flood of 1 cm or more in the next 100 years—and gathered additional data on projected flood risk in 2050, population, and median income in each area.
Here are the counties with the biggest flood risk.
Large Counties With the Biggest Flood Risk

Photo Credit: Alamy Stock Photo
15. Essex County, MA
- Metro: Boston-Cambridge-Newton, MA-NH
- Percentage of properties at substantial flood risk (2020): 11.5%
- Percentage of properties at substantial flood risk (2050): 12.5%
- Number of properties at substantial flood risk (2020): 25,929
- Number of properties at substantial flood risk (2050): 28,230
- Change in properties at substantial flood risk (2020-2050): +8.9%
- Median household income: $79,263
- Population: 783,676

Photo Credit: Alamy Stock Photo
14. Allegheny County, PA
- Metro: Pittsburgh, PA
- Percentage of properties at substantial flood risk (2020): 11.8%
- Percentage of properties at substantial flood risk (2050): 12.2%
- Number of properties at substantial flood risk (2020): 68,102
- Number of properties at substantial flood risk (2050): 70,338
- Change in properties at substantial flood risk (2020-2050): +3.3%
- Median household income: $61,043
- Population: 1,221,744
TRENDING
Have your kitchen cabinets been impacted by storm weather? Or maybe it’s just time for a fresh look in your kitchen? Here’s what it would cost to install kitchen cabinets in your home.

Photo Credit: Alamy Stock Photo
13. Harris County, TX
- Metro: Houston-The Woodlands-Sugar Land, TX
- Percentage of properties at substantial flood risk (2020): 11.8%
- Percentage of properties at substantial flood risk (2050): 14.4%
- Number of properties at substantial flood risk (2020): 168,102
- Number of properties at substantial flood risk (2050): 204,513
- Change in properties at substantial flood risk (2020-2050): +21.7%
- Median household income: $61,705
- Population: 4,646,630

Photo Credit: Alamy Stock Photo
12. San Mateo County, CA
- Metro: San Francisco-Oakland-Berkeley, CA
- Percentage of properties at substantial flood risk (2020): 11.8%
- Percentage of properties at substantial flood risk (2050): 15.8%
- Number of properties at substantial flood risk (2020): 26,181
- Number of properties at substantial flood risk (2050): 35,102
- Change in properties at substantial flood risk (2020-2050): +34.1%
- Median household income: $122,641
- Population: 767,423

Photo Credit: Alamy Stock Photo
11. Fairfield County, CT
- Metro: Bridgeport-Stamford-Norwalk, CT
- Percentage of properties at substantial flood risk (2020): 12.5%
- Percentage of properties at substantial flood risk (2050): 13.6%
- Number of properties at substantial flood risk (2020): 32,954
- Number of properties at substantial flood risk (2050): 36,037
- Change in properties at substantial flood risk (2020-2050): +9.4%
- Median household income: $95,645
- Population: 943,926

Photo Credit: Alamy Stock Photo
10. Erie County, NY
- Metro: Buffalo-Cheektowaga, NY
- Percentage of properties at substantial flood risk (2020): 12.7%
- Percentage of properties at substantial flood risk (2050): 13.1%
- Number of properties at substantial flood risk (2020): 45,481
- Number of properties at substantial flood risk (2050): 47,059
- Change in properties at substantial flood risk (2020-2050): +3.5%
- Median household income: $58,121
- Population: 919,355

Photo Credit: Alamy Stock Photo
9. Suffolk County, MA
- Metro: Boston-Cambridge-Newton, MA-NH
- Percentage of properties at substantial flood risk (2020): 13.1%
- Percentage of properties at substantial flood risk (2050): 16.3%
- Number of properties at substantial flood risk (2020): 15,907
- Number of properties at substantial flood risk (2050): 19,770
- Change in properties at substantial flood risk (2020-2050): +24.3%
- Median household income: $69,669
- Population: 796,605

Photo Credit: Alamy Stock Photo
8. Fresno County, CA
- Metro: Fresno, CA
- Percentage of properties at substantial flood risk (2020): 15.2%
- Percentage of properties at substantial flood risk (2050): 16.7%
- Number of properties at substantial flood risk (2020): 47,262
- Number of properties at substantial flood risk (2050): 51,801
- Change in properties at substantial flood risk (2020-2050): +9.6%
- Median household income: $53,969
- Population: 984,521

Photo Credit: Alamy Stock Photo
7. Fort Bend County, TX
- Metro: Houston-The Woodlands-Sugar Land, TX
- Percentage of properties at substantial flood risk (2020): 18.7%
- Percentage of properties at substantial flood risk (2050): 19.8%
- Number of properties at substantial flood risk (2020): 60,411
- Number of properties at substantial flood risk (2050): 63,923
- Change in properties at substantial flood risk (2020-2050): +5.8%
- Median household income: $97,743
- Population: 765,394

Photo Credit: Alamy Stock Photo
6. Hidalgo County, TX
- Metro: McAllen-Edinburg-Mission, TX
- Percentage of properties at substantial flood risk (2020): 19.0%
- Percentage of properties at substantial flood risk (2050): 19.6%
- Number of properties at substantial flood risk (2020): 56,559
- Number of properties at substantial flood risk (2050): 58,334
- Change in properties at substantial flood risk (2020-2050): +3.1%
- Median household income: $40,014
- Population: 855,176

Photo Credit: Alamy Stock Photo
5. Hillsborough County, FL
- Metro: Tampa-St. Petersburg-Clearwater, FL
- Percentage of properties at substantial flood risk (2020): 19.4%
- Percentage of properties at substantial flood risk (2050): 23.4%
- Number of properties at substantial flood risk (2020): 95,899
- Number of properties at substantial flood risk (2050): 116,008
- Change in properties at substantial flood risk (2020-2050): +21.0%
- Median household income: $58,884
- Population: 1,422,278
RELATED
It’s recommended that you replace your carpeting every 5 to 15 years. Try out our carpet installation cost calculator to find out what it would cost to replace the carpet in your home.
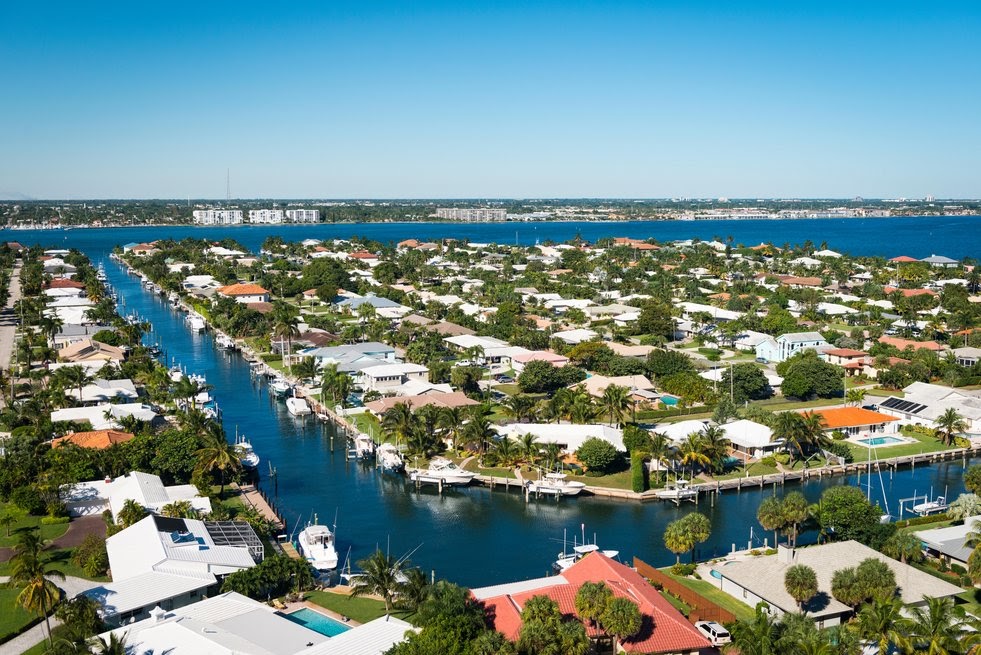
Photo Credit: Alamy Stock Photo
4. Palm Beach County, FL
- Metro: Miami-Fort Lauderdale-Pompano Beach, FL
- Percentage of properties at substantial flood risk (2020): 24.2%
- Percentage of properties at substantial flood risk (2050): 27.7%
- Number of properties at substantial flood risk (2020): 107,062
- Number of properties at substantial flood risk (2050): 122,276
- Change in properties at substantial flood risk (2020-2050): +14.2%
- Median household income: $63,299
- Population: 1,465,027

Photo Credit: Alamy Stock Photo
3. Broward County, FL
- Metro: Miami-Fort Lauderdale-Pompano Beach, FL
- Percentage of properties at substantial flood risk (2020): 27.8%
- Percentage of properties at substantial flood risk (2050): 31.7%
- Number of properties at substantial flood risk (2020): 146,274
- Number of properties at substantial flood risk (2050): 167,154
- Change in properties at substantial flood risk (2020-2050): +14.3%
- Median household income: $59,547
- Population: 1,926,205
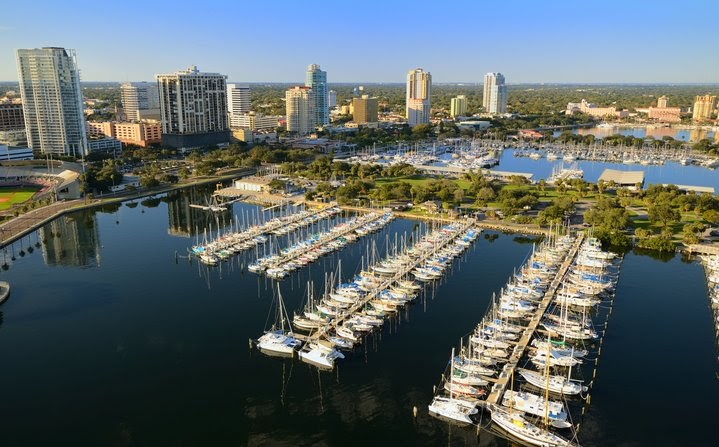
Photo Credit: Alamy Stock Photo
2. Pinellas County, FL
- Metro: Tampa-St. Petersburg-Clearwater, FL
- Percentage of properties at substantial flood risk (2020): 29.9%
- Percentage of properties at substantial flood risk (2050): 33.0%
- Number of properties at substantial flood risk (2020): 93,193
- Number of properties at substantial flood risk (2050): 102,895
- Change in properties at substantial flood risk (2020-2050): +10.4%
- Median household income: $54,090
- Population: 964,666
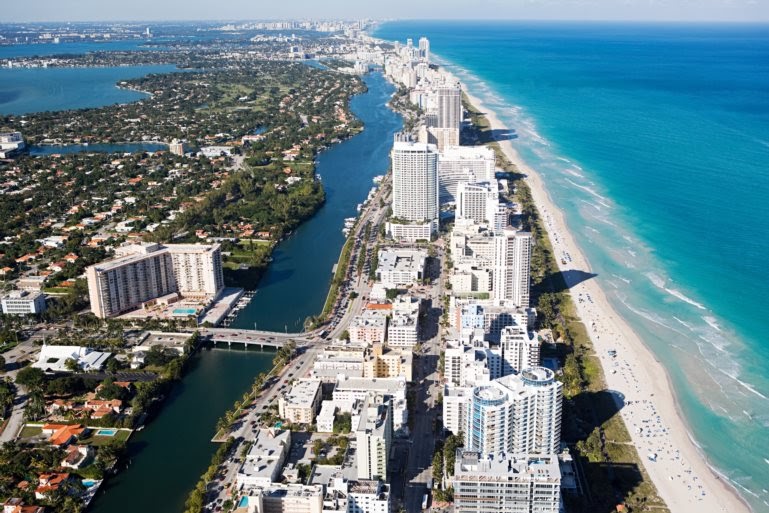
Photo Credit: Alamy Stock Photo
1. Miami-Dade County, FL
- Metro: Miami-Fort Lauderdale-Pompano Beach, FL
- Percentage of properties at substantial flood risk (2020): 30.2%
- Percentage of properties at substantial flood risk (2050): 37.9%
- Number of properties at substantial flood risk (2020): 174,736
- Number of properties at substantial flood risk (2050): 219,242
- Change in properties at substantial flood risk (2020-2050): +25.5%
- Median household income: $51,347
- Population: 2,699,428
Detailed Findings & Methodology
The data used in this analysis is from the First Street Foundation, the National Centers for Environmental Information’s Billion-Dollar Weather and Climate Disasters, and the U.S. Census Bureau’s American Community Survey. To determine the locations with the biggest flood risk, researchers calculated the percentage of properties at substantial flood risk in 2020. First Street Foundation defined a property to be at “substantial flood risk” if it was projected to experience a flood of 1 cm or more in the next 100 years.
In the event of a tie, the location with the higher percentage of properties at substantial flood risk in 2050 was ranked higher.To improve relevance, only counties with at least 200,000 residents were included. Additionally, counties were grouped into cohorts based on population size: small (200,000–349,999), midsize (350,000–749,999), and large (750,000 or more).


