Unusually high demand in the real estate market has been a consistent fact throughout the COVID-19 pandemic. While real estate sales—like most aspects of the economy—ground to a halt in March and April of 2020, buyers since then have been snapping homes up quickly, often offering to pay above asking prices and make other concessions to land a deal.
Part of the reason for this spike in demand has been favorable economic conditions for middle and upper income earners. While lower-wage workers were at much greater risk of economic instability during the pandemic, most professional class workers were able to keep their jobs by transitioning to remote work, save money from reduced spending in categories like travel, entertainment, and food, and enjoy strong returns in the stock market. Good household financial conditions and low mortgage interest rates put homeownership within reach for many buyers. Be sure to read the best cities to retire to.
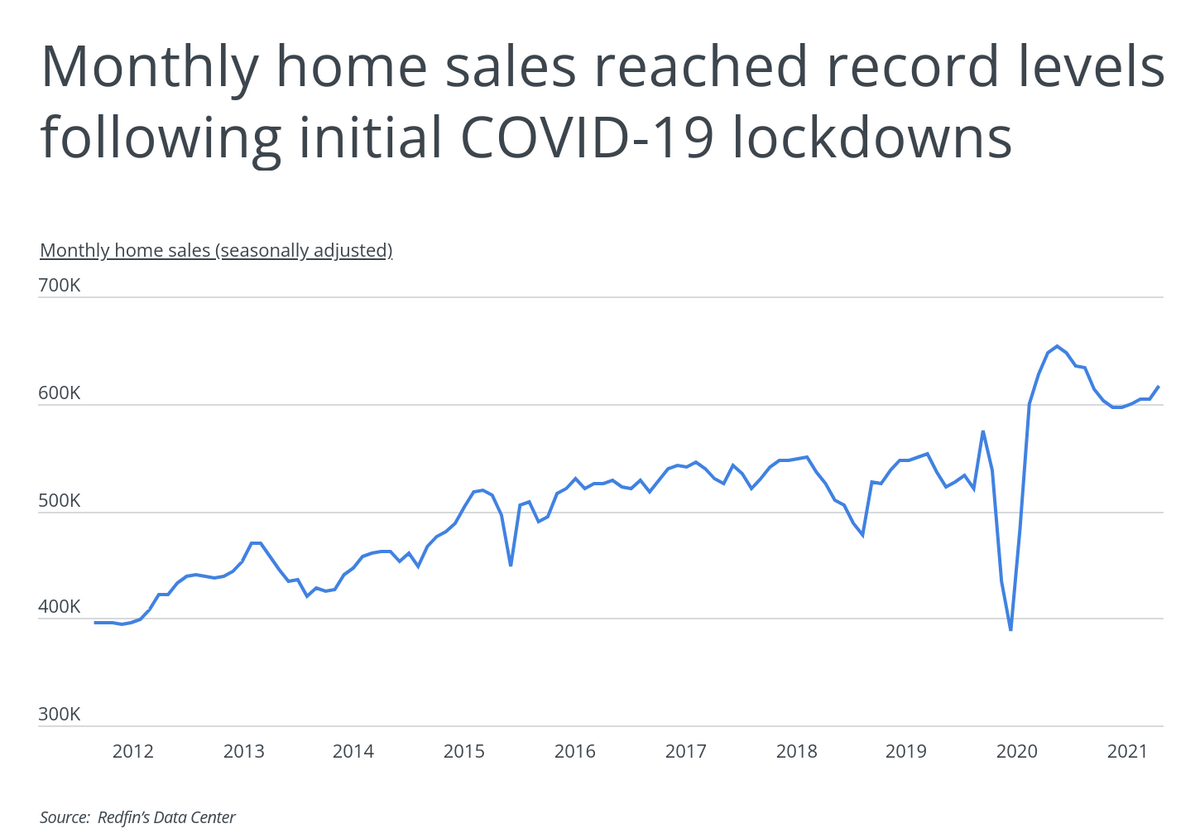
The total volume of home sales nationwide shows the extent of this demand. Seasonally-adjusted monthly home sales dropped sharply early at the start of the pandemic to less than 400,000 in May 2020 but rebounded to a peak of more than 650,000 in October 2020. Monthly sales since then have leveled out at a lower level, but are still well above pre-pandemic levels. Find out what are the most expensive US Cities Per Square Foot?. This volume of homes is moving off the market even in spite of the fact that the inventory of homes for sale was at record lows for most of the pandemic. The way we think about buying houses is changing, more info here.
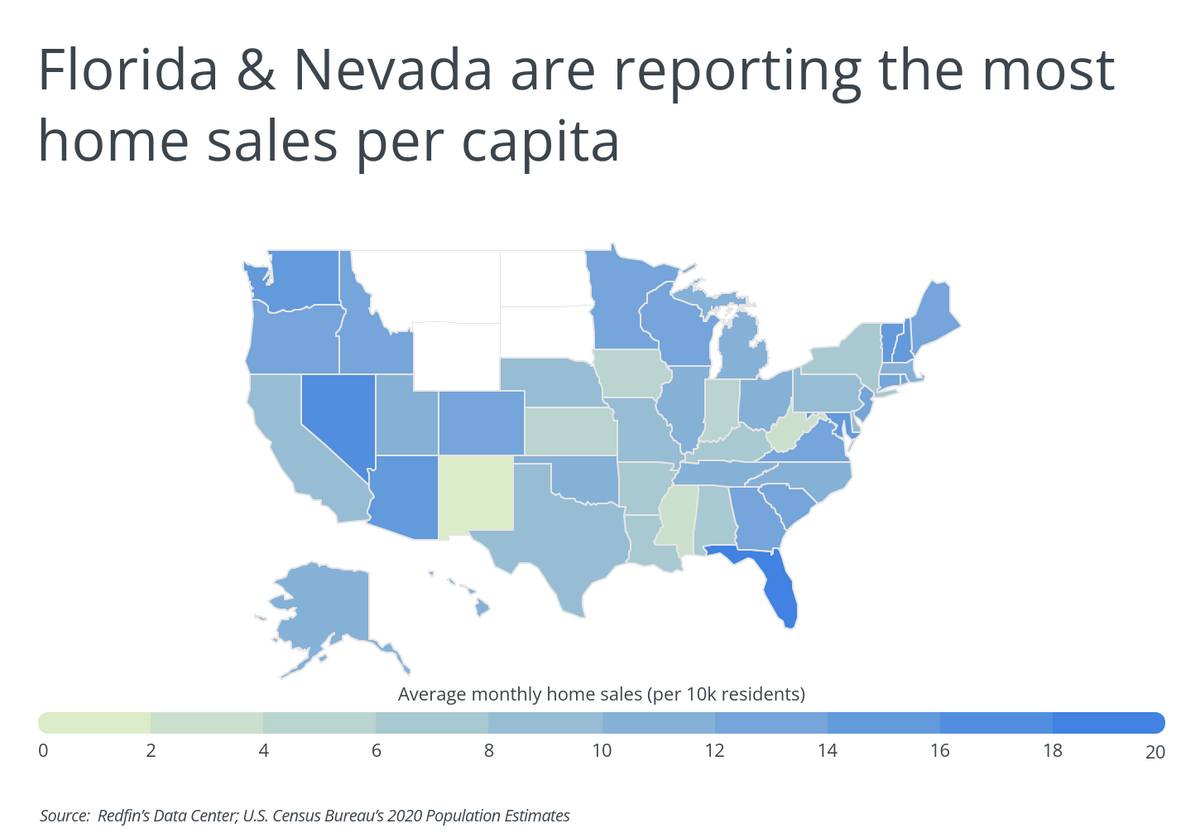
While demand is unusually high in most markets, some locations are seeing greater competition than others. Notably, Nevada and Florida house markets are far ahead of other states in average monthly home sales at 19.7 and 16.9 home sales per 10,000 residents. Most of the leading states offer a combination of relatively affordable real estate, strong economic opportunities, and temperate climates that make them an appealing alternative to high-cost states like California and New York, which are seeing greater numbers of people moving away. At the metro level, the same trends hold with many so-called “second tier cities” in the South and West experiencing the greatest demand.
TRENDING
Baseboards help to hide the visible seam or line between the floor and the walls of your home. If your baseboards are warped or damaged beyond repair, it might be time to replace them. Read more in our baseboard installation guide.
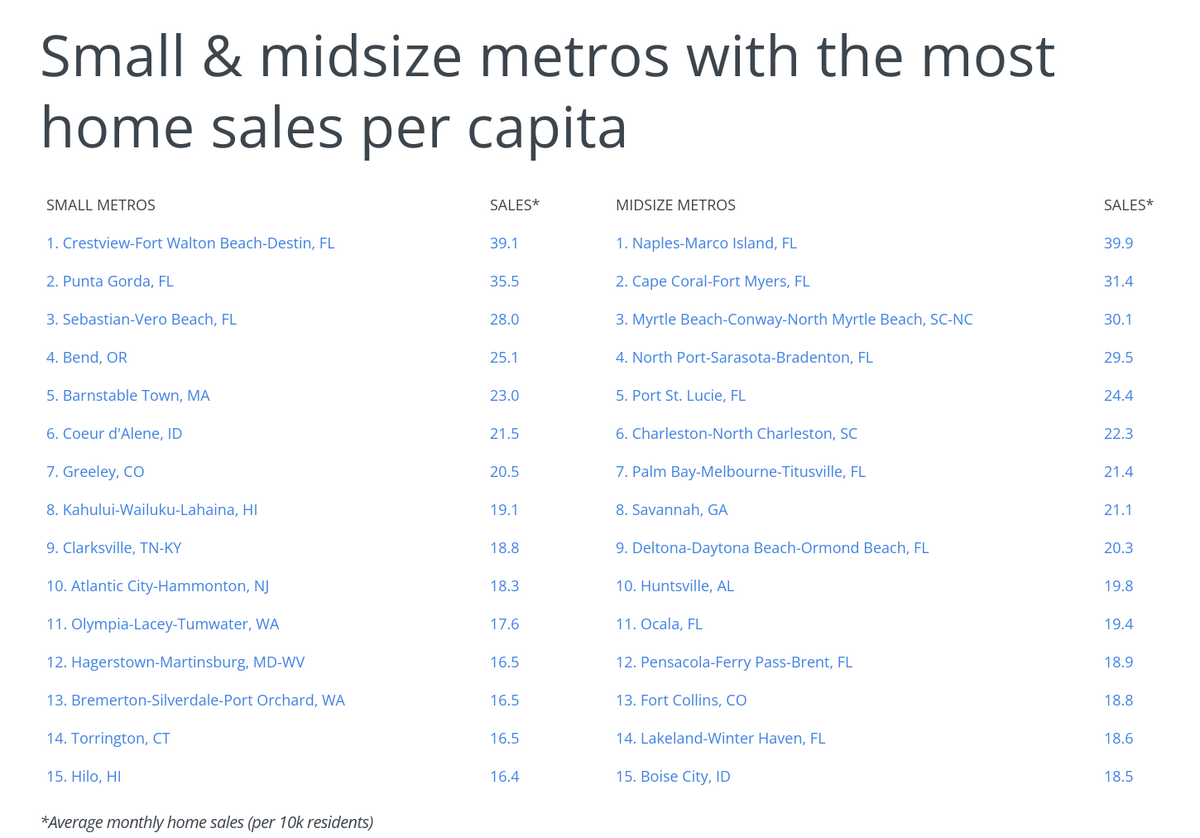
The data used in this analysis is from Redfinand the U.S. Census Bureau. To determine the metropolitan areas with the most home sales, researchers at Porch calculated the average monthly home sales per 10,000 residents between January and September 2021. In the event of a tie, the location with the greater average monthly home sales was ranked higher. Researchers also included median days on the market, the percentage of homes that sold above asking, and median sale price. To improve relevance, only locations with at least 100,000 residents and available data from Redfin were included. Additionally, metros were grouped into cohorts based on population size.
Refinancing your mortgage can help you in many ways, to help you out we are offering you a way to assess the right time to refinance your home. Paying off your existing loan and replacing it with a new mortgage plan can help you obtain a lower interest rate, shorten your mortgage deadline, and even help you find a better deal.
Here are the metros with the most home sales per capita.
Large Metros With the Most Home Sales Per Capita

Photo Credit: Checubus / Shutterstock
15. Minneapolis-St. Paul-Bloomington, MN-WI
- Average monthly home sales (per 10k residents): 15.3
- Average monthly home sales (total): 5,600
- Median days on market: 16
- Percentage of homes that sold above asking: 59.6%
- Median sale price: $340,585
DID YOU KNOW?
Fiberglass bathtubs have a lifespan of about 20 years, though some homeowners choose to replace them even sooner to keep the look of their home fresh. Replacing a bathtub is a challenging project, and there are many things for homeowners to consider. Here’s what you need to know about a bathtub replacement project.

Photo Credit: LHBLLC / Shutterstock
14. Tucson, AZ
- Average monthly home sales (per 10k residents): 15.6
- Average monthly home sales (total): 1,652
- Median days on market: 39
- Percentage of homes that sold above asking: 46.7%
- Median sale price: $296,913

Photo Credit: Checubus / Shutterstock
13. Seattle-Tacoma-Bellevue, WA
- Average monthly home sales (per 10k residents): 15.9
- Average monthly home sales (total): 6,390
- Median days on market: 6
- Percentage of homes that sold above asking: 63.3%
- Median sale price: $660,383

Photo Credit: Sherry V Smith / Shutterstock
12. Virginia Beach-Norfolk-Newport News, VA-NC
- Average monthly home sales (per 10k residents): 16.4
- Average monthly home sales (total): 2,927
- Median days on market: 21
- Percentage of homes that sold above asking: 52.6%
- Median sale price: $280,246

Photo Credit: Luciano Mortula – LGM / Shutterstock
11. Atlanta-Sandy Springs-Alpharetta, GA
- Average monthly home sales (per 10k residents): 16.5
- Average monthly home sales (total): 10,071
- Median days on market: 14
- Percentage of homes that sold above asking: 48.0%
- Median sale price: $318,216

Photo Credit: Jon Bilous / Shutterstock
10. Charlotte-Concord-Gastonia, NC-SC
- Average monthly home sales (per 10k residents): 16.6
- Average monthly home sales (total): 4,445
- Median days on market: 34
- Percentage of homes that sold above asking: 52.6%
- Median sale price: $327,622

Photo Credit: Roschetzky Photography / Shutterstock
9. Denver-Aurora-Lakewood, CO
- Average monthly home sales (per 10k residents): 16.9
- Average monthly home sales (total): 5,052
- Median days on market: 6
- Percentage of homes that sold above asking: 65.0%
- Median sale price: $519,201

Photo Credit: Gregory E. Clifford / Shutterstock
8. Phoenix-Mesa-Chandler, AZ
- Average monthly home sales (per 10k residents): 17.3
- Average monthly home sales (total): 8,777
- Median days on market: 26
- Percentage of homes that sold above asking: 51.9%
- Median sale price: $389,758

Photo Credit: Farid Sani / Shutterstock
7. Raleigh-Cary, NC
- Average monthly home sales (per 10k residents): 17.6
- Average monthly home sales (total): 2,495
- Median days on market: 36
- Percentage of homes that sold above asking: 59.2%
- Median sale price: $355,787

Photo Credit: Songquan Deng / Shutterstock
6. Orlando-Kissimmee-Sanford, FL
- Average monthly home sales (per 10k residents): 17.8
- Average monthly home sales (total): 4,703
- Median days on market: 14
- Percentage of homes that sold above asking: 32.0%
- Median sale price: $317,623
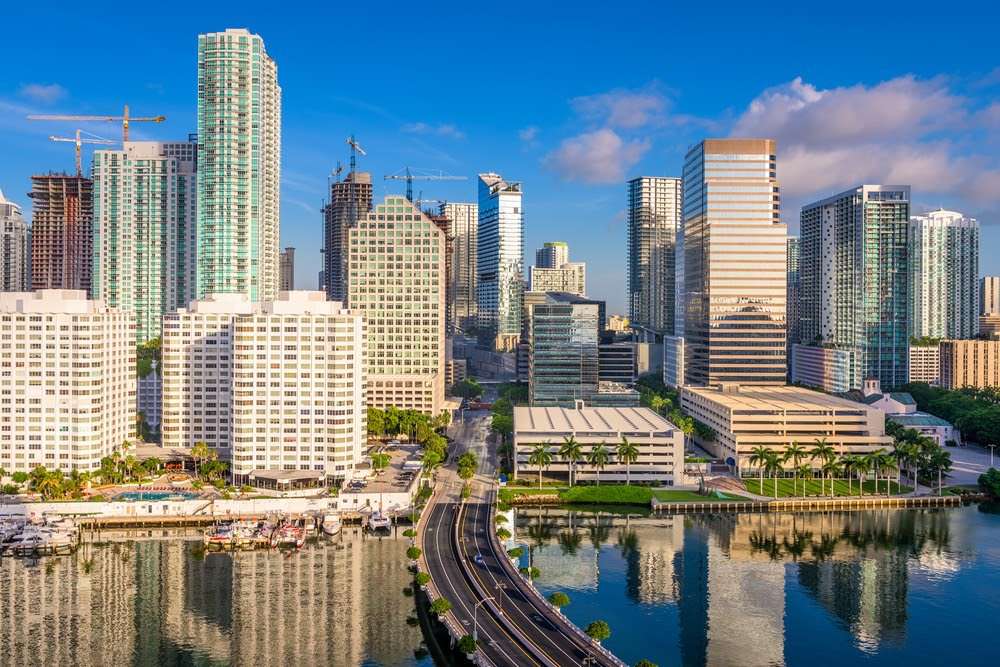
Photo Credit: Sean Pavone / Shutterstock
5. Miami-Fort Lauderdale-Pompano Beach, FL
- Average monthly home sales (per 10k residents): 17.8
- Average monthly home sales (total): 10,982
- Median days on market: 56
- Percentage of homes that sold above asking: 20.7%
- Median sale price: $364,244
RELATED
If you’re thinking of adding pavers to your home, it’s important to understand how much they cost and how much it costs to install them. Read on to learn more about pavers and what you can expect it would cost to install pavers in your home.

Photo Credit: Sean Pavone / Shutterstock
4. Las Vegas-Henderson-Paradise, NV
- Average monthly home sales (per 10k residents): 18.3
- Average monthly home sales (total): 4,230
- Median days on market: 24
- Percentage of homes that sold above asking: 44.2%
- Median sale price: $354,946

Photo Credit: Mihai_Andritoiu / Shutterstock
3. Nashville-Davidson–Murfreesboro–Franklin, TN
- Average monthly home sales (per 10k residents): 18.9
- Average monthly home sales (total): 3,710
- Median days on market: 25
- Percentage of homes that sold above asking: 44.2%
- Median sale price: $370,185

Photo Credit: Bonnie Fink / Shutterstock
2. Tampa-St. Petersburg-Clearwater, FL
- Average monthly home sales (per 10k residents): 19.8
- Average monthly home sales (total): 6,432
- Median days on market: 11
- Percentage of homes that sold above asking: 36.8%
- Median sale price: $298,234

Photo Credit: Sean Pavone / Shutterstock
1. Jacksonville, FL
- Average monthly home sales (per 10k residents): 19.9
- Average monthly home sales (total): 3,158
- Median days on market: 28
- Percentage of homes that sold above asking: 35.4%
- Median sale price: $292,631
Detailed Findings & Methodology
The data used in this analysis is from Redfin’s Data Centerand the U.S. Census Bureau’s2020 Population Estimates. To determine the locations with the most home sales per capita, researchers calculated the average monthly home sales per 10,000 residents between January and September 2021. In the event of a tie, the location with the greater average monthly home sales was ranked higher. The additional fields of median days on market, percentage of homes that sold above asking, and median sale price were determined using a weighted average of the monthly data based on the number of homes sold for the specific location and time period. Keep in mind that even when your home has some damage you can still find a way to sell it, there are even companies that buy houses that have suffered some damage. To improve relevance, only locations with at least 100,000 residents and available data from Redfin were included. Additionally, metros were grouped into cohorts based on population size: small (100,000–349,999), midsize (350,000–999,999), and large (1,000,000 or more).


