
Despite perceptions of rising crime, theft has become far less common in recent years than it used to be, and property crime rates declined even more sharply during the pandemic. That said, there are still hotspots where break-ins and burglaries are far more common than the typical American neighborhood. While approximately 400 burglaries and 1,700 larceny-thefts per 100,000 people annually have been the national norm over the past five years, there are cities in the United States that report rates double or even triple those numbers.
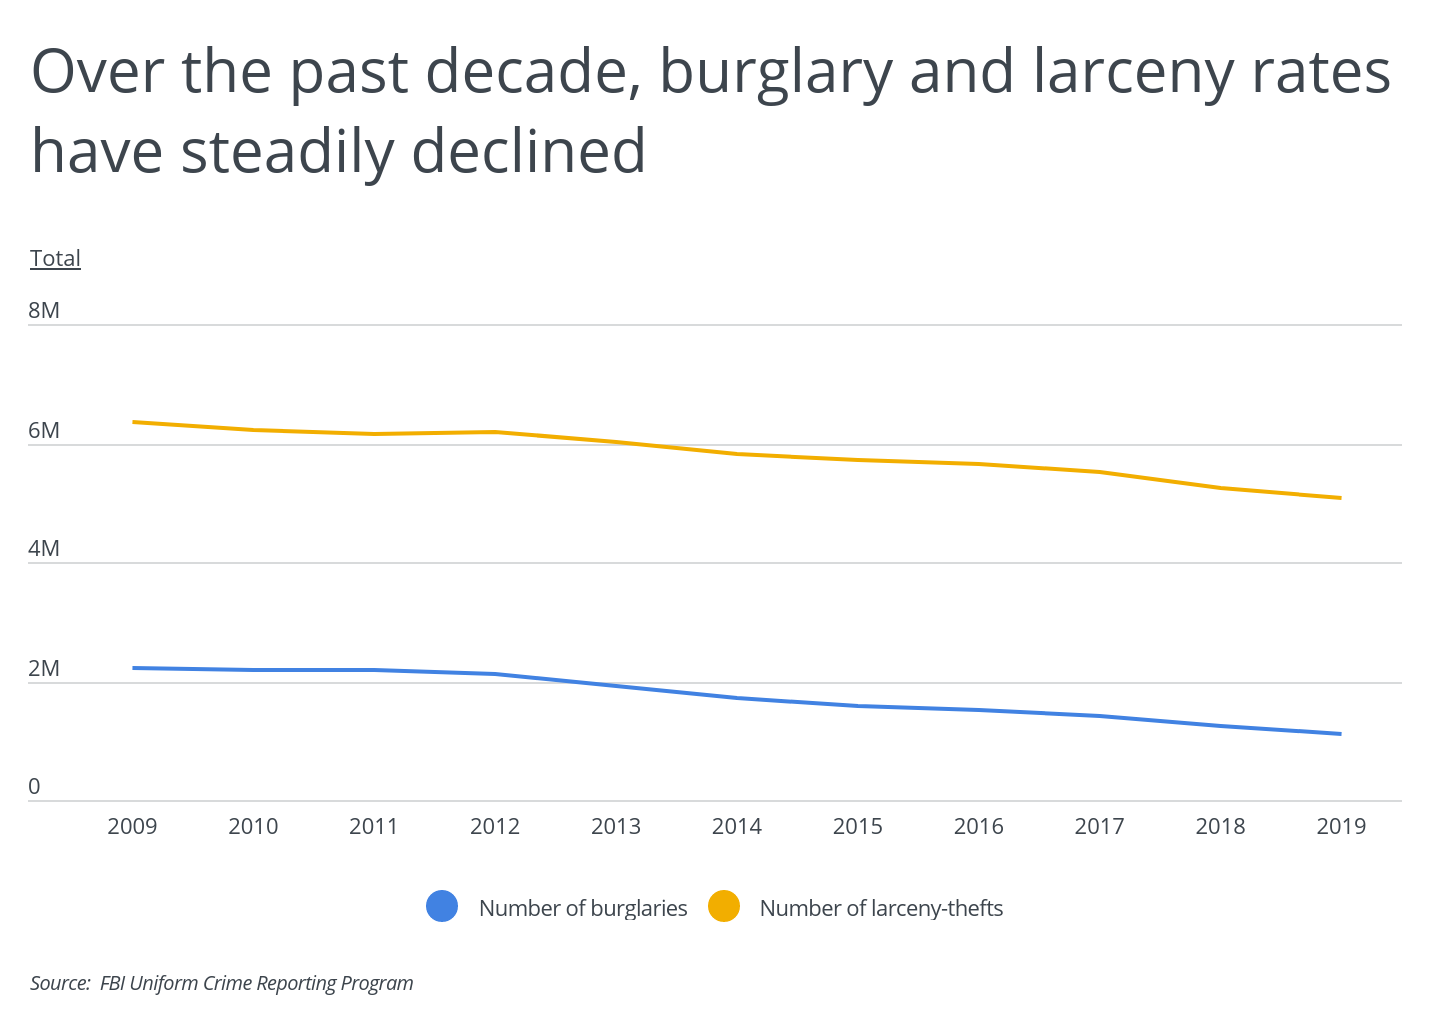
As with anything, an understanding of what burglars are after and where they are active can help keep the trend heading lower. Over the last decade, the number of larceny-thefts fell nearly 20% from 6.3 million to 5.1 million, and the number of burglaries were cut in half from 2.2 million to 1.1 million, according to FBI statistics from 2015 to 2019. And it’s not a new trend. Since 1993, property crimes declined dramatically—55% to 71% depending on which source of stats you look at, Pew Research found.
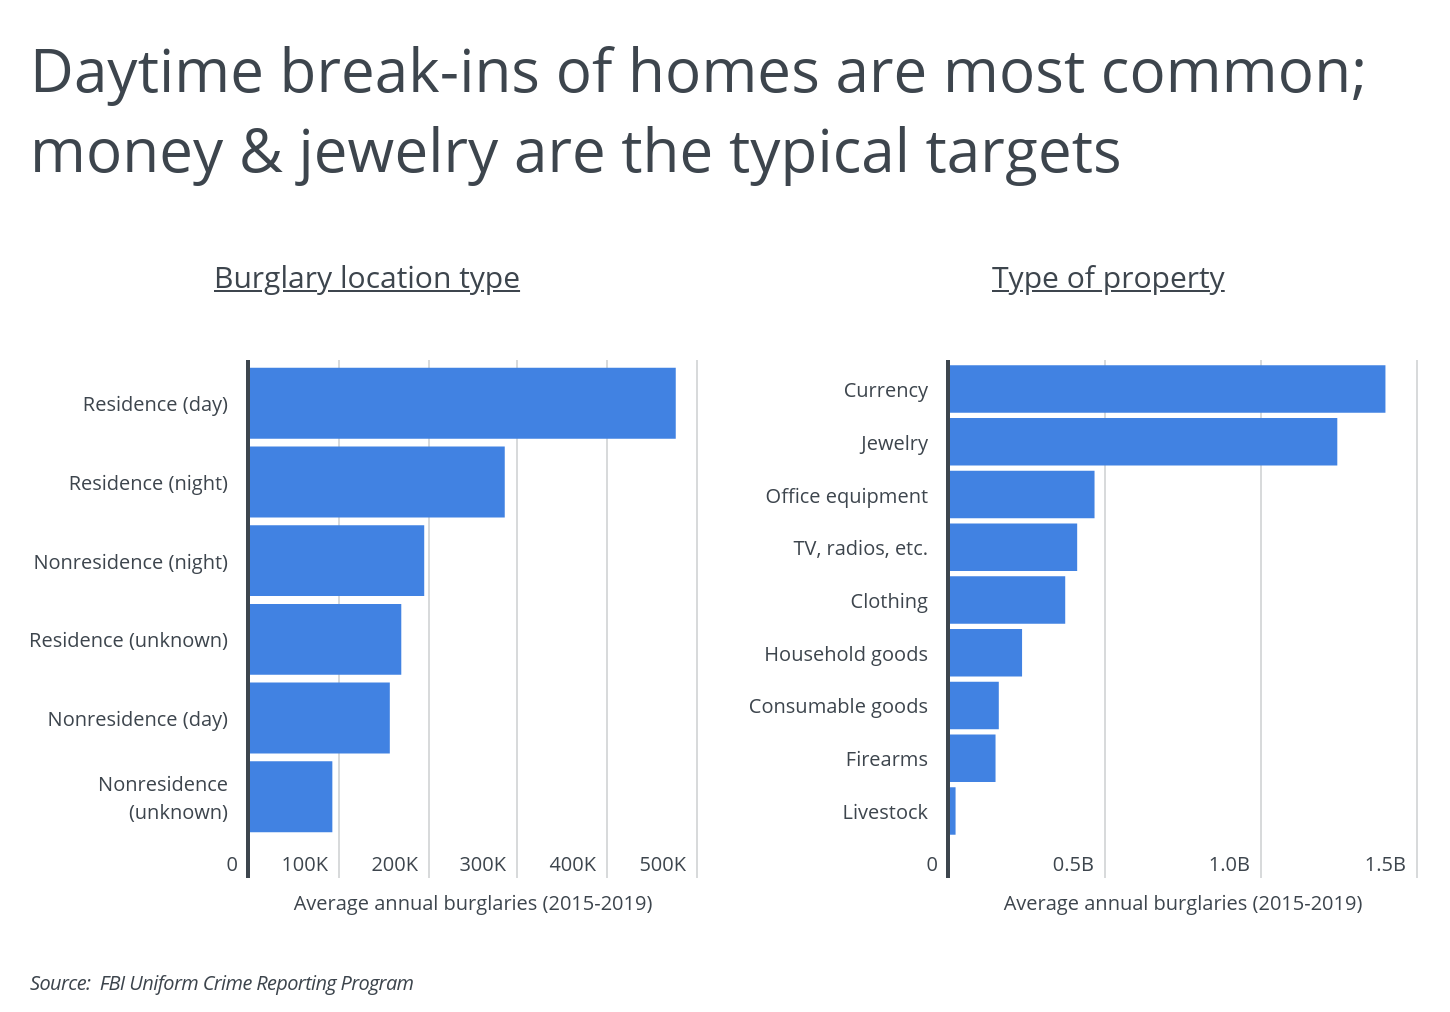
Looking at the past five years of crime data, burglars were about twice as likely to target a home than a business or other building, and nearly half of all burglaries occurred during broad daylight. Once in, thieves were often after two items in particular: money and jewelry. Together, those valuables were worth more than the remaining top categories of stolen goods combined. Of those other items, office equipment, electronics, and clothing were common targets.
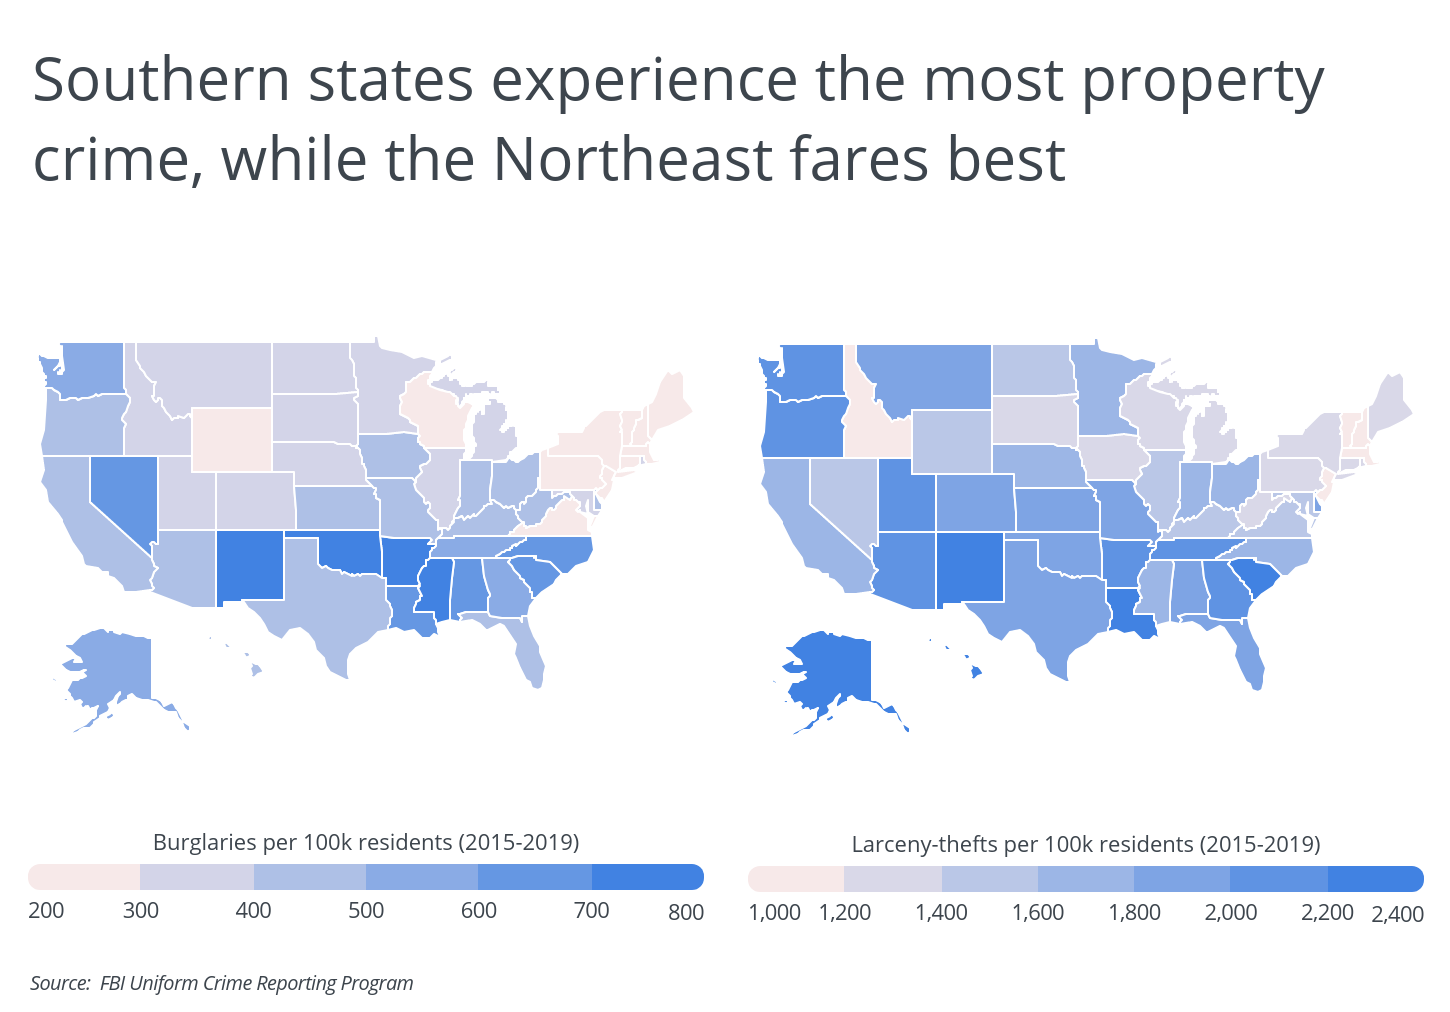
Protecting your home and taking initiatives to deter potential burglars are obvious steps to fight crime, but choosing a safe location to begin with is one of the most important factors. For example, burglaries occur in New York, New Hampshire, and Virginia less than half as many times as the national average, while residents of New Mexico, Mississippi, Oklahoma, Arkansas, and Louisiana are burglarized nearly twice as often. In general, states in the South have higher-than-average property crime rates, and the states in the Northeast enjoy the lowest theft rates of any region in America.
RELATED
The cost to install tile in your home can range from $14 to over $20 per square foot. Use our tile installation cost calculator to find what it would cost to replace tile in your area.
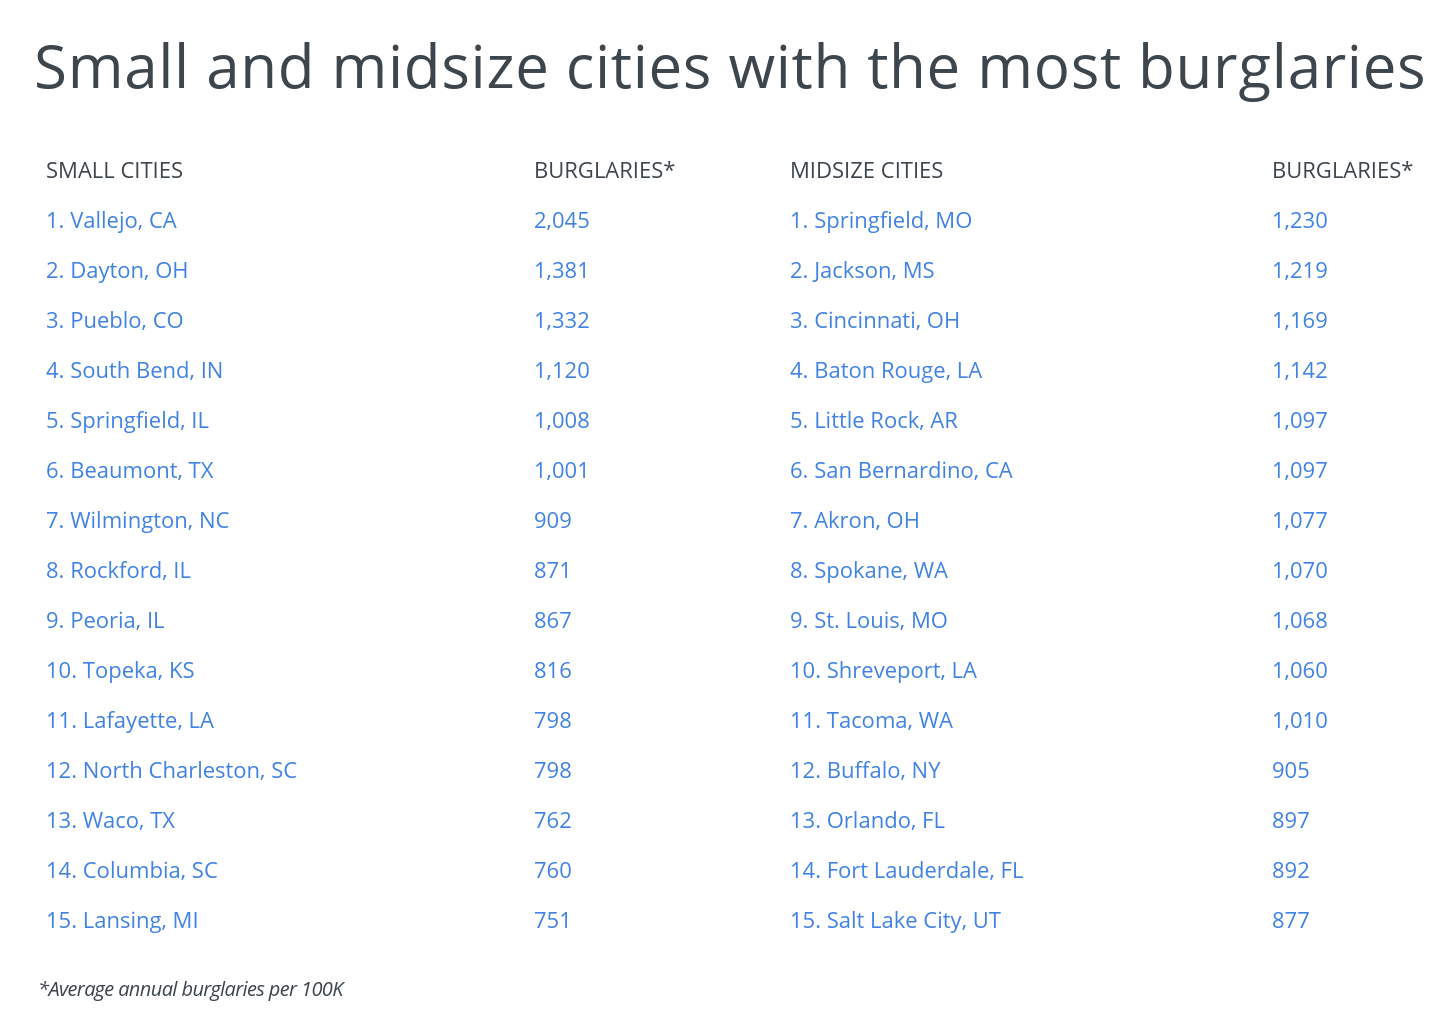
To find out which cities were hotspots for theft, researchers at Porch analyzed data from the FBI’s Uniform Crime Reporting Program between 2015 to 2019 and then calculated the average number of burglaries and larceny-thefts per 100,000 residents. For comparison, cities were divided into three groups based on population.
Here are the 15 U.S. cities with the most burglaries.
Large Cities With the Most Burglaries

Photo Credit: Alamy Stock Photo
15. Dallas, TX
- Average annual burglaries per 100k: 752
- Average annual larceny-thefts per 100k: 1,925
- Average annual burglaries total: 10,044
- Average annual larceny-thefts total: 25,729
TRENDING
Aside from basic installation, there are several other factors to consider when calculating the cost to install a fence—including the height and length, the number of gates needed, and the finish.
Photo Credit: Alamy Stock Photo
14. Houston, TX
- Average annual burglaries per 100k: 763
- Average annual larceny-thefts per 100k: 2,931
- Average annual burglaries total: 17,762
- Average annual larceny-thefts total: 68,295

Photo Credit: Alamy Stock Photo
13. Las Vegas, NV
- Average annual burglaries per 100k: 782
- Average annual larceny-thefts per 100k: 1,608
- Average annual burglaries total: 12,618
- Average annual larceny-thefts total: 26,052

Photo Credit: Alamy Stock Photo
12. Columbus, OH
- Average annual burglaries per 100k: 782
- Average annual larceny-thefts per 100k: 2,558
- Average annual burglaries total: 6,833
- Average annual larceny-thefts total: 22,374

Photo Credit: Alamy Stock Photo
11. Minneapolis, MN
- Average annual burglaries per 100k: 818
- Average annual larceny-thefts per 100k: 2,950
- Average annual burglaries total: 3,445
- Average annual larceny-thefts total: 12,438

Photo Credit: Alamy Stock Photo
10. Milwaukee, WI
- Average annual burglaries per 100k: 828
- Average annual larceny-thefts per 100k: 1,794
- Average annual burglaries total: 4,943
- Average annual larceny-thefts total: 10,710

Photo Credit: Alamy Stock Photo
9. Wichita, KS
- Average annual burglaries per 100k: 841
- Average annual larceny-thefts per 100k: 3,935
- Average annual burglaries total: 3,289
- Average annual larceny-thefts total: 15,381

Photo Credit: Alamy Stock Photo
8. Kansas City, MO
- Average annual burglaries per 100k: 872
- Average annual larceny-thefts per 100k: 2,592
- Average annual burglaries total: 4,216
- Average annual larceny-thefts total: 12,577

Photo Credit: Alamy Stock Photo
7. Oklahoma City, OK
- Average annual burglaries per 100k: 918
- Average annual larceny-thefts per 100k: 2,532
- Average annual burglaries total: 5,936
- Average annual larceny-thefts total: 16,364

Photo Credit: Alamy Stock Photo
6. Bakersfield, CA
- Average annual burglaries per 100k: 1,014
- Average annual larceny-thefts per 100k: 2,471
- Average annual burglaries total: 3,869
- Average annual larceny-thefts total: 9,425

Photo Credit: Alamy Stock Photo
5. Seattle, WA
- Average annual burglaries per 100k: 1,064
- Average annual larceny-thefts per 100k: 3,583
- Average annual burglaries total: 7,669
- Average annual larceny-thefts total: 25,807

Photo Credit: Alamy Stock Photo
4. Baltimore, MD
- Average annual burglaries per 100k: 1,132
- Average annual larceny-thefts per 100k: 2,772
- Average annual burglaries total: 6,927
- Average annual larceny-thefts total: 16,942

Photo Credit: Alamy Stock Photo
3. Detroit, MI
- Average annual burglaries per 100k: 1,168
- Average annual larceny-thefts per 100k: 2,161
- Average annual burglaries total: 7,825
- Average annual larceny-thefts total: 14,471
RELATED
Power washing can help make your home look brand new again. The cost to pressure wash a house can vary depending on a wide variety of factors.

Photo Credit: Alamy Stock Photo
2. Tulsa, OK
- Average annual burglaries per 100k: 1,314
- Average annual larceny-thefts per 100k: 3,351
- Average annual burglaries total: 5,302
- Average annual larceny-thefts total: 13,518

Photo Credit: Alamy Stock Photo
1. Memphis, TN
- Average annual burglaries per 100k: 1,384
- Average annual larceny-thefts per 100k: 4,070
- Average annual burglaries total: 9,056
- Average annual larceny-thefts total: 26,609
Methodology & Detailed Findings
Crime statistics for 2015–2019 are from the FBI Uniform Crime Reporting Program. To identify which city residents experience the most property crime, researchers calculated the average number of burglaries per capita for 2015–2019. All cities present for years 2015–2019 in the FBI data with at least 100,000 people were included in the analysis. Additionally, to improve relevance, cities were grouped into cohorts based on population size: small (100,000–149,999), midsize (150,000–349,999), and large (350,000 or more).
The number of burglaries and larceny-thefts per 100,000 residents was calculated as the ratio between the average number of burglaries in 2015–2019 and the city population multiplied by 100,000.


