
Unprecedented growth in home prices over the last two years and recent increases in mortgage interest rates are pricing many would-be buyers out of the residential real estate market. One of the groups most disadvantaged by these market challenges is young homebuyers like those in Gen Z, the population of Americans born between 1997 and 2012.
Young buyers in any generation have a harder time buying homes because they tend to earn less and have less in savings or existing equity than older buyers. But Gen Z and younger Millennials in some ways face even greater challenges. The explosion of student debt and increasing rents over the last decade have stretched budgets even further, making it more difficult to save, and rising home prices have put even starter homes further out of reach. Only around 34% of adults aged 20 to 34 own homes today, compared to 44% in 1960.
Young buyers also face competition in the market from older generations. Millennials (ages 26 to 41) are now America’s largest generation by population and make up 37% of all U.S. homebuyers. Generation X (aged 42 to 57) is smaller in size but its members are in their peak earning years, giving them more financial resources to buy homes. And older Americans in the Baby Boomer and Silent Generations are increasingly choosing to age in place, which has constrained the supply of homes available for younger buyers.
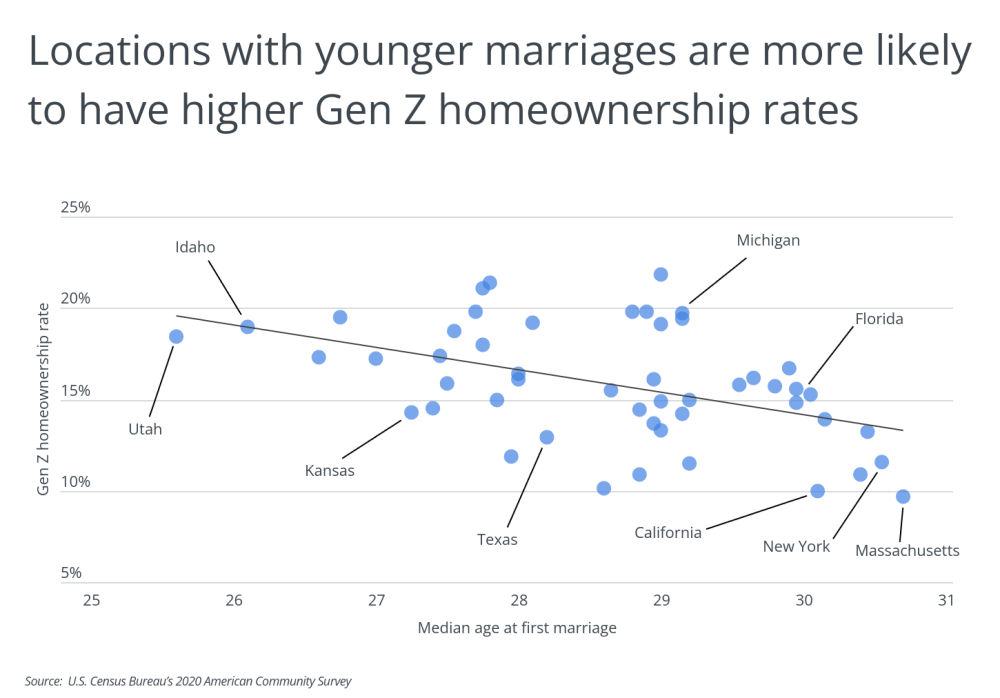
Young people’s changing social and economic norms have also delayed other major life milestones like marriage and childrearing, but there appears to be some evidence that places where people get married younger also have more young people who own homes. States where the typical age for a first marriage is older have some of the lowest rates of Gen Z homeownership, while states where marriage happens earlier have higher rates. Part of this may be simply financial, as a household with combined incomes will have more means to buy a home, and part of it may be lifestyle-related, as a married couple would be more inclined to put down roots in a location.
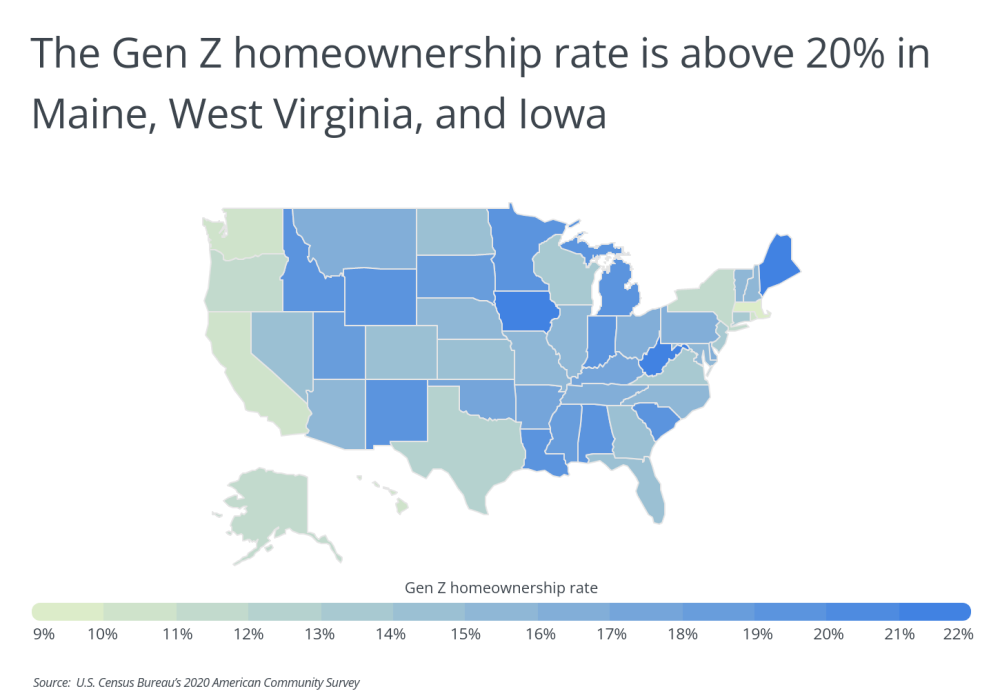
But unsurprisingly, market conditions have the largest impact on where Gen Z is able to buy homes, with more affordable locations being more likely to have higher numbers of young homeowners. Of the top 10 states for Gen Z homeownership, eight have median home prices below $300,000, according to the Zillow Home Value Index. States with higher real estate prices, like Massachusetts, California, and Washington, have the lowest share of Gen Z homeowners.
TRENDING
Are you planning a home improvement project this summer? It might be smart, and ultimately less expensive, to hire a general contractor to help you plan and execute the work. Learn more about contractors—and whether you should hire one—in our comprehensive general contractors guide.
At the metro level, affordability is likewise a major factor, with relatively low-cost locations being at the top of the list of cities with the highest Gen Z homeownership rates. One exception, however, is nation-leading Ogden, Utah, where nearly 30% of Gen Z householders own. While Ogden’s median home price is more than $500,000, it is located in the state with the lowest median age at first marriage.
The data used in this analysis is from the U.S. Census Bureau and Zillow. To determine the locations with the highest Gen Z homeownership rate, researchers at Porch calculated the homeownership rate for householders aged 15–24 in 2020. In the event of a tie, the location with the higher total number of Gen Z owner-occupied households was ranked higher. To improve relevance, only the 100 most populous metropolitan areas were considered for this analysis.
Here are the U.S. metropolitan areas with the highest Gen Z homeownership rates.
Major Metros With the Highest Gen Z Homeownership Rates
 Photo Credit: Sean Pavone / Shutterstock
15. Boise City, ID
- Gen Z homeownership rate: 19.4%
- Median home price: $515,926
- Total Gen Z owner-occupied households: 2,158
- Total Gen Z renter-occupied households: 8,985

Photo Credit: Sean Pavone / Shutterstock
14. Augusta-Richmond County, GA-SC
- Gen Z homeownership rate: 19.6%
- Median home price: $211,662
- Total Gen Z owner-occupied households: 1,103
- Total Gen Z renter-occupied households: 4,534
GIVE IT A TRY
Need a plumber? Armed with your ZIP code and a description of the plumbing job that needs to be tackled, you can use Porch to search for an experienced plumber in your area.

Photo Credit: Felix Mizioznikov / Shutterstock
13. Baton Rouge, LA
- Gen Z homeownership rate: 19.7%
- Median home price: $227,085
- Total Gen Z owner-occupied households: 2,869
- Total Gen Z renter-occupied households: 11,683

Photo Credit: photo.ua / Shutterstock
12. Colorado Springs, CO
- Gen Z homeownership rate: 20.5%
- Median home price: $478,106
- Total Gen Z owner-occupied households: 2,929
- Total Gen Z renter-occupied households: 11,351

Photo Credit: Alton Moore / Shutterstock
11. Chattanooga, TN-GA
- Gen Z homeownership rate: 20.7%
- Median home price: $257,916
- Total Gen Z owner-occupied households: 1,512
- Total Gen Z renter-occupied households: 5,781

Photo Credit: Studio Specialty / Shutterstock
10. Detroit-Warren-Dearborn, MI
- Gen Z homeownership rate: 20.7%
- Median home price: $234,015
- Total Gen Z owner-occupied households: 9,519
- Total Gen Z renter-occupied households: 36,405

Photo Credit: D Guest Smith / Shutterstock
9. McAllen-Edinburg-Mission, TX
- Gen Z homeownership rate: 21.0%
- Median home price: $159,785
- Total Gen Z owner-occupied households: 1,700
- Total Gen Z renter-occupied households: 6,407

Photo Credit: Sean Pavone / Shutterstock
8. Birmingham-Hoover, AL
- Gen Z homeownership rate: 21.0%
- Median home price: $230,816
- Total Gen Z owner-occupied households: 3,010
- Total Gen Z renter-occupied households: 11,346
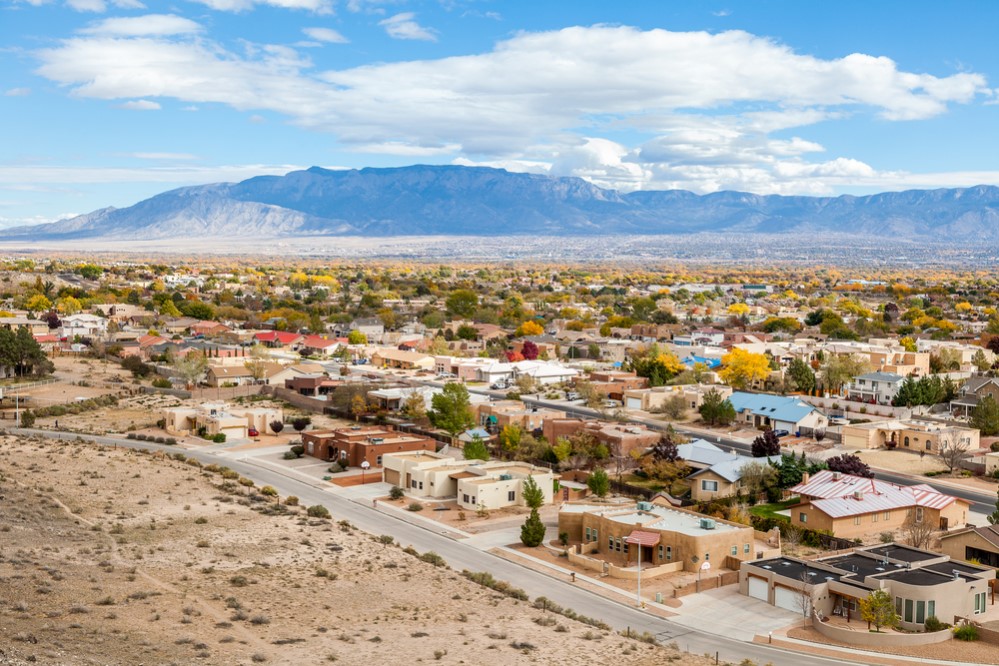
Photo Credit: turtix / Shutterstock
7. Albuquerque, NM
- Gen Z homeownership rate: 21.2%
- Median home price: $299,453
- Total Gen Z owner-occupied households: 2,907
- Total Gen Z renter-occupied households: 10,801

Photo Credit: Scott Prokop / Shutterstock
6. Modesto, CA
- Gen Z homeownership rate: 21.5%
- Median home price: $459,213
- Total Gen Z owner-occupied households: 1,118
- Total Gen Z renter-occupied households: 4,076

Photo Credit: Henryk Sadura / Shutterstock
5. Grand Rapids-Kentwood, MI
- Gen Z homeownership rate: 21.8%
- Median home price: $296,757
- Total Gen Z owner-occupied households: 4,135
- Total Gen Z renter-occupied households: 14,796

Photo Credit: Sean Pavone / Shutterstock
4. Lakeland-Winter Haven, FL
- Gen Z homeownership rate: 22.6%
- Median home price: $290,560
- Total Gen Z owner-occupied households: 1,279
- Total Gen Z renter-occupied households: 4,379

Photo Credit: Ercan Ekinci / Shutterstock
3. Palm Bay-Melbourne-Titusville, FL
- Gen Z homeownership rate: 23.9%
- Median home price: $333,878
- Total Gen Z owner-occupied households: 926
- Total Gen Z renter-occupied households: 2,953

Photo Credit: lunamarina / Shutterstock
2. Deltona-Daytona Beach-Ormond Beach, FL
- Gen Z homeownership rate: 24.3%
- Median home price: $330,260
- Total Gen Z owner-occupied households: 1,619
- Total Gen Z renter-occupied households: 5,038
LEARN MORE
Need something fixed in your home? It’s usually wise to try a handyman first since they’re typically less expensive and easier to hire. A reputable handyman will let you know if they can’t do the job and that a licensed professional should tackle it instead.

Photo Credit: JCA Images / Shutterstock
1. Ogden-Clearfield, UT
- Gen Z homeownership rate: 26.6%
- Median home price: $524,514
- Total Gen Z owner-occupied households: 2,452
- Total Gen Z renter-occupied households: 6,782
Detailed Findings & Methodology
The data used in this analysis is from the U.S. Census Bureau’s 2020 American Community Survey and Zillow’s Housing Data. To determine the locations with the highest Gen Z homeownership rate, researchers calculated the homeownership rate for householders aged 15–24 in 2020, which is the percentage of householders aged 15–24 that own. In the event of a tie, the location with the higher total number of Gen Z owner-occupied households was ranked higher. To improve relevance, only the 100 most populous metropolitan areas were considered for this analysis.


