
While the red-hot real estate market has shown some recent signs of cooling in the transition to the traditionally slower fall and winter seasons, the market remains highly competitive for homebuyers.
Throughout 2020 and 2021, the market has seen steep increases in home prices as a growing number of buyers compete for a limited inventory of homes. These conditions have required bidders to be aggressive in their offers to beat out competitors, often offering amounts significantly above sellers’ asking price. The median sales price of U.S. homes has risen by more than 20% since last summer, setting historic records and topping $400,000 for the first time earlier this year.
And the conditions contributing to this competitive environment show little sign of slowing down. One of the major issues is a constraint on supply. Fewer sellers listed their homes during the early months of the pandemic, which sent inventory to record lows late in 2020. Even after the supply of existing homes returned to pre-pandemic levels, new construction has struggled to keep up with demand due to builders’ difficulties securing materials and labor. More information on Home Remodeling trends is here. And these recent conditions do not even reflect the fact that the U.S. already had a severe shortage of homes prior to the pandemic, according to statistics from Freddie Mac. You can always reach out to your real estate agent for more expert guidance.
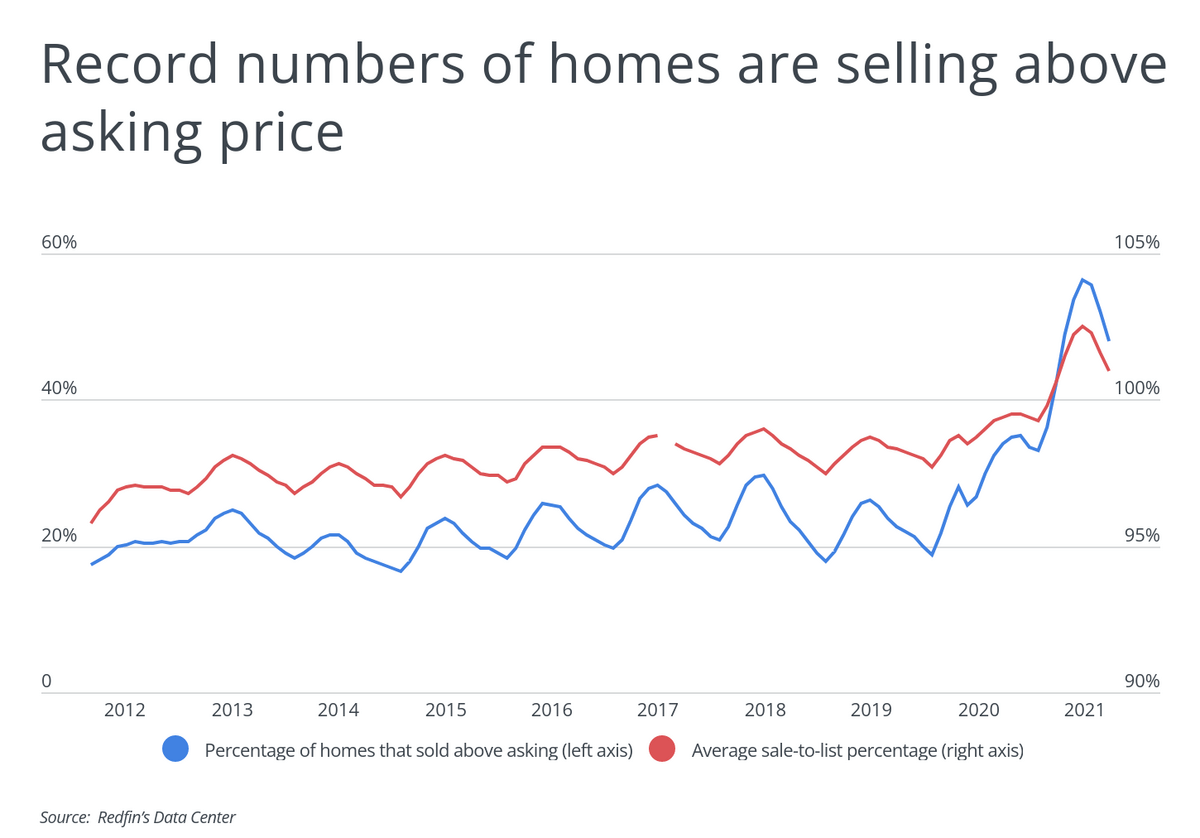
Seasonality in the market has finally slowed the upward trajectory of prices, but the share of homes selling above asking price is still well above historical levels. If you want to improve your credit first, here are some tips. In most years before the pandemic, the percentage of homes selling above asking hovered around 20% during off-peak times and around 25% during the busy summer season. In 2020 and 2021, however, the share has remained much higher than usual, peaking at 56.4% in June 2021. The average sale-to-list percentage has paralleled these trends, with the ratio nationally holding above 100% for most of 2021.
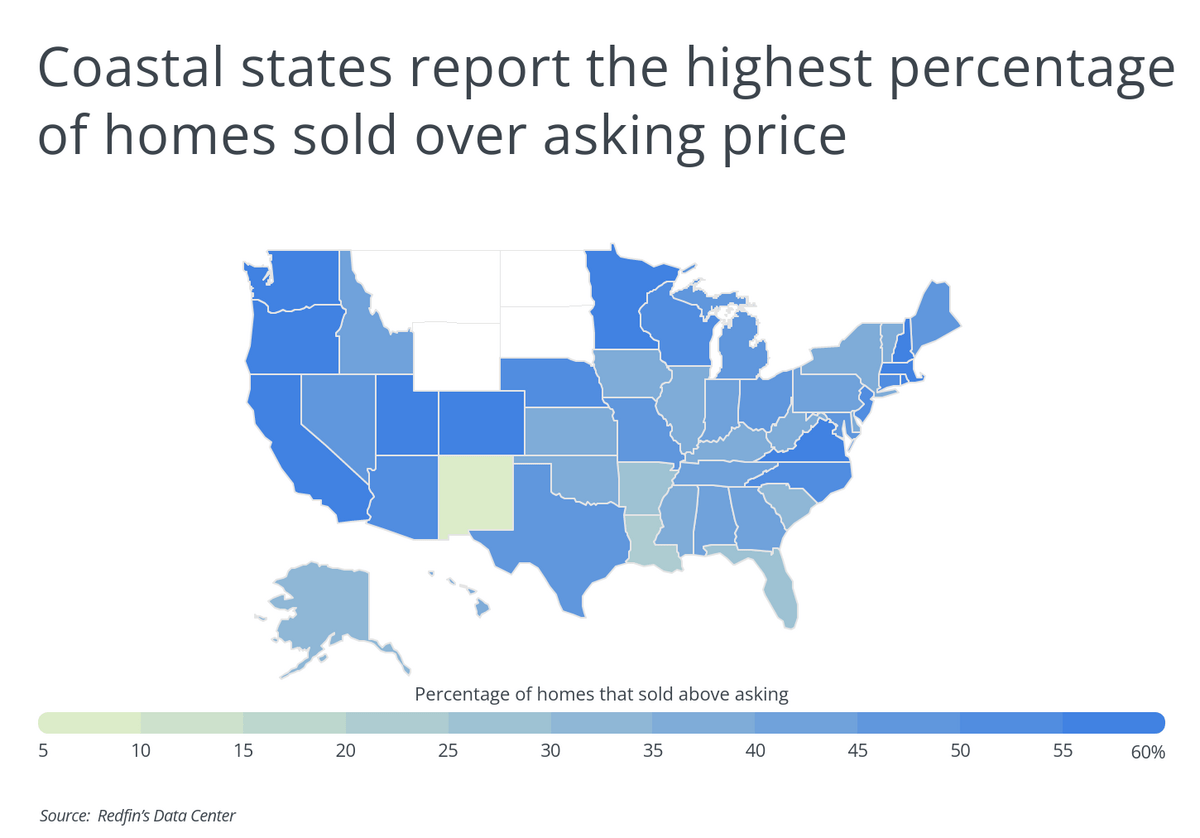
The hot real estate market is a nationwide phenomenon, but some locations are especially competitive and more likely to see sales prices exceed the asking price. In these locations, the demand issue may be felt more strongly as economic growth or migration bring more buyers into the market, some home cash buyers even, while supply constraints may be worsened by land availability and regulations on zoning and development that make it harder to build. Five states—Massachusetts, Colorado, California, New Hampshire, and Washington—have more than 60% of homes selling above asking price in 2021, and most other leading states are found on the coasts. In contrast, states in the central and southern U.S. tend to have a much lower percentage.
TRENDING
Are you thinking of pouring concrete to update your driveway? Or do you need a slab for a structure? Overall, concrete is an affordable material compared to stone or other construction materials. For your project, this is what you need to know about the cost of a concrete slab.
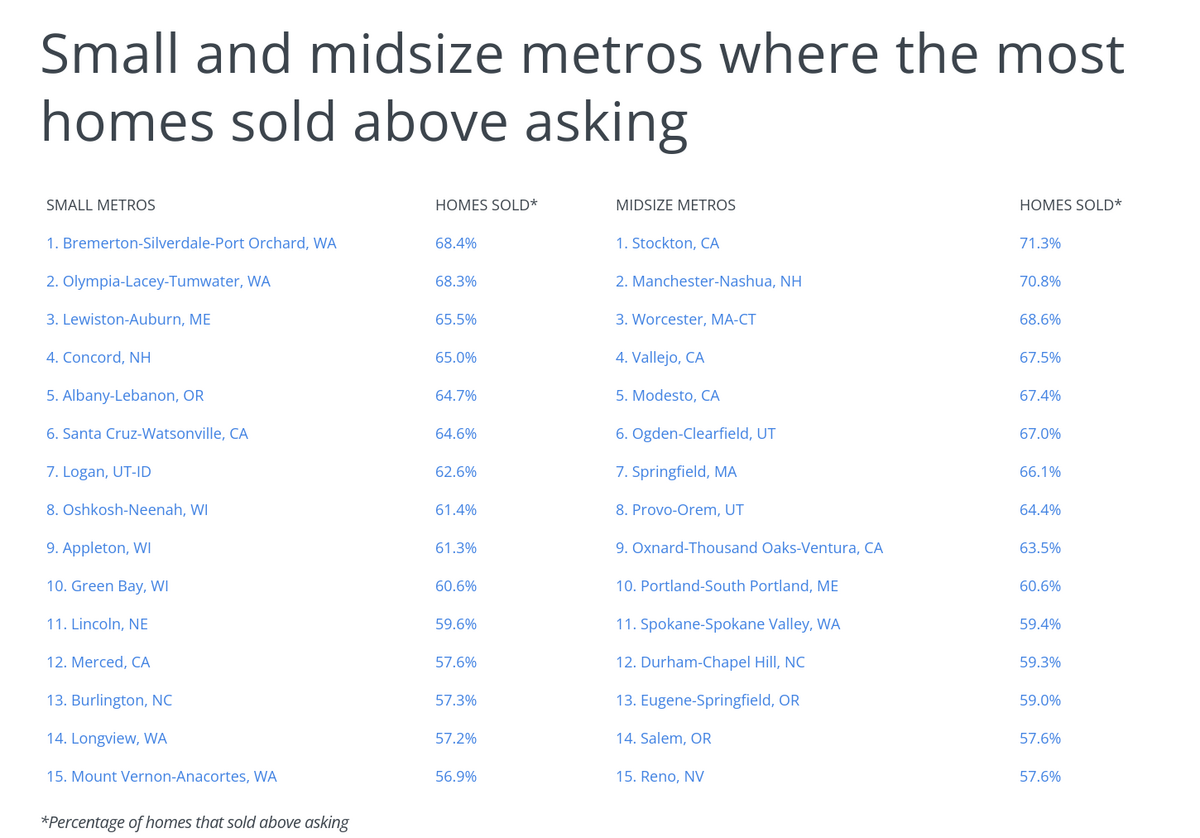
Similar patterns hold at the metro level. Many of the cities where homes are selling at high prices are found in locations where housing is in unusually high demand in the real estate market has been. Unsurprisingly, the top three large metros where homes are selling above asking are all found in California, which has some of the greatest challenges with housing of any state.
The data used in this analysis is from Redfin and the U.S. Census Bureau. To determine the locations where the most homes are selling above asking price, researchers at Porch calculated the percentage of homes that sold above asking between January 2021 and September 2021. In the event of a tie, the location with the greater average sale-to-list percentage was ranked higher. To improve relevance, only metropolitan areas with at least 100,000 residents and available data from Redfin were included.
Here are the metros where the most homes sold above asking in 2021.
Large Metros Where the Most Homes Sold Above Asking

Photo Credit: photo.ua / Shutterstock
15. Minneapolis-St. Paul-Bloomington, MN-WI
- Percentage of homes that sold above asking: 59.6%
- Average sale-to-list percentage: 102.8%
- Median days on market: 16
- Median sale price: $340,585
DID YOU KNOW?
On average, it costs homeowners about $10,750 to have new vinyl siding installed on their homes. Most homeowners will pay between $6,100 and $15,900 to cover the entire home. Here’s everything you need to know about vinyl siding installation.

Photo Credit: Sean Pavone / Shutterstock
14. Richmond, VA
- Percentage of homes that sold above asking: 60.8%
- Average sale-to-list percentage: 102.8%
- Median days on market: 9
- Median sale price: $312,114

Photo Credit: Jon Bilous / Shutterstock
13. Riverside-San Bernardino-Ontario, CA
- Percentage of homes that sold above asking: 61.1%
- Average sale-to-list percentage: 102.2%
- Median days on market: 28
- Median sale price: $491,650

Photo Credit: Bob Pool / Shutterstock
12. Portland-Vancouver-Hillsboro, OR-WA
- Percentage of homes that sold above asking: 61.1%
- Average sale-to-list percentage: 103.2%
- Median days on market: 7
- Median sale price: $497,534
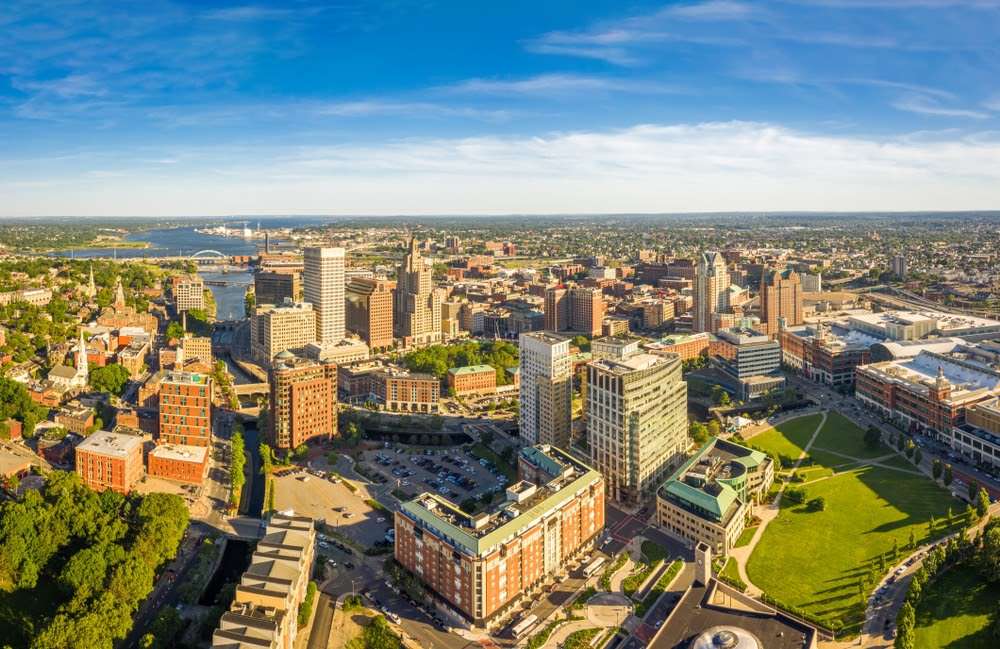
Photo Credit: Mihai_Andritoiu / Shutterstock
11. Providence-Warwick, RI-MA
- Percentage of homes that sold above asking: 61.3%
- Average sale-to-list percentage: 102.4%
- Median days on market: 25
- Median sale price: $363,560
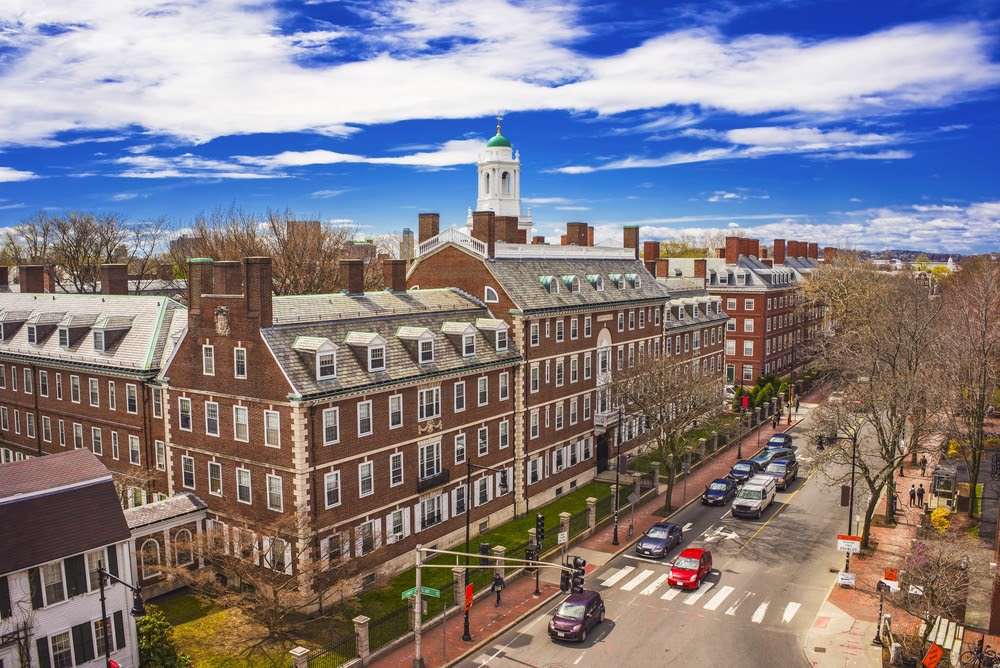
Photo Credit: Roman Babakin / Shutterstock
10. Boston-Cambridge-Newton, MA-NH
- Percentage of homes that sold above asking: 62.1%
- Average sale-to-list percentage: 103.3%
- Median days on market: 20
- Median sale price: $589,762

Photo Credit: Jeremy Janus / Shutterstock
9. Seattle-Tacoma-Bellevue, WA
- Percentage of homes that sold above asking: 63.3%
- Average sale-to-list percentage: 105.3%
- Median days on market: 6
- Median sale price: $660,383
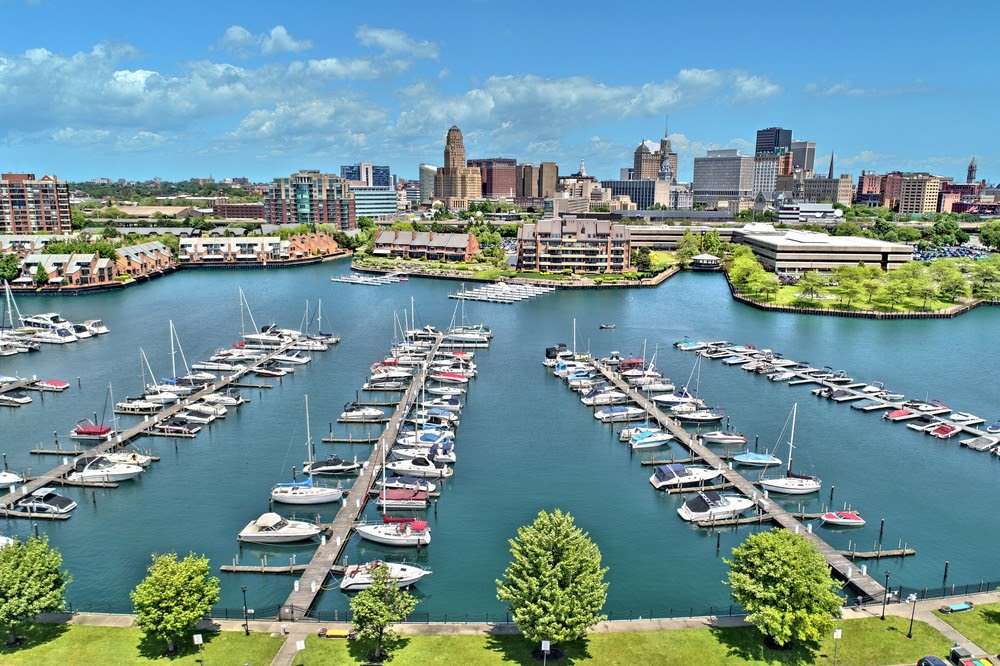
Photo Credit: Open.Tours LLC / Shutterstock
8. Buffalo-Cheektowaga, NY
- Percentage of homes that sold above asking: 63.8%
- Average sale-to-list percentage: 105.9%
- Median days on market: 11
- Median sale price: $201,151

Photo Credit: photo.ua / Shutterstock
7. Salt Lake City, UT
- Percentage of homes that sold above asking: 63.9%
- Average sale-to-list percentage: 102.9%
- Median days on market: 10
- Median sale price: $454,033

Photo Credit: Roschetzky Photography / Shutterstock
6. Austin-Round Rock-Georgetown, TX
- Percentage of homes that sold above asking: 64.1%
- Average sale-to-list percentage: 106.2%
- Median days on market: 29
- Median sale price: $452,792

Photo Credit: Roschetzky Photography / Shutterstock
5. Denver-Aurora-Lakewood, CO
- Percentage of homes that sold above asking: 65.0%
- Average sale-to-list percentage: 103.5%
- Median days on market: 6
- Median sale price: $519,201
RELATED
Carpet comes in a wide range of styles, colors, and price points. If you’re thinking about installing new carpet in your home, be sure to check out our detailed cost guide on new carpet installation.

Photo Credit: Wirestock Creators / Shutterstock
4. Rochester, NY
- Percentage of homes that sold above asking: 67.8%
- Average sale-to-list percentage: 107.1%
- Median days on market: 9
- Median sale price: $186,704

Photo Credit: Andriy Blokhin / Shutterstock
3. Sacramento-Roseville-Folsom, CA
- Percentage of homes that sold above asking: 68.3%
- Average sale-to-list percentage: 103.3%
- Median days on market: 8
- Median sale price: $535,494

Photo Credit: Pete Niesen / Shutterstock
2. San Francisco-Oakland-Berkeley, CA
- Percentage of homes that sold above asking: 74.6%
- Average sale-to-list percentage: 108.1%
- Median days on market: 13
- Median sale price: $1,127,851
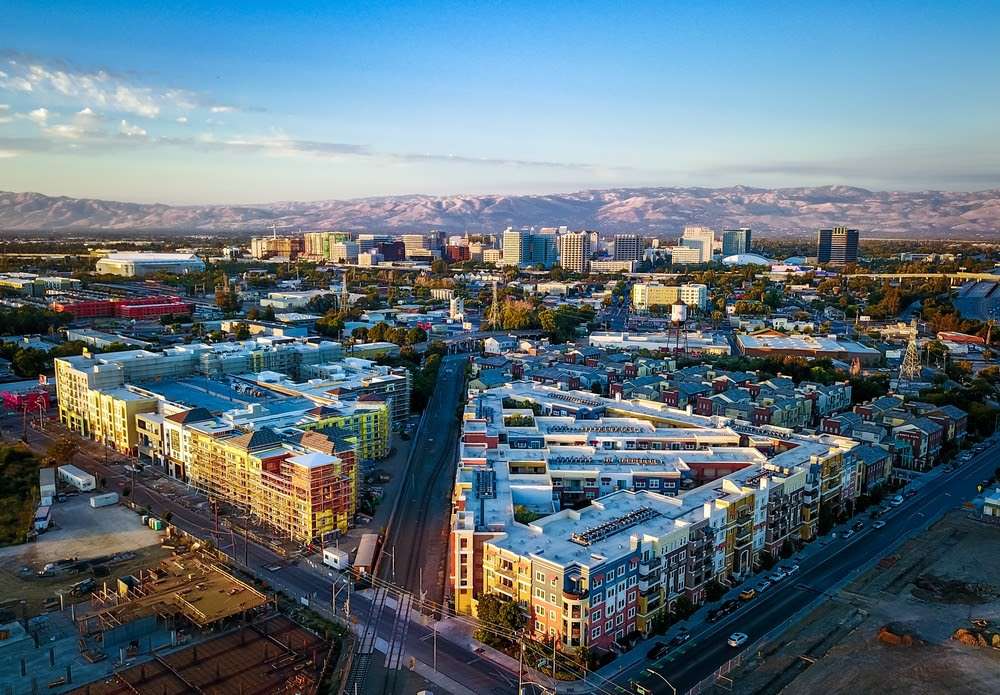
Photo Credit: Uladzik Kryhin / Shutterstock
1. San Jose-Sunnyvale-Santa Clara, CA
- Percentage of homes that sold above asking: 75.7%
- Average sale-to-list percentage: 106.6%
- Median days on market: 13
- Median sale price: $1,336,043
Detailed Findings & Methodology
The data used in this analysis is from Redfin’s Data Center and the U.S. Census Bureau’s2020 Population Estimates. To determine the locations where the most homes are selling above the asking price, researchers calculated the percentage of homes that sold above asking between January 2021 and September 2021. In the event of a tie, the location with the greater average sale-to-list percentage was ranked higher. All the fields were determined using a weighted average of the monthly data based on the number of homes sold for the specific location and time period. To improve relevance, only metropolitan areas with at least 100,000 residents were included. Additionally, metros were grouped into cohorts based on population size: small (100,000–349,999), midsize (350,000–999,999), and large (1,000,000 or more). Note, that only metropolitan statistical areas and states with complete data from Redfin were included. Find how to sell yours with these tips on how to sell your house fast.


