
Amid historically high levels of inflation, U.S. households are feeling increased financial pressure from rising costs for food, transportation, and especially housing. For many households, increases in housing costs have been particularly challenging, with the average monthly rent nationwide rising 14.1% in 2021.
Due to concerns about household economic security during the COVID-19 pandemic, policymakers have made relief for housing costs a priority in their response. Congress has allocated more than $46 billion to fund rental assistance programs over the last two years, and many states have used other state or federal dollars to provide additional support.
But needs for rental assistance have varied across the U.S., and not all renters who need assistance have been able to obtain it. As of early 2022, 16.8% of renter households reported that they were behind on rent payments, but only 12.9% of renters have applied for assistance programs and only 5% of renters have received assistance. Nearly two in five applications for assistance are denied.
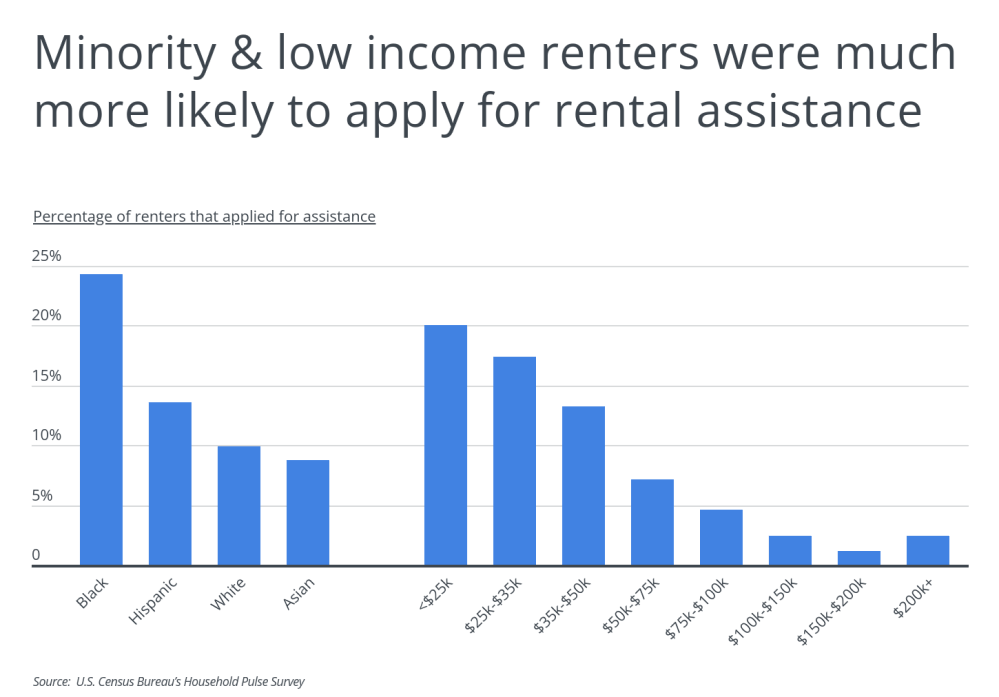
This has been particularly challenging for certain demographic and economic groups. According to survey data from the U.S. Census Bureau, renters from low-income households and racial and ethnic minorities have been most likely to seek out rental assistance. By income, 20% of renters earning less than $25,000 per year applied for rental assistance, compared to just 2.4% of those earning above $200,000 per year. And among racial and ethnic groups, Black renters were by far the most likely to apply for rental assistance at 24.3%—nearly twice as much as the next-highest group, Hispanic or Latino (13.6%), and more than 2.5 times the rate for respondents identifying as White (9.9%) and Asian (8.7%).
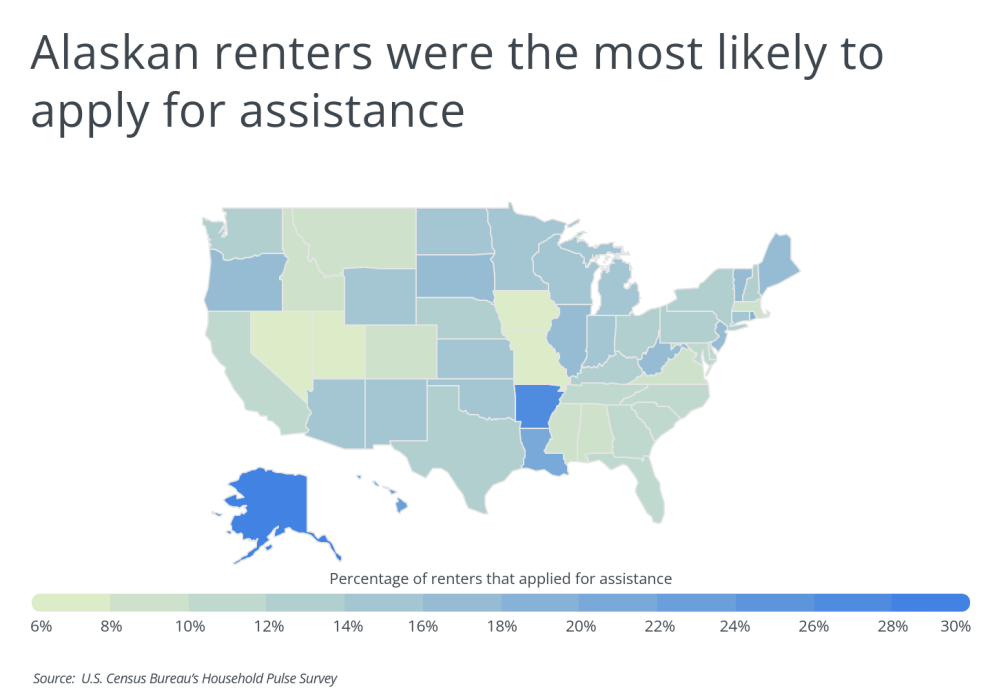
These demographic and economic factors have some impact on the locations where renters report applying for assistance. States with lower typical incomes and higher populations of racial and ethnic minorities, like Arkansas and Louisiana, are among the leading states for rental assistance applications.
But other factors are at play as well. States with higher shares of rental assistance applications like Alaska and Hawaii have higher costs of living than many other parts of the country due to their more remote locations. Residents’ difficulties affording regular expenses may have encouraged more renters to seek financial assistance in these areas. Variation in how easily or quickly states process rental assistance applications may also affect people’s likelihood of applying. Ten states approve less than half of rental assistance applications, even though some of these locations have relatively high shares of renters applying or who report being behind on rent.
DID YOU KNOW?
If you’re considering buying a home, it’s a good idea to hire a home inspector to make sure you’re making a good investment and that there are no serious issues with the home prior to buying it.
At the metro level, the picture for rental assistance is similarly complex. A mix of demographic and economic characteristics, cost of living, and approval processes is affecting how many renters are applying for and receiving rental assistance, from high-cost metros like New York and Seattle, to economically distressed locales like Detroit.
The data used in this analysis is from the U.S. Census Bureau’s Household Pulse Survey. To determine the locations where the most renters applied for assistance, researchers at Porch calculated the percentage of renters that applied for assistance between January and February of 2022. In the event of a tie, the location with the higher percentage of renters that received assistance was ranked higher. Only U.S. states and the 15 major metros with available data from the Household Pulse Survey were included in this analysis.
Here are the major metropolitan areas where the most renters applied for assistance.
Major U.S. Metros With the Most Residents in Need of Rental Assistance
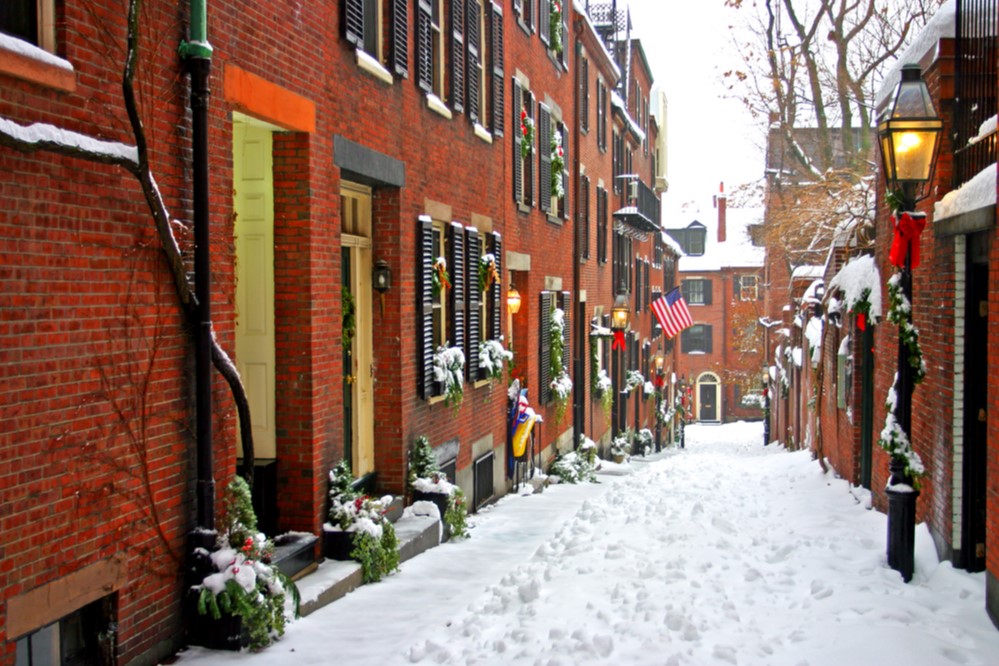
Photo Credit: CO Leong / Shutterstock
15. Boston-Cambridge-Newton, MA-NH
- Percentage of renters that applied for assistance: 7.9%
- Percentage of renters that received assistance: 1.6%
- Approval rate for rental assistance applicants: 26.5%
- Percentage of renters behind on rent: 12.2%

Photo Credit: ESB Professional / Shutterstock
14. Atlanta-Sandy Springs-Alpharetta, GA
- Percentage of renters that applied for assistance: 8.4%
- Percentage of renters that received assistance: 1.4%
- Approval rate for rental assistance applicants: 46.8%
- Percentage of renters behind on rent: 11.2%
RELATED
General contractors know the ins and outs of the home project business and will be sure to work with subcontractors they trust to get your work you need done right and on time. Find a general contractor near you to help you complete your next home project.

Photo Credit: Sean Pavone / Shutterstock
13. Phoenix-Mesa-Chandler, AZ
- Percentage of renters that applied for assistance: 8.4%
- Percentage of renters that received assistance: 3.8%
- Approval rate for rental assistance applicants: 58.9%
- Percentage of renters behind on rent: 10.8%

Photo Credit: Steve Minkler / Shutterstock
12. Riverside-San Bernardino-Ontario, CA
- Percentage of renters that applied for assistance: 8.7%
- Percentage of renters that received assistance: 2.9%
- Approval rate for rental assistance applicants: 55.4%
- Percentage of renters behind on rent: 20.1%
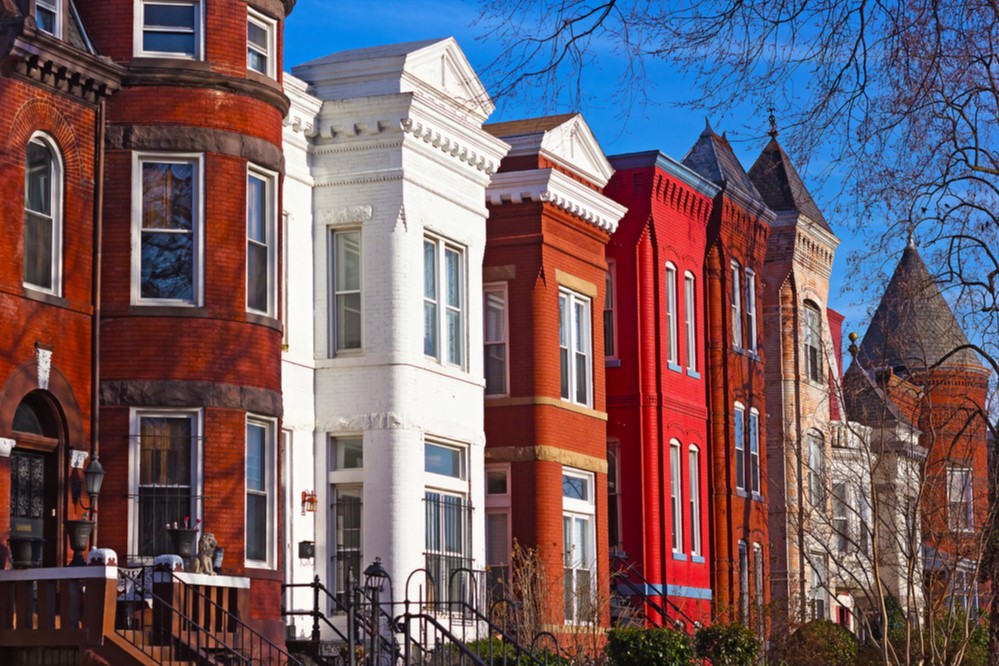
Photo Credit: Andrei Medvedev / Shutterstock
11. Washington-Arlington-Alexandria, DC-VA-MD-WV
- Percentage of renters that applied for assistance: 10.5%
- Percentage of renters that received assistance: 5.4%
- Approval rate for rental assistance applicants: 83.1%
- Percentage of renters behind on rent: 13.5%

Photo Credit: yhelfman / Shutterstock
10. San Francisco-Oakland-Berkeley, CA
- Percentage of renters that applied for assistance: 11.7%
- Percentage of renters that received assistance: 4.7%
- Approval rate for rental assistance applicants: 67.1%
- Percentage of renters behind on rent: 11.4%

Photo Credit: Sean Pavone / Shutterstock
9. Miami-Fort Lauderdale-Pompano Beach, FL
- Percentage of renters that applied for assistance: 12.0%
- Percentage of renters that received assistance: 3.1%
- Approval rate for rental assistance applicants: 38.3%
- Percentage of renters behind on rent: 18.4%

Photo Credit: Eric Urquhart / Shutterstock
8. Los Angeles-Long Beach-Anaheim, CA
- Percentage of renters that applied for assistance: 12.1%
- Percentage of renters that received assistance: 5.1%
- Approval rate for rental assistance applicants: 63.2%
- Percentage of renters behind on rent: 16.0%

Photo Credit: ESB Professional / Shutterstock
7. Seattle-Tacoma-Bellevue, WA
- Percentage of renters that applied for assistance: 12.2%
- Percentage of renters that received assistance: 3.2%
- Approval rate for rental assistance applicants: 47.7%
- Percentage of renters behind on rent: 15.2%

Photo Credit: Sean Pavone / Shutterstock
6. Philadelphia-Camden-Wilmington, PA-NJ-DE-MD
- Percentage of renters that applied for assistance: 13.3%
- Percentage of renters that received assistance: 2.8%
- Approval rate for rental assistance applicants: 45.3%
- Percentage of renters behind on rent: 17.1%
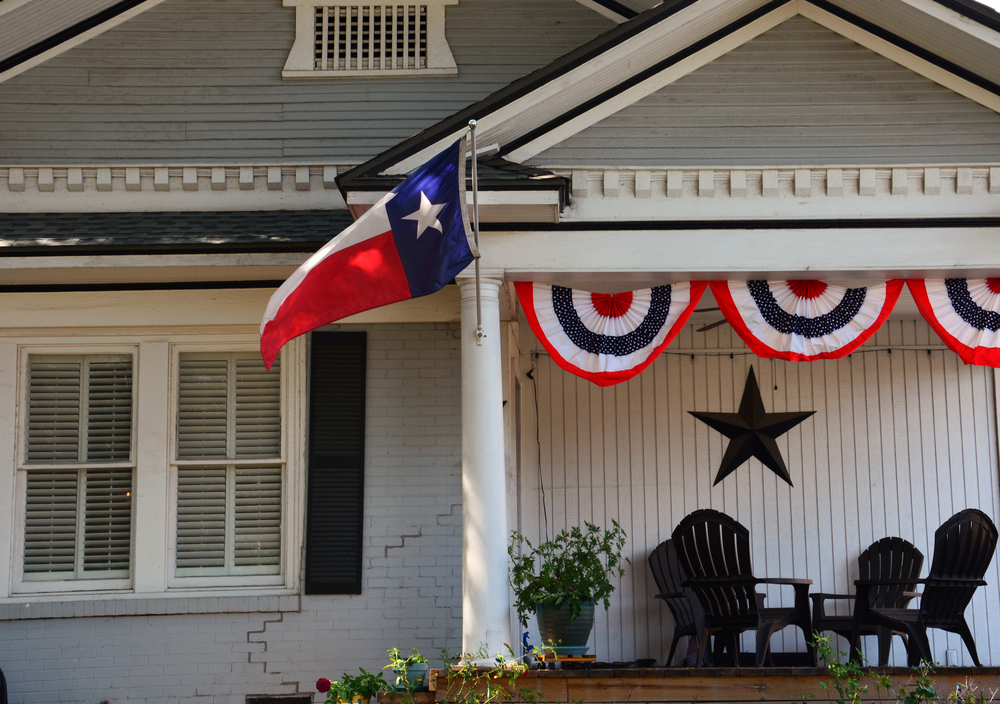
Photo Credit: D Guest Smith / Shutterstock
5. Dallas-Fort Worth-Arlington, TX
- Percentage of renters that applied for assistance: 14.9%
- Percentage of renters that received assistance: 5.4%
- Approval rate for rental assistance applicants: 65.1%
- Percentage of renters behind on rent: 11.8%

Photo Credit: Tomas Simkus / Shutterstock
4. Houston-The Woodlands-Sugar Land, TX
- Percentage of renters that applied for assistance: 16.0%
- Percentage of renters that received assistance: 2.3%
- Approval rate for rental assistance applicants: 22.4%
- Percentage of renters behind on rent: 21.5%
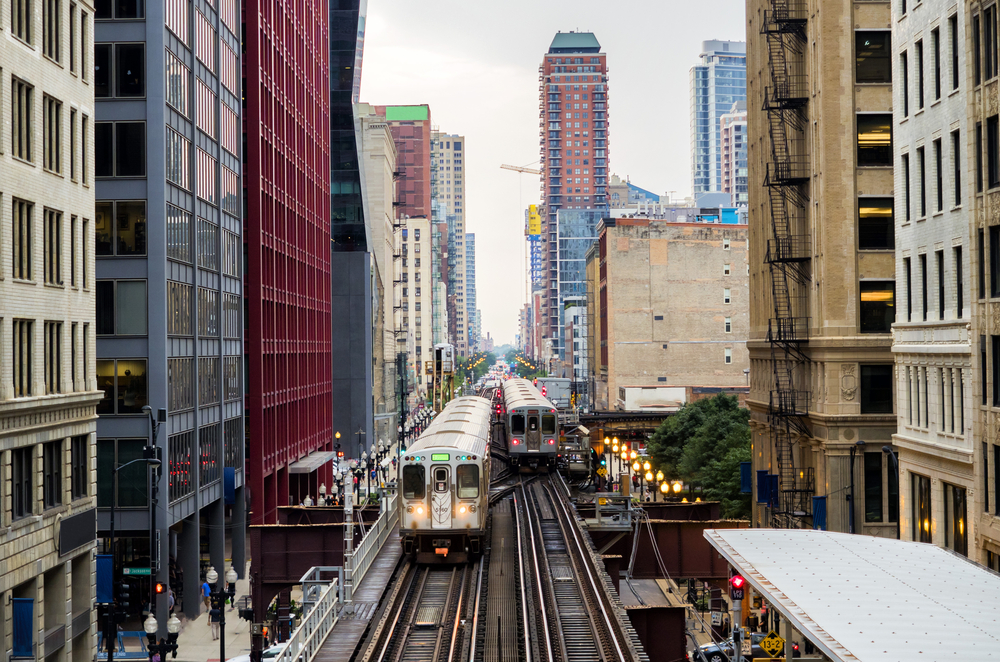
Photo Credit: wonderlustpicstravel / Shutterstock
3. Chicago-Naperville-Elgin, IL-IN-WI
- Percentage of renters that applied for assistance: 16.4%
- Percentage of renters that received assistance: 8.8%
- Approval rate for rental assistance applicants: 86.4%
- Percentage of renters behind on rent: 21.9%
TRENDING
If you don’t have hot water in your house, you may want to look into how much it will cost to repair or replace your water heater. A plumber will certainly be able to resolve the issue, and we can connect you with the best plumbers in your area.

Photo Credit: William Perugini / Shutterstock
2. New York-Newark-Jersey City, NY-NJ-PA
- Percentage of renters that applied for assistance: 17.2%
- Percentage of renters that received assistance: 5.9%
- Approval rate for rental assistance applicants: 57.7%
- Percentage of renters behind on rent: 29.3%

Photo Credit: Mrbrown928 / Shutterstock
1. Detroit-Warren-Dearborn, MI
- Percentage of renters that applied for assistance: 19.0%
- Percentage of renters that received assistance: 10.2%
- Approval rate for rental assistance applicants: 81.1%
- Percentage of renters behind on rent: 25.8%
Detailed Findings & Methodology
The data used in this analysis is from the U.S. Census Bureau’s Household Pulse Survey. To determine the locations where the most renters applied for assistance, researchers calculated the percentage of renters that applied for assistance between January and February of 2022. In the event of a tie, the location with the higher percentage of renters that received assistance was ranked higher. Only U.S. states and the 15 major metros with available data from the Household Pulse Survey were included in this analysis.


