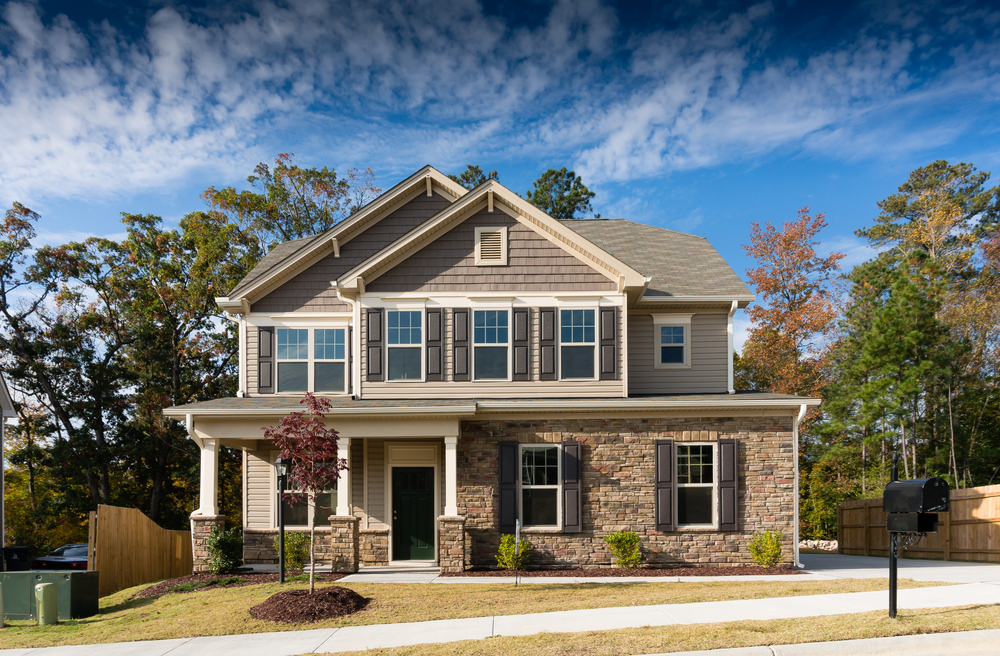
Even two years into the COVID-19 pandemic, Americans are finding that buying a home remains challenging. A growing work-from-home economy, fueled by households with newfound financial liquidity, has boosted the nation’s demand for homes. Meanwhile, a housing construction industry weakened by the COVID-19 pandemic has allowed the national housing stock to dwindle. Existing houses are selling faster and at record prices, with some states and metro areas being hit harder than others.
The personal savings rate—a measure of people’s income left over after regular spending and taxes—increased by 155% from January 2020 to January 2021 during the COVID-19 pandemic. Over the same period, more than a third of households reported an increase in time spent working from home. The combination spurred American families to relocate, raising total demand for homes across the nation.
However, labor restrictions and supply chain bottlenecks in construction materials during the pandemic reduced single-family housing starts sharply during the spring and summer of 2020. New home construction didn’t regain its previous pace until later that fall; however, ongoing supply chain challenges have continued to impact housing completions, decreasing the nation’s supply of available homes for sale.
The nation’s available housing stock, which is measured by the number of months it would take for current inventory to sell, fell from a 2.6 month supply in the summer of 2021 to just a 1.6 month supply at the beginning of 2022. In large part because of this, the U.S. Home Price Index increased roughly 30% from January 2020 to the end of 2021.
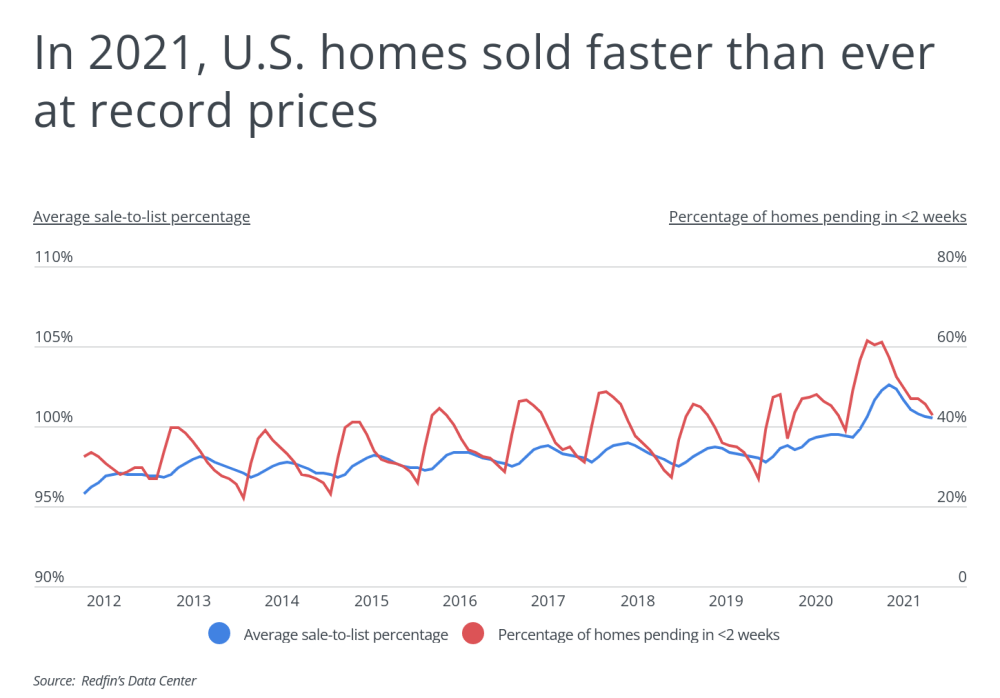
The total quantity of home purchases in the economy oscillates seasonally, fading each fall and booming each spring as families tend to move during the school breaks of summer. However, the overall trend reveals that when robust housing demand meets anemic housing supply, homes tend to sell faster and at a higher selling price—often higher than the asking price.
To illustrate, in 2019, the year prior to the pandemic, just over 37% of all homes listed for sale that year were sold in less than two weeks after listing. That proportion increased to over 52% in 2021. Further, the national sale-to-list price ratio rose each year, exceeding 100% for the first time in 2021. Today, the average American home sells above its asking price.
Examining state level data reveals that those with higher prices largely faced disproportionate competition for homes last year. In 2021, the average sale-to-list price percentage in each state was positively correlated with that state’s median home price. In less expensive Southern and Midwest states, sales prices remained at or a few percentage points below list prices. However, Rocky Mountain, New England, and West Coast states tended to experience average sale prices that were 2–3% above asking.

TRENDING
Purchasing a home is one of the biggest financial commitments many people make over the course of their lives. A home inspector can assess the less obvious details of a home, including the state of the HVAC system, attic insulation, plumbing, and electrical systems. And finding a home inspector is as easy as punching in your zip code with Porch.
The data used in this analysis is from Redfin. To determine the locations where homes are selling most above asking, researchers at Porch calculated the average sale-to-list percentage for 2021. In the event of a tie, the location with the higher percentage of homes that sold above asking was ranked higher. Researchers also included the percentage of home selling in less than two weeks, the median sale price, and the year-over-year change in price.
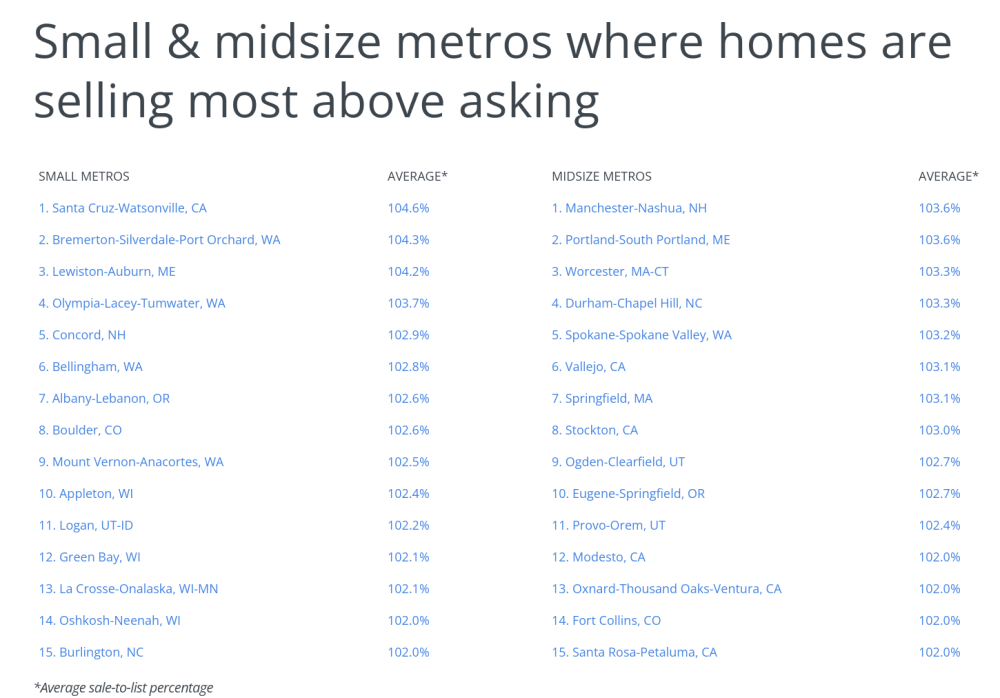
Here are the metropolitan areas where homes are selling the greatest amount over asking price.
Large Metros Where Homes Are Selling Most Above Asking
 Photo Credit: Sean Pavone / Shutterstock
15. Los Angeles-Long Beach-Anaheim, CA
- Average sale-to-list percentage: 102.4%
- Percentage of homes that sold above asking: 59.7%
- Percentage of homes pending in <2 weeks: 32.7%
- Median sale price: $830,269
- YoY change in median sale price: +15.7%
RELATED
Do you need electrical work done on your home? Don’t try to sort that mess out yourself. We have customer reviews and detailed cost estimates for the best local electricians, wherever you live.
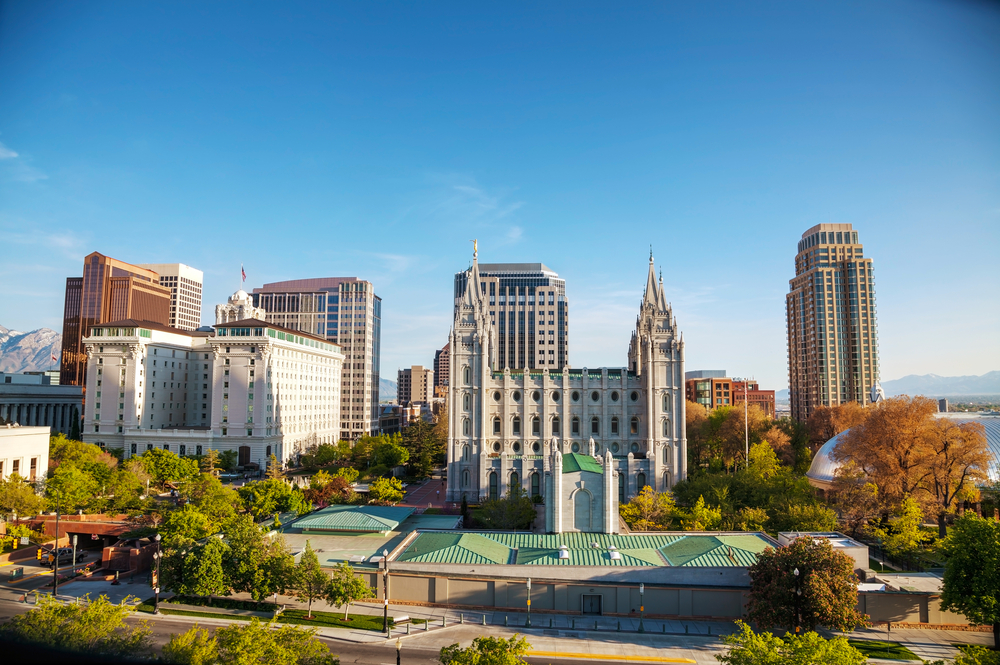
Photo Credit: photo.ua / Shutterstock
14. Salt Lake City, UT
- Average sale-to-list percentage: 102.4%
- Percentage of homes that sold above asking: 60.2%
- Percentage of homes pending in <2 weeks: 61.5%
- Median sale price: $460,034
- YoY change in median sale price: +22.8%

Photo Credit: Sean Pavone / Shutterstock
13. Richmond, VA
- Average sale-to-list percentage: 102.5%
- Percentage of homes that sold above asking: 59.1%
- Percentage of homes pending in <2 weeks: 66.4%
- Median sale price: $313,341
- YoY change in median sale price: +11.4%

Photo Credit: Bob Pool / Shutterstock
12. Portland-Vancouver-Hillsboro, OR-WA
- Average sale-to-list percentage: 102.7%
- Percentage of homes that sold above asking: 58.5%
- Percentage of homes pending in <2 weeks: 70.0%
- Median sale price: $501,221
- YoY change in median sale price: +15.2%
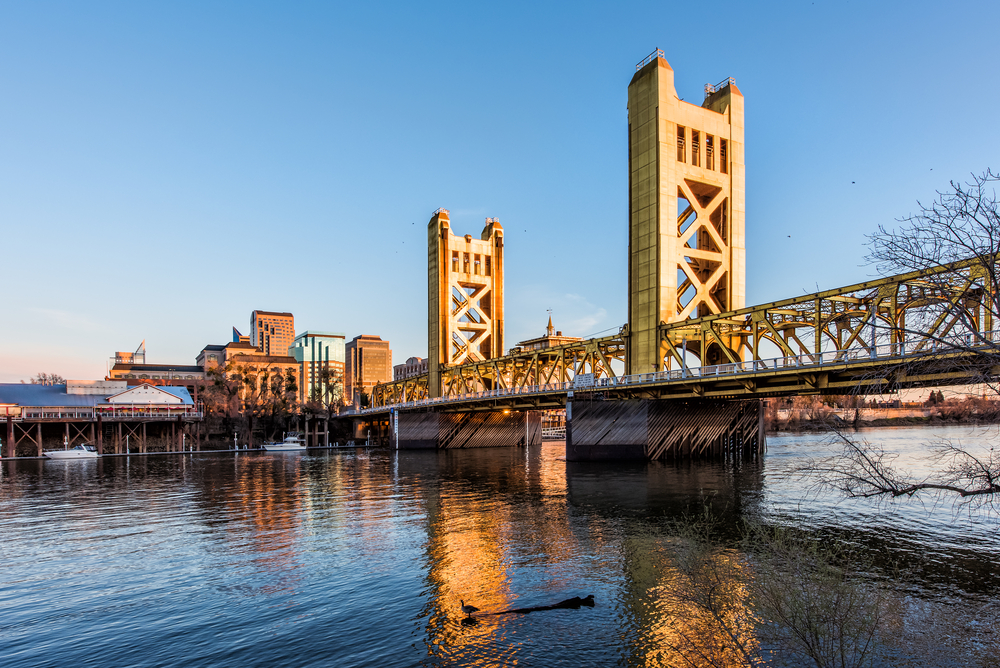
Photo Credit: Andriy Blokhin / Shutterstock
11. Sacramento-Roseville-Folsom, CA
- Average sale-to-list percentage: 102.8%
- Percentage of homes that sold above asking: 66.1%
- Percentage of homes pending in <2 weeks: 66.9%
- Median sale price: $537,479
- YoY change in median sale price: +18.7%

Photo Credit: Travellaggio / Shutterstock
10. Boston-Cambridge-Newton, MA-NH
- Average sale-to-list percentage: 103.0%
- Percentage of homes that sold above asking: 60.9%
- Percentage of homes pending in <2 weeks: 38.5%
- Median sale price: $587,553
- YoY change in median sale price: +12.6%

Photo Credit: Nicholas Courtney / Shutterstock
9. Denver-Aurora-Lakewood, CO
- Average sale-to-list percentage: 103.0%
- Percentage of homes that sold above asking: 62.2%
- Percentage of homes pending in <2 weeks: 75.9%
- Median sale price: $523,670
- YoY change in median sale price: +16.9%
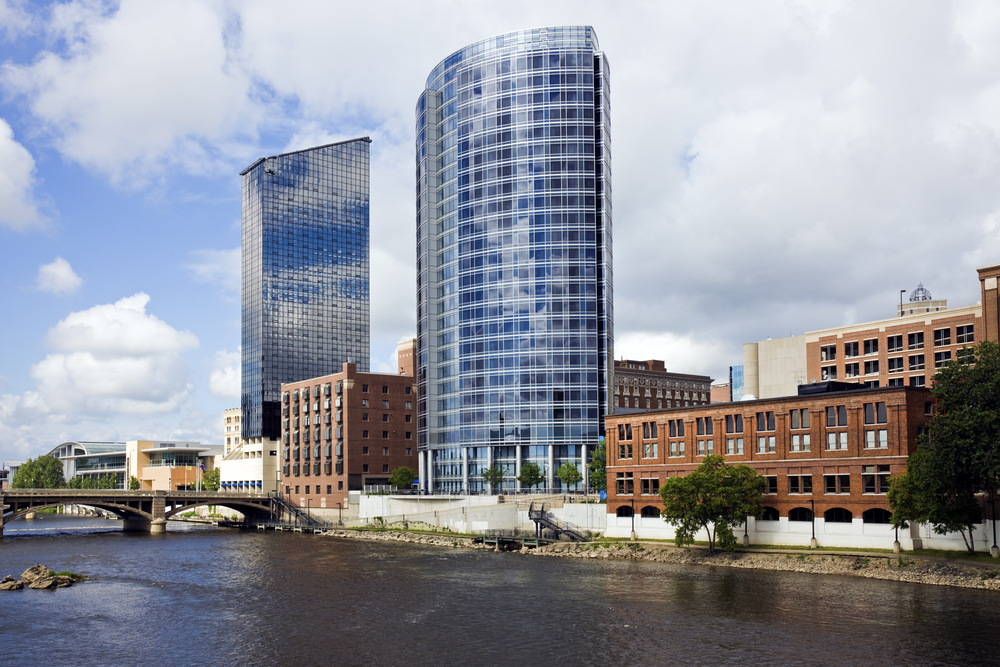
Photo Credit: Henryk Sadura / Shutterstock
8. Grand Rapids-Kentwood, MI
- Average sale-to-list percentage: 103.2%
- Percentage of homes that sold above asking: 57.3%
- Percentage of homes pending in <2 weeks: 75.0%
- Median sale price: $263,861
- YoY change in median sale price: +15.0%

Photo Credit: Farid Sani / Shutterstock
7. Raleigh-Cary, NC
- Average sale-to-list percentage: 103.2%
- Percentage of homes that sold above asking: 59.0%
- Percentage of homes pending in <2 weeks: 40.2%
- Median sale price: $366,666
- YoY change in median sale price: +18.2%

Photo Credit: Checubus / Shutterstock
6. Seattle-Tacoma-Bellevue, WA
- Average sale-to-list percentage: 104.9%
- Percentage of homes that sold above asking: 61.3%
- Percentage of homes pending in <2 weeks: 78.8%
- Median sale price: $662,238
- YoY change in median sale price: +17.7%

Photo Credit: Sean Pavone / Shutterstock
5. Austin-Round Rock-Georgetown, TX
- Average sale-to-list percentage: 105.1%
- Percentage of homes that sold above asking: 60.2%
- Percentage of homes pending in <2 weeks: 39.8%
- Median sale price: $458,176
- YoY change in median sale price: +32.1%
TRENDING
A plumber will have the skills and tools to repair or replace sewage pipes that are cracked or clogged, and they can handle water heater repairs or replacements, dishwasher jobs, and garbage disposal problems as well. Find out how much it would cost to hire a plumber in your area.

Photo Credit: Open.Tours_LLC / Shutterstock
4. Buffalo-Cheektowaga, NY
- Average sale-to-list percentage: 105.8%
- Percentage of homes that sold above asking: 64.1%
- Percentage of homes pending in <2 weeks: 66.3%
- Median sale price: $203,984
- YoY change in median sale price: +16.5%
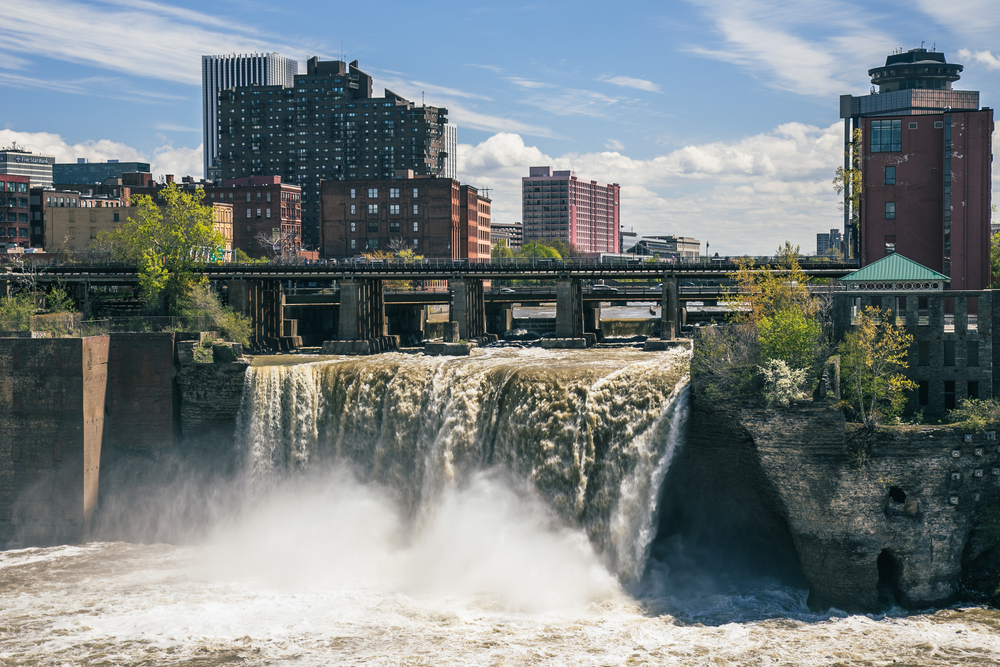
Photo Credit: Wirestock Creators / Shutterstock
3. Rochester, NY
- Average sale-to-list percentage: 106.7%
- Percentage of homes that sold above asking: 66.9%
- Percentage of homes pending in <2 weeks: 71.1%
- Median sale price: $185,509
- YoY change in median sale price: +12.2%

Photo Credit: Sundry Photography / Shutterstock
2. San Jose-Sunnyvale-Santa Clara, CA
- Average sale-to-list percentage: 106.8%
- Percentage of homes that sold above asking: 75.7%
- Percentage of homes pending in <2 weeks: 61.2%
- Median sale price: $1,344,928
- YoY change in median sale price: +13.3%
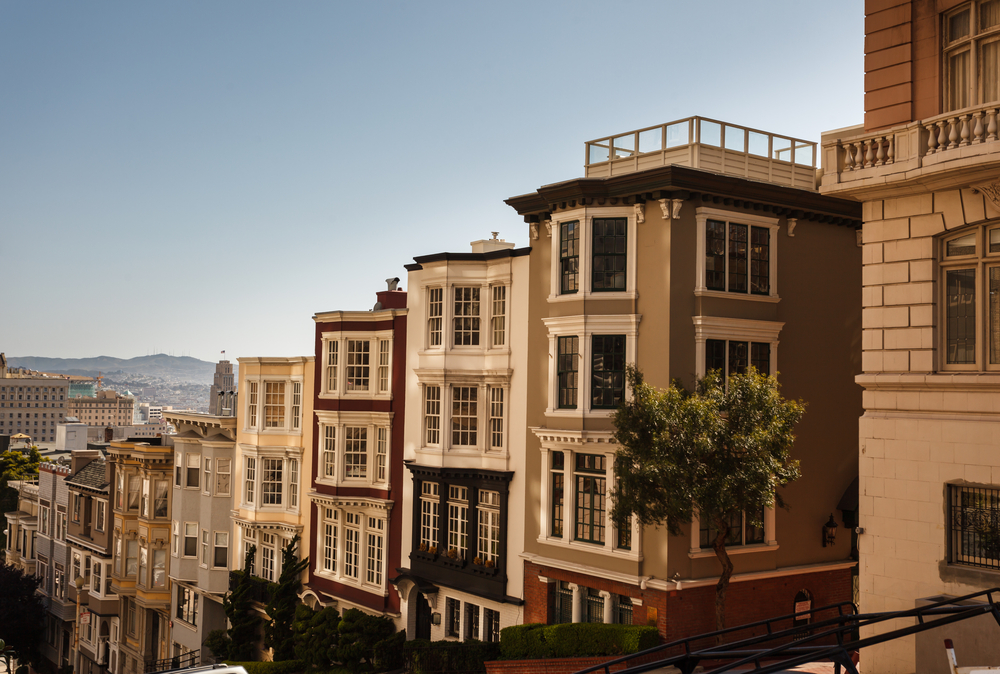
Photo Credit: Pete Niesen / Shutterstock
1. San Francisco-Oakland-Berkeley, CA
- Average sale-to-list percentage: 107.9%
- Percentage of homes that sold above asking: 74.2%
- Percentage of homes pending in <2 weeks: 63.9%
- Median sale price: $1,125,602
- YoY change in median sale price: +12.3%
Detailed Findings & Methodology
The data used in this analysis is from Redfin. To determine the locations where homes are selling most above asking, researchers calculated the average sale-to-list percentage for 2021. In the event of a tie, the location with the higher percentage of homes that sold above asking was ranked higher. All the fields were determined using a weighted average of the monthly data based on the number of homes sold for the specific location and time period. To improve relevance, only locations with at least 100,000 residents and complete data from Redfin were included. Additionally, metros were grouped into cohorts based on population size: small (100,000–349,999), midsize (350,000–999,999), and large (1,000,000 or more).


