With less natural population growth and decreased immigration, the population of the United States has been growing more slowly every year since 2015, according to new Census Bureau estimates. In fact, the 0.35% growth rate between 2019 and 2020 represents the lowest growth rate in more than a century.
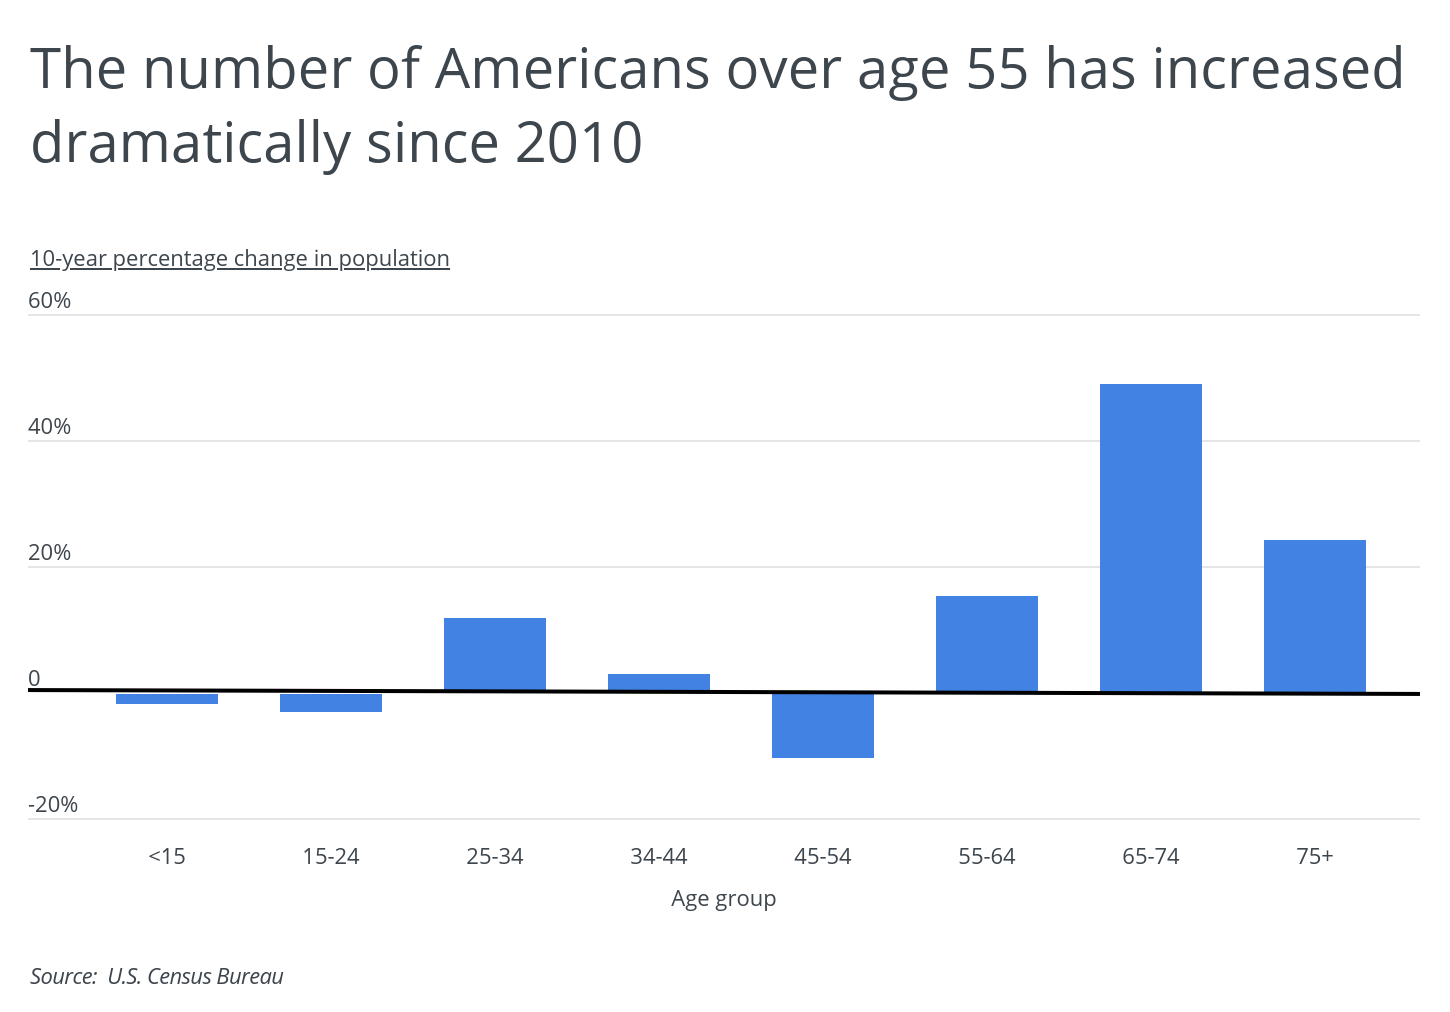
America is now an aging nation, as the age brackets for residents 55 and older are expanding at a pace that far exceeds the younger brackets. Over the past decade, the population of retirement-age residents (65 to 74 years old) soared 48.9% according to Census figures, while those 75 or older grew 24.1%, and those 55 to 64 increased 15.3%. In comparison, the total U.S. population increased by just 6.5% over the same time period, with certain age cohorts experiencing a population decline.
Such dramatic demographic shifts have reshaped the makeup of entire regions, states, and cities as the eldest generation increasingly moves from traditional job havens across the Rust Belt and Northeast to more retirement-friendly locales in the West, Southwest, and Southeast. The growth in housing units over the last 10 years exploded in states like North Dakota (thanks also to the fracking boom), Utah, Idaho, and Texas—all of which reported a roughly 15% or more increase in residential units, according to Census data. New home construction has also been a hot trend in Washington, the Carolinas, South Dakota, and Nevada.

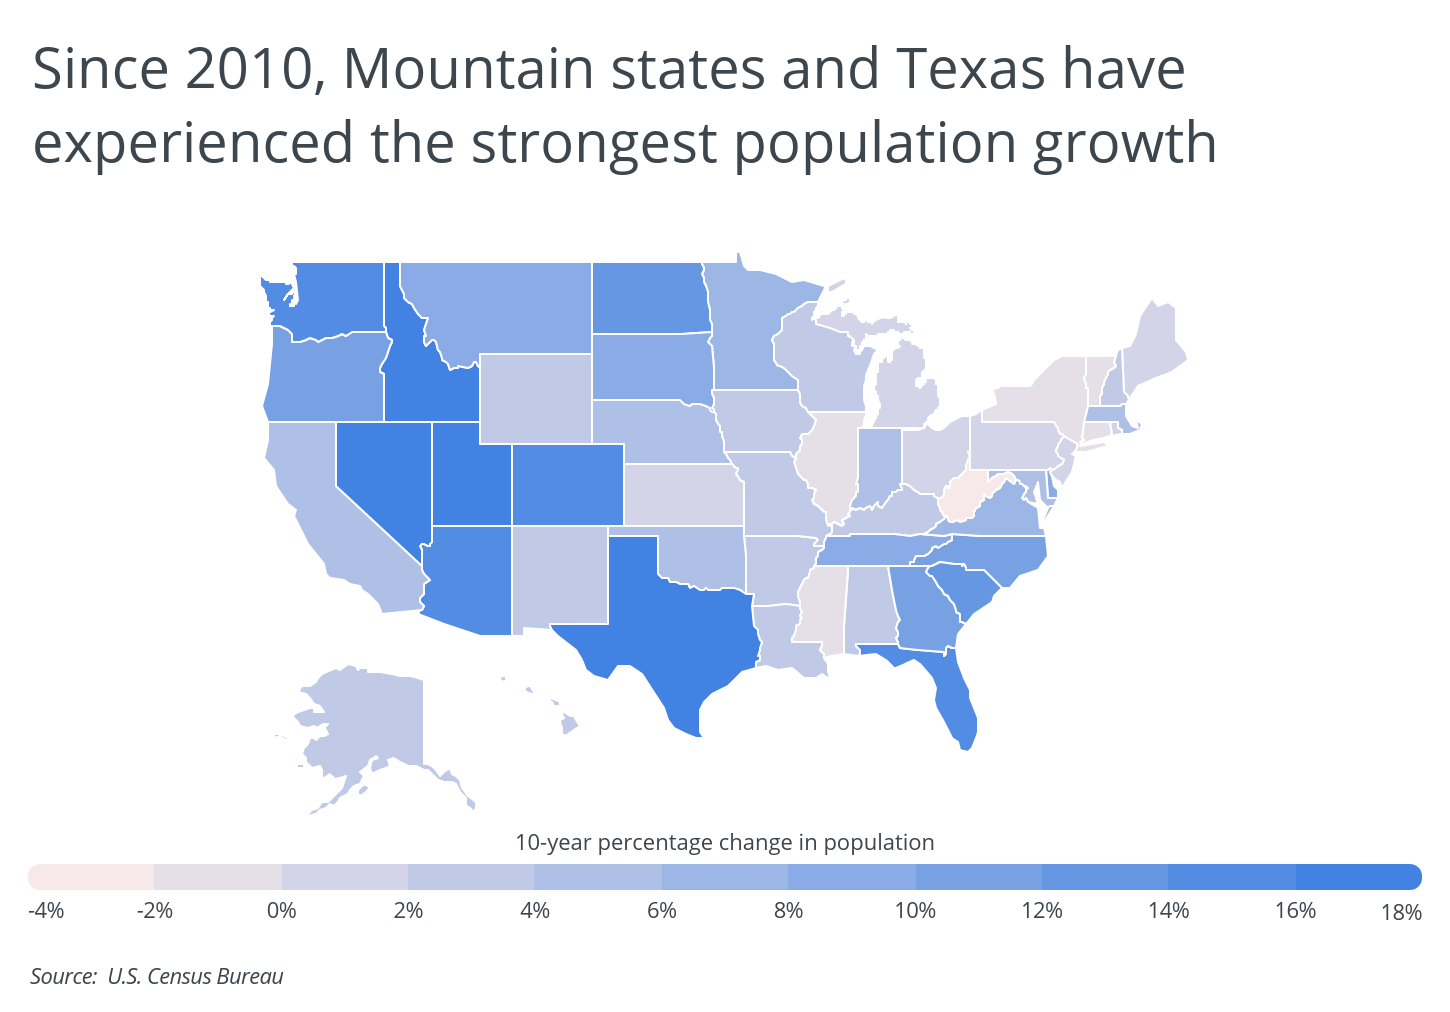
When it comes to population growth, though, the Southwest is the clearest beneficiary of America’s changing demographics. While West Virginia, Illinois, New York, and a few New England states actually shrunk over the last decade, nearly all states between Washington and Texas expanded significantly. Utah led the way at 17.1% population growth between 2010 and 2020, followed by Texas (16.3%), Idaho (16.3%), Nevada (16.1%), Arizona (15.8%), Florida (15.3%), and Colorado (15.1%). Among the most-cited reasons for migration to these states are a lower cost of living and more favorable business conditions. The interior western states have also gained from residents moving out of California.
To see how these trends have affected specific cities across the country, researchers at Porch looked at three classes of city sizes and calculated the difference between their 2010 and 2020 populations as reported by the U.S. Census Bureau. For the purposes of this analysis, only cities with at least 100,000 residents in 2020 were included.
Similar to state-level trends, Texas, Colorado, Arizona, North Carolina, and Florida are all well-represented. Texas holds two of the three fastest-growing large cities, as well as the top two midsize cities and seven of the top 10 small cities. Dallas suburb Frisco easily led the nation with a growth rate of more than 77%, thanks to a low cost of living, plenty of job opportunities, and brand new infrastructure.
Here are the cities with the most population growth over the past decade.

Large Cities With the Most Population Growth Since 2010

Photo Credit: Alamy Stock Photo
15. Colorado Springs, CO
- 10-year percentage change in population: 14.60%
- 10-year total population change: 61,405
- Population 2020: 482,131
- Population 2010: 420,726

Photo Credit: Alamy Stock Photo
14. Raleigh, NC
- 10-year percentage change in population: 16.73%
- 10-year total population change: 68,002
- Population 2020: 474,414
- Population 2010: 406,412
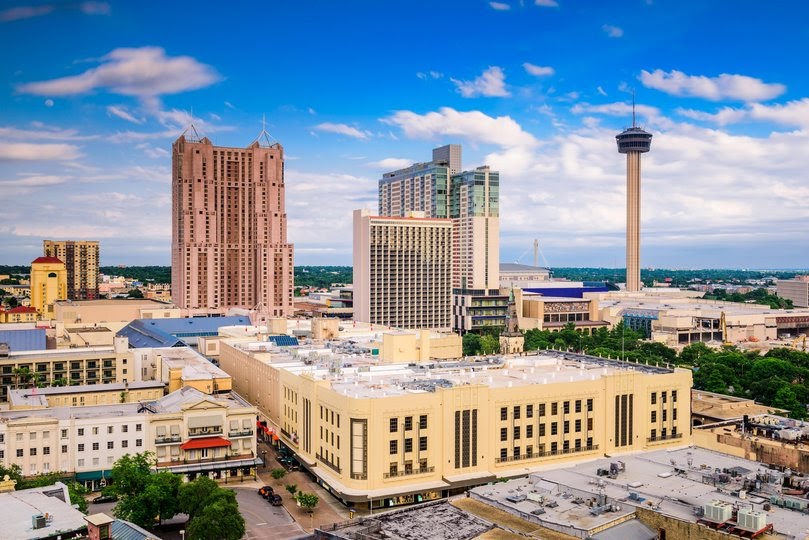
Photo Credit: Alamy Stock Photo
13. San Antonio, TX
- 10-year percentage change in population: 17.57%
- 10-year total population change: 234,152
- Population 2020: 1,567,118
- Population 2010: 1,332,966
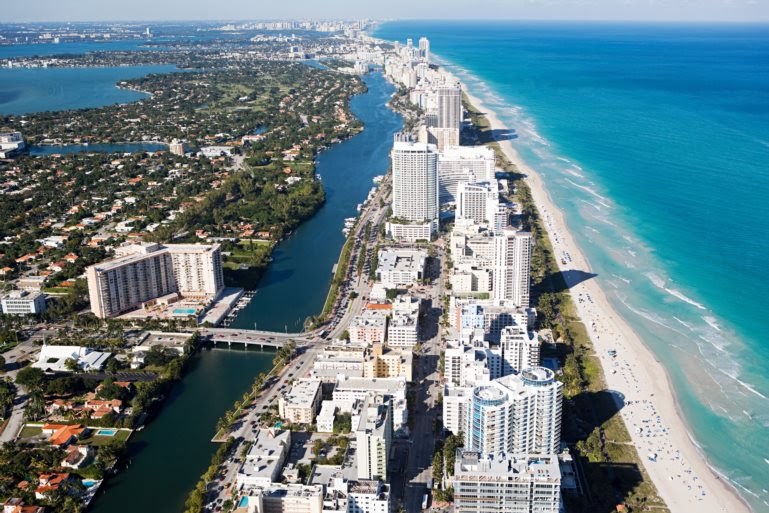
Photo Credit: Alamy Stock Photo
12. Miami, FL
- 10-year percentage change in population: 17.65%
- 10-year total population change: 70,727
- Population 2020: 471,525
- Population 2010: 400,798

Photo Credit: Alamy Stock Photo
11. Washington, DC
- 10-year percentage change in population: 17.77%
- 10-year total population change: 107,534
- Population 2020: 712,816
- Population 2010: 605,282
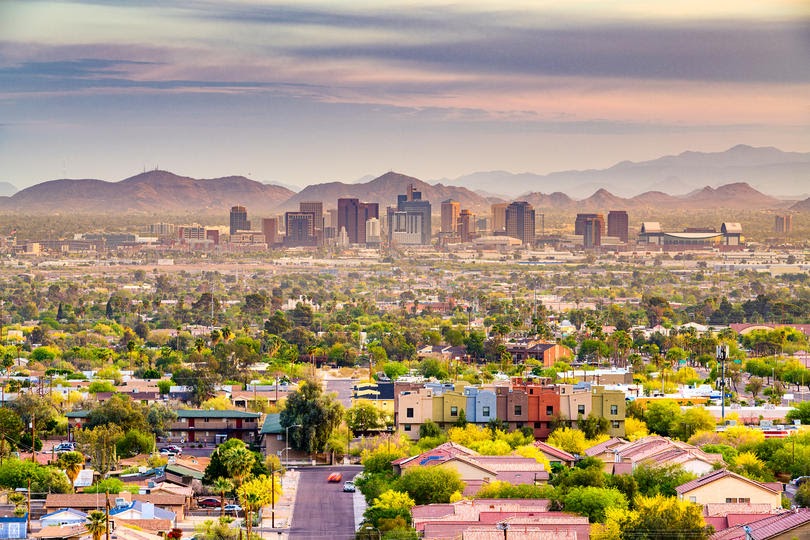
Photo Credit: Alamy Stock Photo
10. Phoenix, AZ
- 10-year percentage change in population: 17.88%
- 10-year total population change: 259,129
- Population 2020: 1,708,127
- Population 2010: 1,448,998

Photo Credit: Alamy Stock Photo
9. Aurora, CO
- 10-year percentage change in population: 18.14%
- 10-year total population change: 59,493
- Population 2020: 387,377
- Population 2010: 327,884

Photo Credit: Alamy Stock Photo
8. Atlanta, GA
- 10-year percentage change in population: 19.36%
- 10-year total population change: 83,136
- Population 2020: 512,550
- Population 2010: 429,414

Photo Credit: Alamy Stock Photo
7. Mesa, AZ
- 10-year percentage change in population: 19.81%
- 10-year total population change: 87,326
- Population 2020: 528,159
- Population 2010: 440,833

Photo Credit: Alamy Stock Photo
6. Tampa, FL
- 10-year percentage change in population: 20.89%
- 10-year total population change: 70,443
- Population 2020: 407,599
- Population 2010: 337,156

Photo Credit: Alamy Stock Photo
5. Charlotte, NC
- 10-year percentage change in population: 21.92%
- 10-year total population change: 161,904
- Population 2020: 900,350
- Population 2010: 738,446

Photo Credit: Alamy Stock Photo
4. Denver, CO
- 10-year percentage change in population: 21.98%
- 10-year total population change: 132,526
- Population 2020: 735,538
- Population 2010: 603,012

Photo Credit: Alamy Stock Photo
3. Austin, TX
- 10-year percentage change in population: 23.48%
- 10-year total population change: 189,270
- Population 2020: 995,484
- Population 2010: 806,214

Photo Credit: Alamy Stock Photo
2. Fort Worth, TX
- 10-year percentage change in population: 23.96%
- 10-year total population change: 179,301
- Population 2020: 927,720
- Population 2010: 748,419

Photo Credit: Alamy Stock Photo
1. Seattle, WA
- 10-year percentage change in population: 26.05%
- 10-year total population change: 159,060
- Population 2020: 769,714
- Population 2010: 610,654
Detailed Findings & Methodology
Population and housing data is from the U.S. Census Bureau’s 2020 Population Estimates Program. To identify which cities grew the most over the past decade, researchers calculated the percentage change in population between 2010 and 2020. All cities present in the 2020 Census with at least 100,000 people were included in the analysis. Additionally, to improve relevance, cities were grouped into cohorts based on population size: small (100,000–149,999), midsize (150,000–349,999), and large (350,000 or more).


