
In May 2021, the National Oceanic and Atmospheric Administration (NOAA) released their decennial U.S. Climate Normals data, which provides data on typical climate conditions for locations all over the U.S. The conclusions of the data are clear: in recent years, much of the United States has grown both warmer and wetter on average.
These findings are unsurprising at this point, based on what we know about the long-running trend of climate change. Increased emissions of greenhouse gases like carbon dioxide through the use of fossil fuels have caused earth’s atmosphere to retain more heat, and warmer air is often wetter air: for each degree of warming, the air’s capacity to hold water vapor increases by about 7%.
Together, warmer and wetter air produce more extreme weather events. 2019 was the wettest year in the U.S. since 1973 and saw 14 weather and climate disasters that had losses exceeding $1 billion each. In 2020, that number grew to 22—a new record, topping the previous record of 16 set in 2011 and tied in 2017.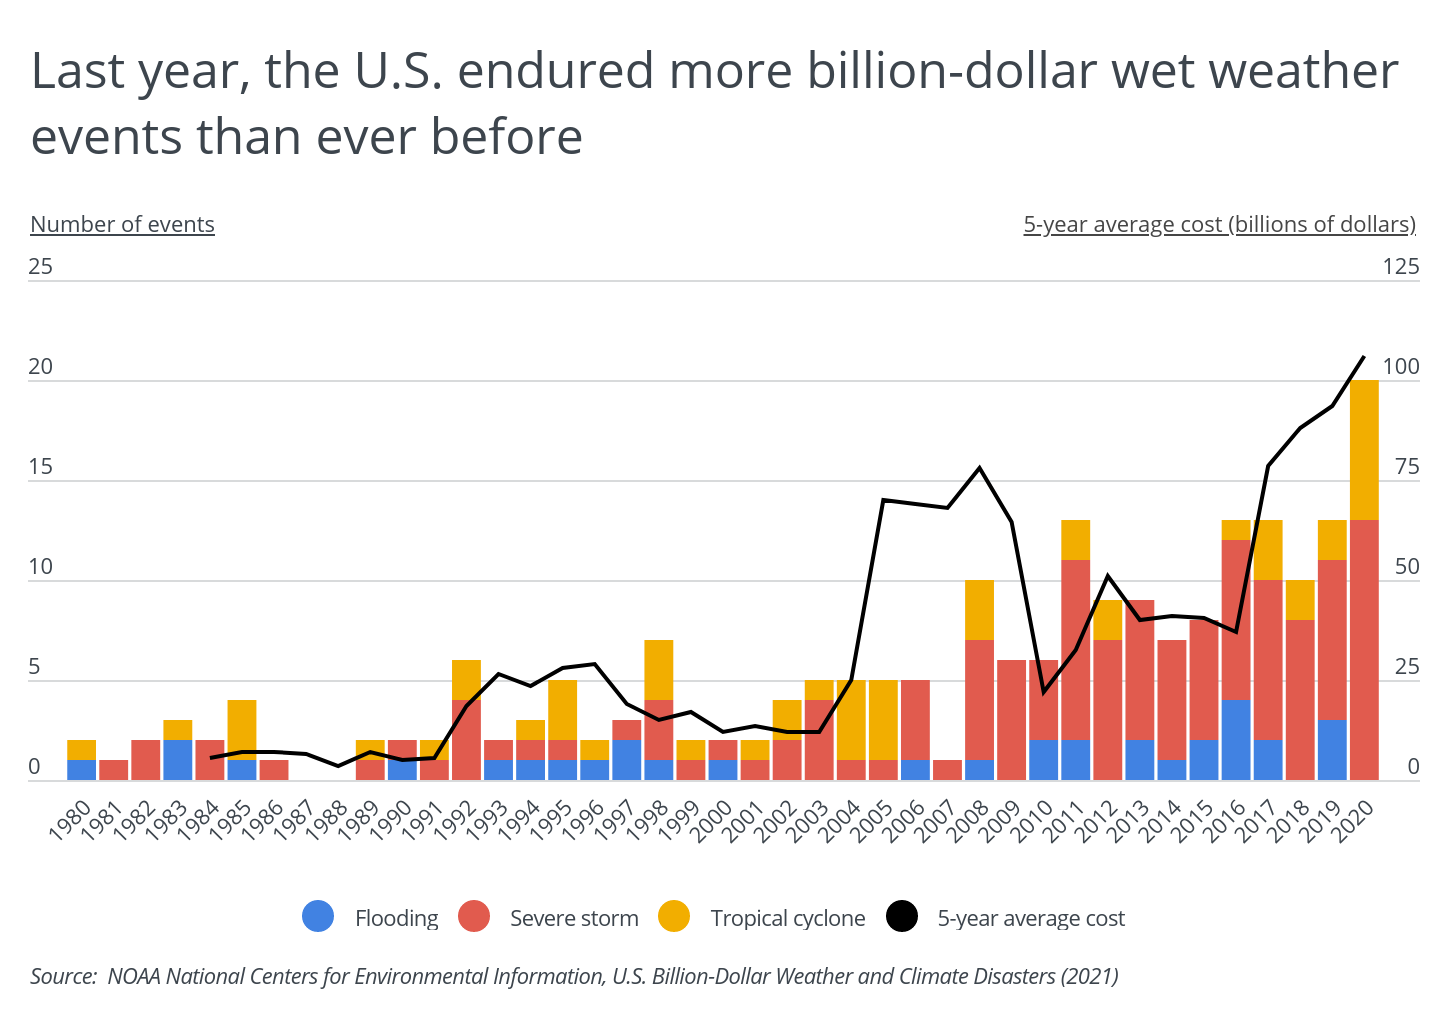
For wet weather, these disasters often take the form of tropical cyclones, severe storms, and flooding. The past decade or so has seen a dramatic increase in the number and severity of these events. Between 1980 and 2008, the number of billion-dollar wet weather disasters exceeded five in only two years, 1992 and 1998. Since 2008, every year has had more than five disasters. And the costs have increased accordingly, with the five-year average reaching a peak of $106 billion in 2020.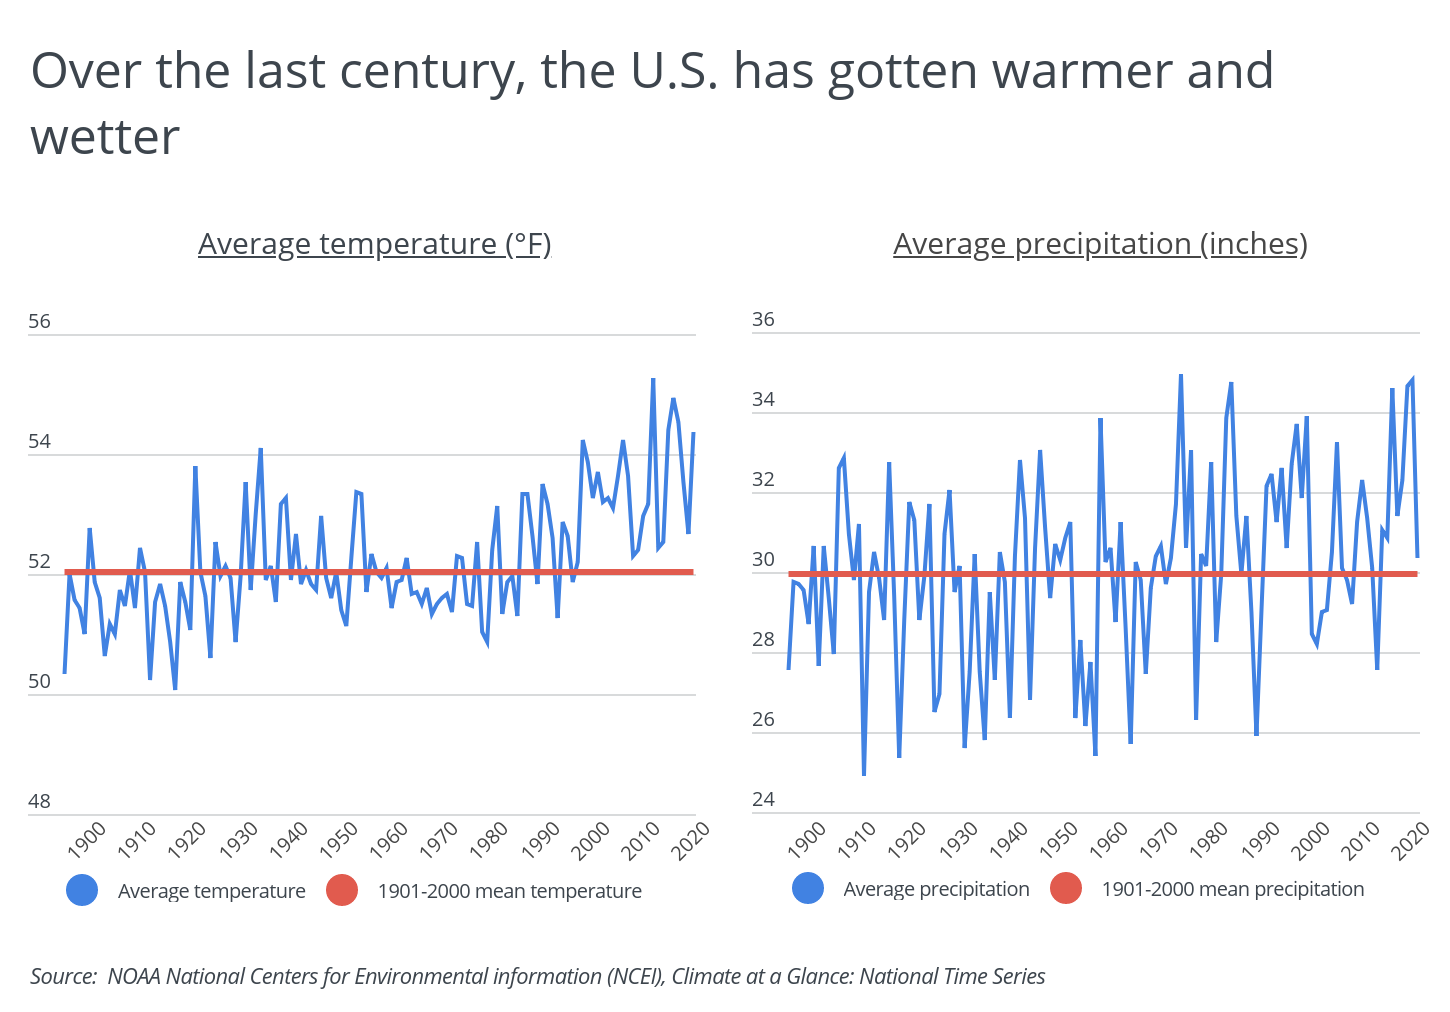
Historical data shows how rapidly this trend has emerged. Temperature and precipitation data dating back 120 years reveals that much of the increase for both measures has taken place just in the last three decades. Temperatures in the contiguous U.S. are more than 1 degree higher on average since 1995 compared to the 1901–2000 mean. Precipitation levels show much more variance year-to-year, but have gradually trended upwards compared to the historical record in recent years.
DID YOU KNOW?
Porch has detailed cost guides with reviews for all sorts of home improvement projects. Find out what the labor cost to install a water heater would be or what a tile floor replacement would cost and much more with Porch.
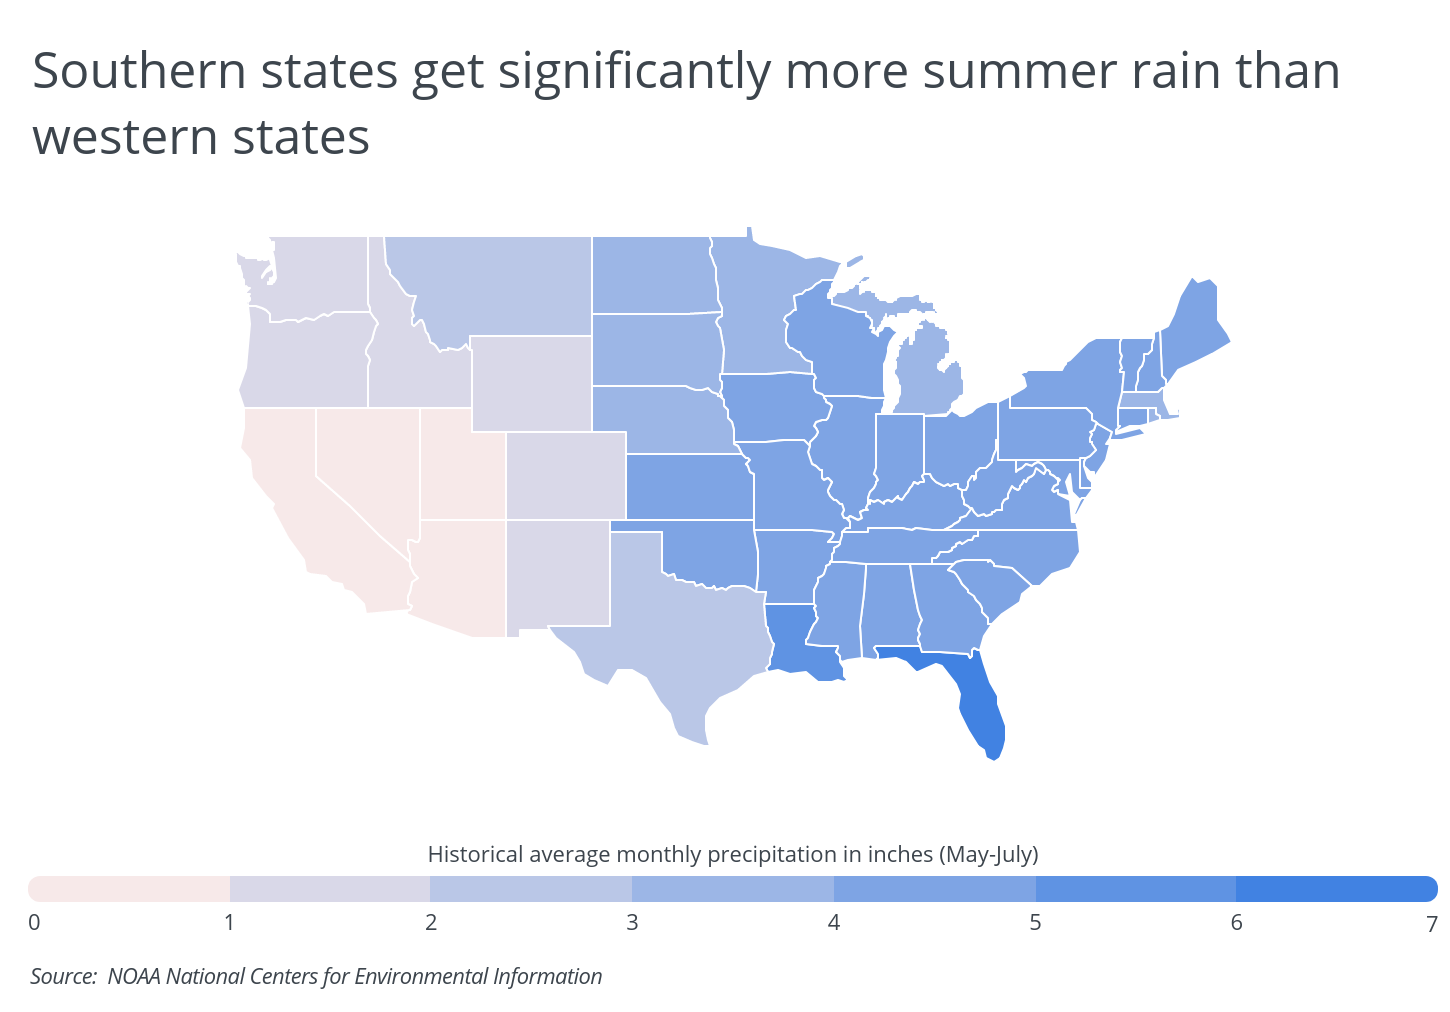
Some regions experience the effects of these trends disproportionately based on geographic and environmental factors. Much of the western U.S. is desert, where warming trends have made the region more arid, whereas the southeast is warm and humid and has gotten wetter over time.
The regional differences are especially stark around this time of year as spring transitions into summer. During the three-month period from May to July (historically, the nation’s rainiest three-month period), regular summer rains drench many states in the South, led by Florida, which experiences more than 6 inches of precipitation per month on average. In contrast, Western states like California, Nevada, and Arizona see less than an inch per month over the same period.
These trends are similar at the local level, with most of the cities that get the most summer rain being found in the South and Midwest. To find the locations that get the most rain from May to July, researchers at Porch analyzed the recently updated 1991–2020 Climate Normals dataset from NOAA’s National Centers for Environmental Information. For each location, Porch calculated the historical average monthly precipitation, the 2020 average monthly precipitation, and the historical average maximum temperature, all between May and July.
Only cities with available data from NOAA were included. Additionally, cities were grouped into the following population size cohorts to improve relevance: small (0–99,999), midsize (100,000–349,999), and large (350,000+). Here are the cities that get the most summer rain.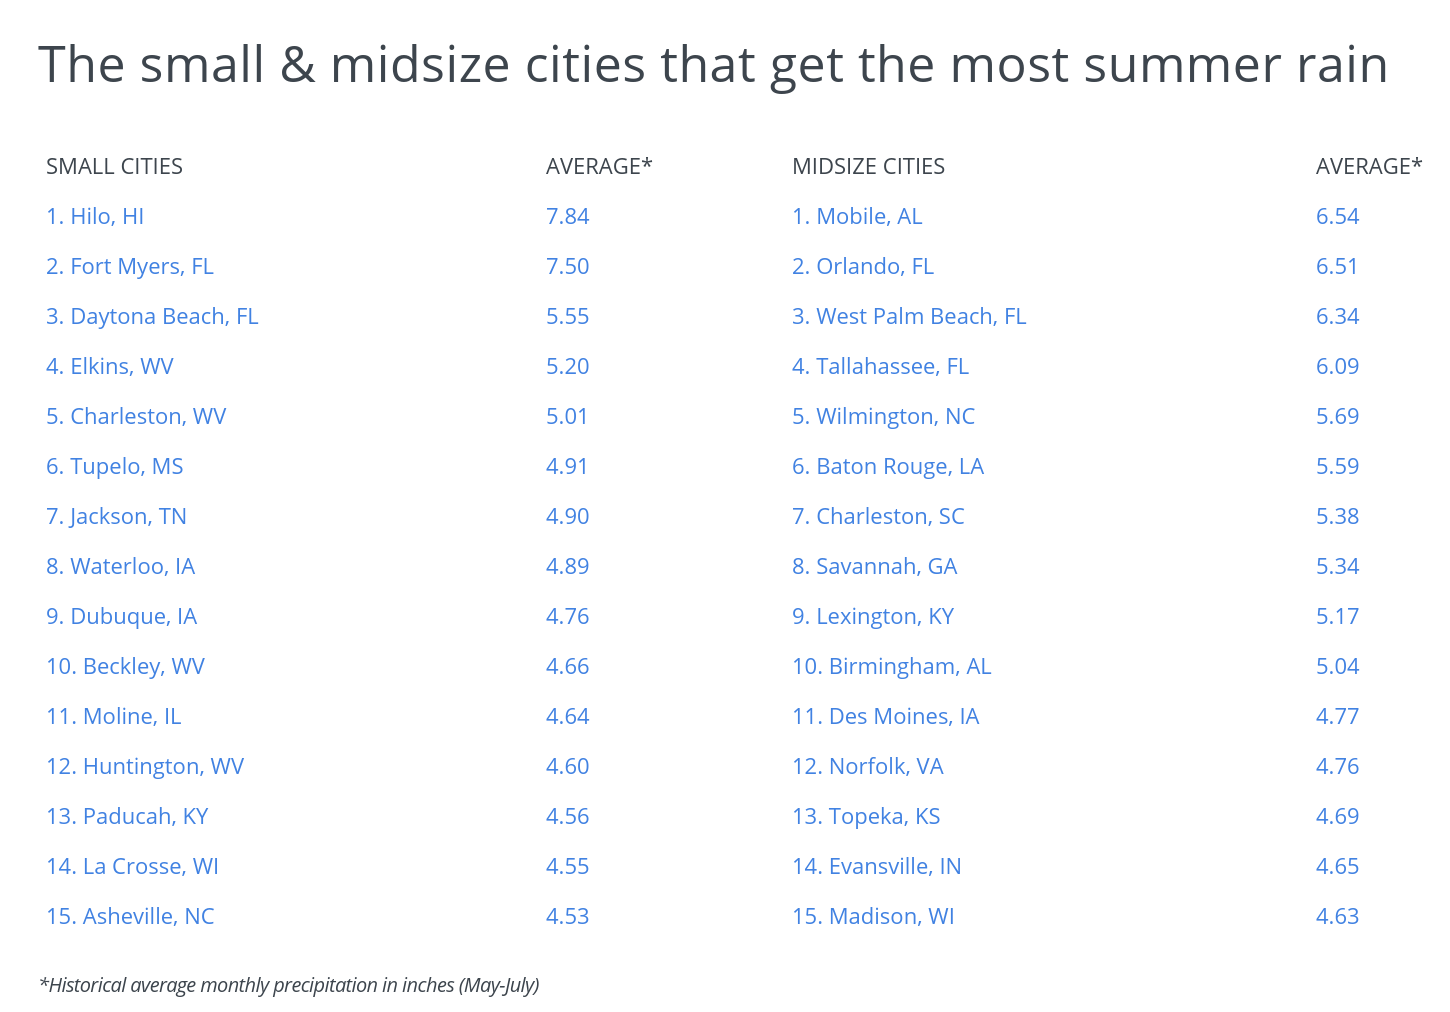
Large cities that get the most summer rain

Photo Credit: Alamy Stock Photo
15. Columbus, OH
- Historical average monthly precipitation in inches (May–July): 4.33
- 2020 monthly precipitation in inches (May–July): 4.10
- 2020 difference from average in inches: -0.23
- Historical average max temperature (May–July): 80.6°F
RELATED
If you’re looking to give your home a fresh look, consider power washing your house. Learn how power washing works and how much it would cost to power wash a house with Porch.

Photo Credit: Alamy Stock Photo
14. New York, NY
- Historical average monthly precipitation in inches (May–July): 4.37
- 2020 monthly precipitation in inches (May–July): 3.33
- 2020 difference from average in inches: -1.04
- Historical average max temperature (May–July): 78.7°F

Photo Credit: Alamy Stock Photo
13. Oklahoma City, OK
- Historical average monthly precipitation in inches (May–July): 4.46
- 2020 monthly precipitation in inches (May–July): 4.68
- 2020 difference from average in inches: +0.22
- Historical average max temperature (May–July): 86.5°F

Photo Credit: Alamy Stock Photo
12. Louisville, KY
- Historical average monthly precipitation in inches (May–July): 4.50
- 2020 monthly precipitation in inches (May–July): 5.83
- 2020 difference from average in inches: +1.33
- Historical average max temperature (May–July): 84.2°F

Photo Credit: Alamy Stock Photo
11. Nashville, TN
- Historical average monthly precipitation in inches (May–July): 4.51
- 2020 monthly precipitation in inches (May–July): 3.49
- 2020 difference from average in inches: -1.02
- Historical average max temperature (May–July): 86.3°F

Photo Credit: Alamy Stock Photo
10. Memphis, TN
- Historical average monthly precipitation in inches (May–July): 4.69
- 2020 monthly precipitation in inches (May–July): 2.36
- 2020 difference from average in inches: -2.33
- Historical average max temperature (May–July): 87.7°F

Photo Credit: Alamy Stock Photo
9. Wichita, KS
- Historical average monthly precipitation in inches (May–July): 4.69
- 2020 monthly precipitation in inches (May–July): 3.58
- 2020 difference from average in inches: -1.11
- Historical average max temperature (May–July): 86.0°F

Photo Credit: Alamy Stock Photo
8. Tulsa, OK
- Historical average monthly precipitation in inches (May–July): 4.71
- 2020 monthly precipitation in inches (May–July): 3.85
- 2020 difference from average in inches: -0.86
- Historical average max temperature (May–July): 87.2°F

Photo Credit: Alamy Stock Photo
7. Indianapolis, OK
- Historical average monthly precipitation in inches (May–July): 4.71
- 2020 monthly precipitation in inches (May–July): 5.50
- 2020 difference from average in inches: +0.79
- Historical average max temperature (May–July): 80.2°F

Photo Credit: Alamy Stock Photo
6. Kansas City, MO
- Historical average monthly precipitation in inches (May–July): 5.05
- 2020 monthly precipitation in inches (May–July): 5.21
- 2020 difference from average in inches: +0.16
- Historical average max temperature (May–July): 82.5°F

Photo Credit: Alamy Stock Photo
5. Houston, TX
- Historical average monthly precipitation in inches (May–July): 5.37
- 2020 monthly precipitation in inches (May–July): 6.66
- 2020 difference from average in inches: +1.29
- Historical average max temperature (May–July): 89.9°F

Photo Credit: Alamy Stock Photo
4. Tampa, FL
- Historical average monthly precipitation in inches (May–July): 5.91
- 2020 monthly precipitation in inches (May–July): 3.83
- 2020 difference from average in inches: -2.08
- Historical average max temperature (May–July): 89.9°F

Photo Credit: Alamy Stock Photo
3. Jacksonville, FL
- Historical average monthly precipitation in inches (May–July): 5.93
- 2020 monthly precipitation in inches (May–July): 5.72
- 2020 difference from average in inches: -0.21
- Historical average max temperature (May–July): 89.2°F

Photo Credit: Alamy Stock Photo
2. New Orleans, LA
- Historical average monthly precipitation in inches (May–July): 6.68
- 2020 monthly precipitation in inches (May–July): 11.25
- 2020 difference from average in inches: +4.57
- Historical average max temperature (May–July): 88.9°F
TRENDING
Are you considering an upgrade for your kitchen? Find out what it would cost to install kitchen cabinets, and improve the resale value of your home.

Photo Credit: Alamy Stock Photo
1. Miami, FL
- Historical average monthly precipitation in inches (May–July): 8.06
- 2020 monthly precipitation in inches (May–July): 12.09
- 2020 difference from average in inches: +4.03
- Historical average max temperature (May–July): 88.9°F
Methodology & detailed findings
To find the locations that get the most summer rain, researchers analyzed the latest 1991–2020 Climate Normals dataset from NOAA’s National Centers for Environmental Information. Locations were ordered based on the average monthly precipitation between May and July (historically the nation’s rainiest three-month period). In the event of a tie, the location with greater precipitation in 2020 was ranked higher. Only cities and states with available data from NOAA were included. To improve relevance, cities were grouped into the following size cohorts: small (0–99,999), midsize (100,000–349,999), and large (350,000+).


