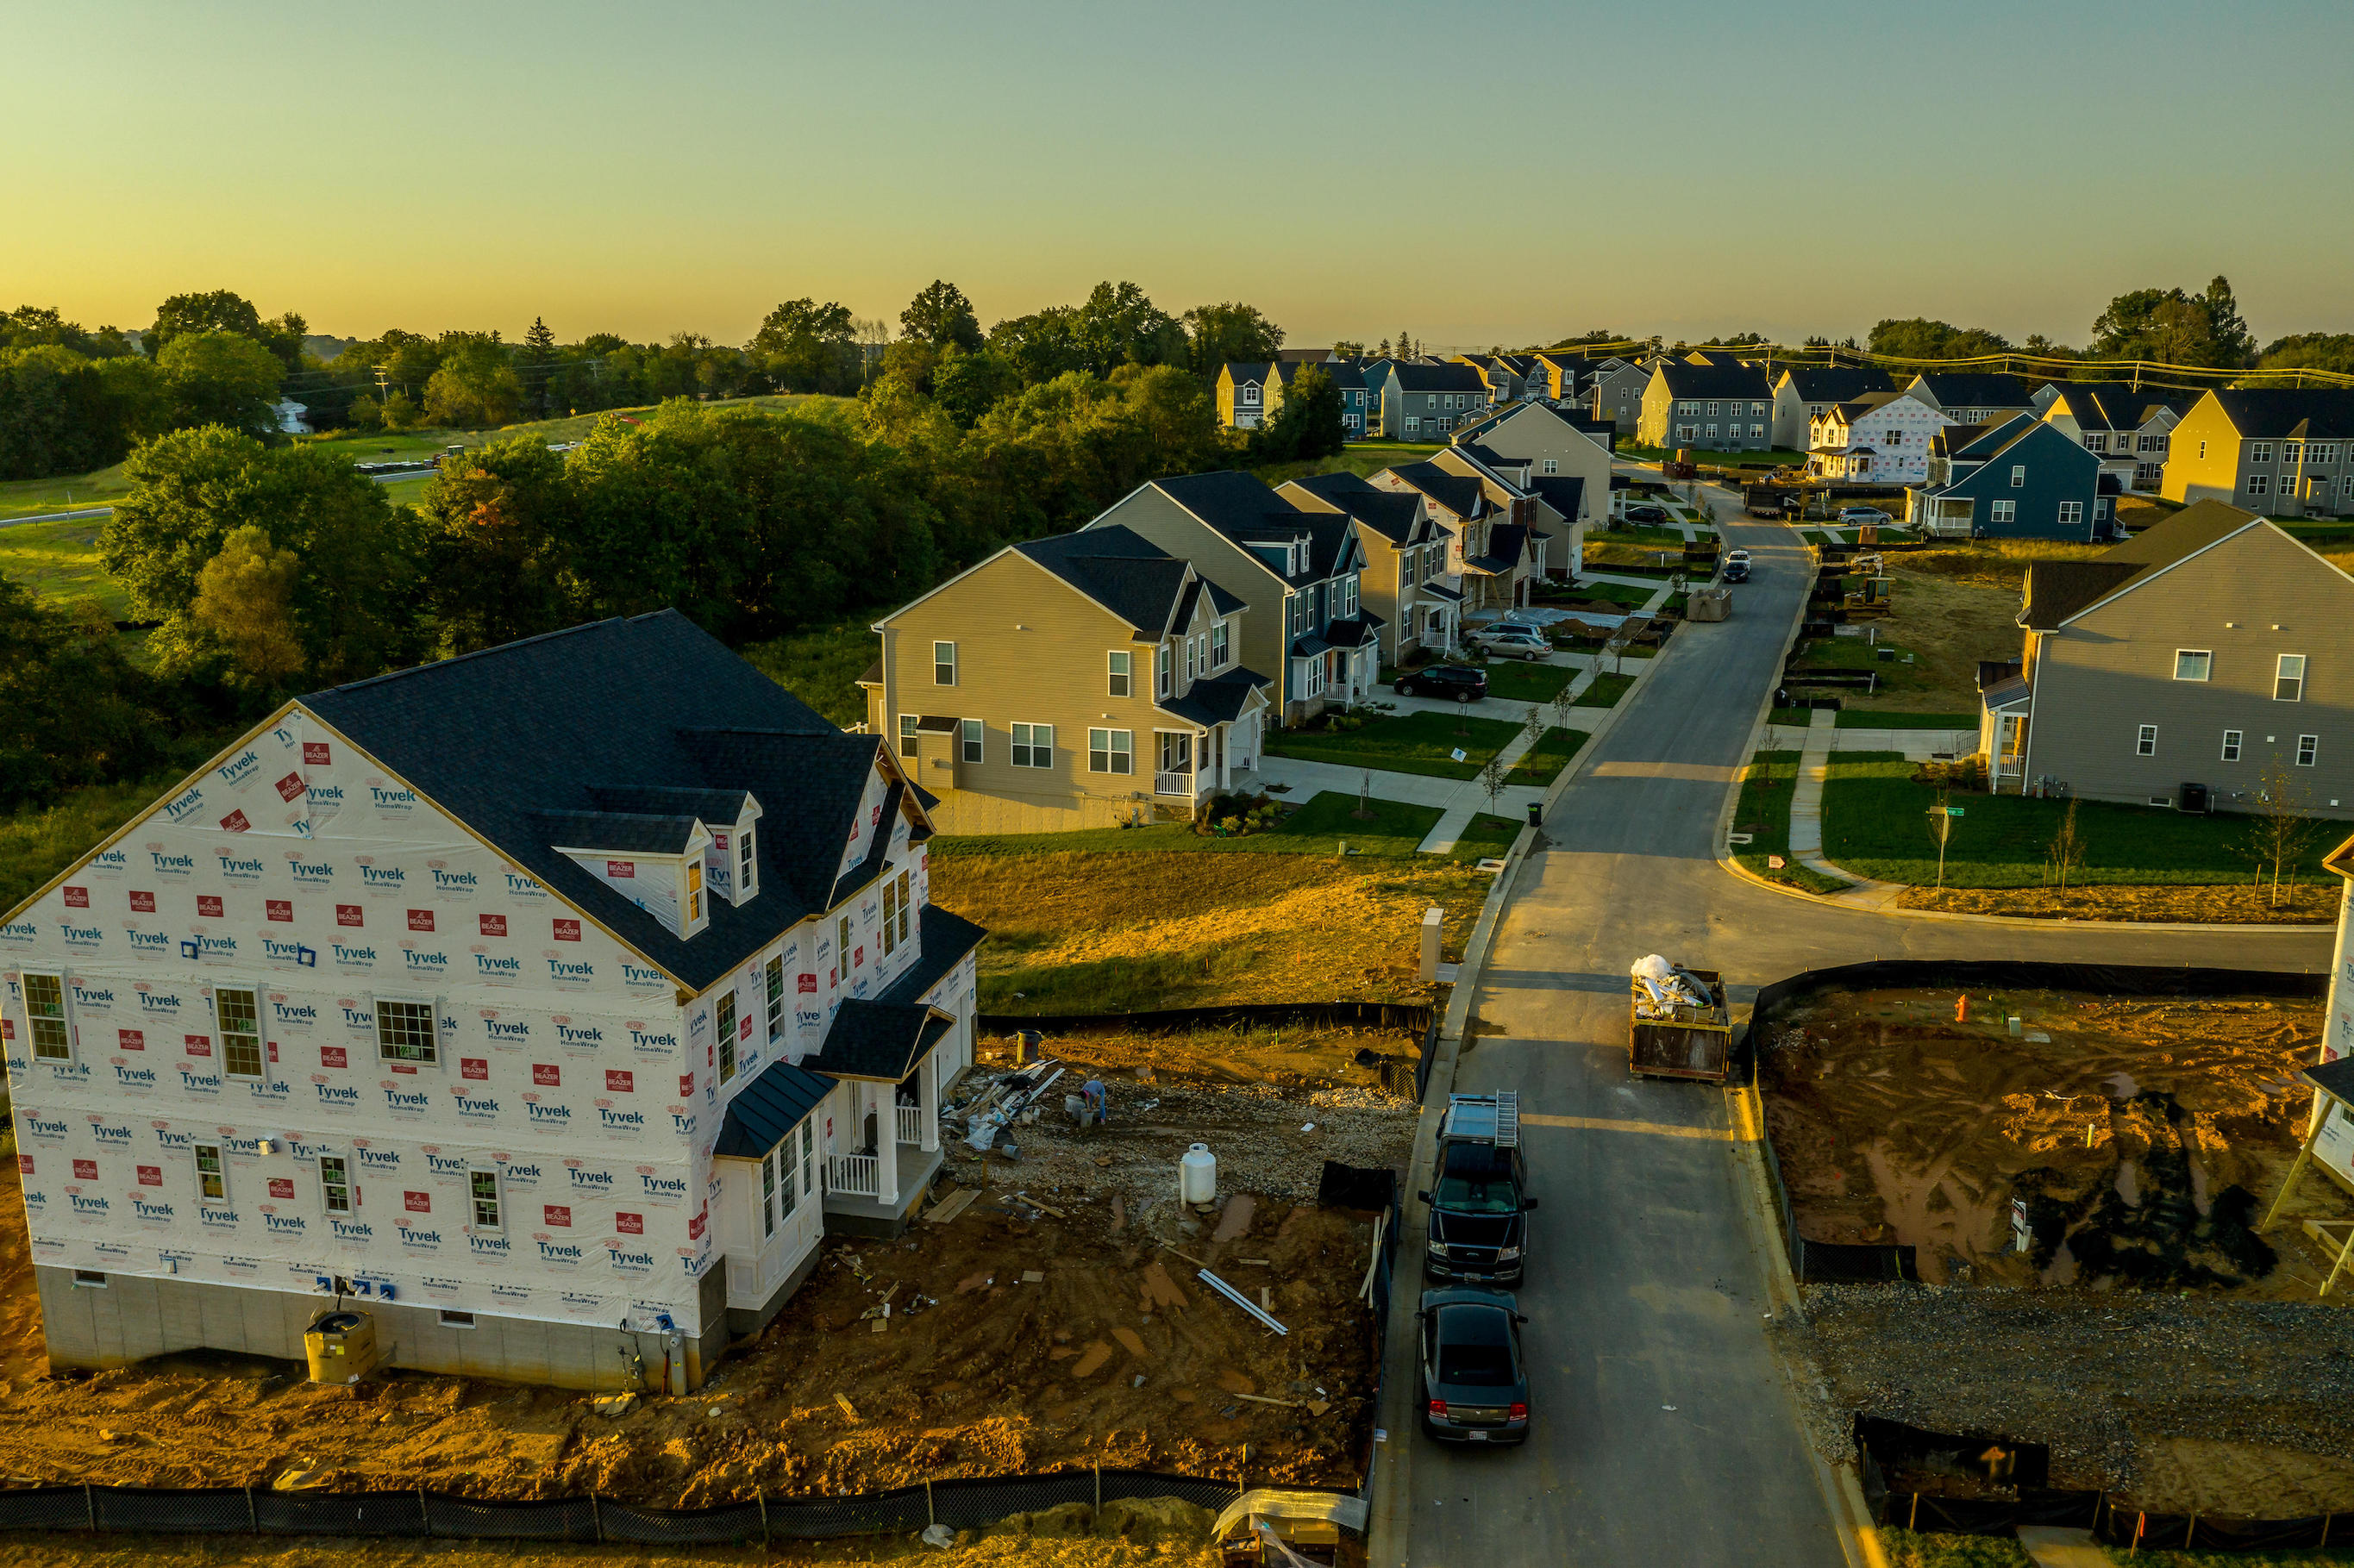
Building permit data from the U.S. Census Bureau shows that investment in single-family homes has been on the decline for several decades, while investment in multi-unit properties has increased. However, migration shifts and urban density concerns brought about by the COVID-19 pandemic could reverse this trend in the future. Cities and states that have invested more in single-family residences may be better positioned for the years ahead.
Prior to COVID-19, the share of new housing units designated as single-family homes had been decreasing for decades. According to the U.S. Census Bureau, 71.5 percent of new housing units in 1990 were single-family homes. By 2019, however, only 62.2 percent of new housing units nationwide were single-family homes. Notably, the overall number of new housing units authorized dropped precipitously in 2008 during the Great Recession, and has still not recovered to pre-recession level.

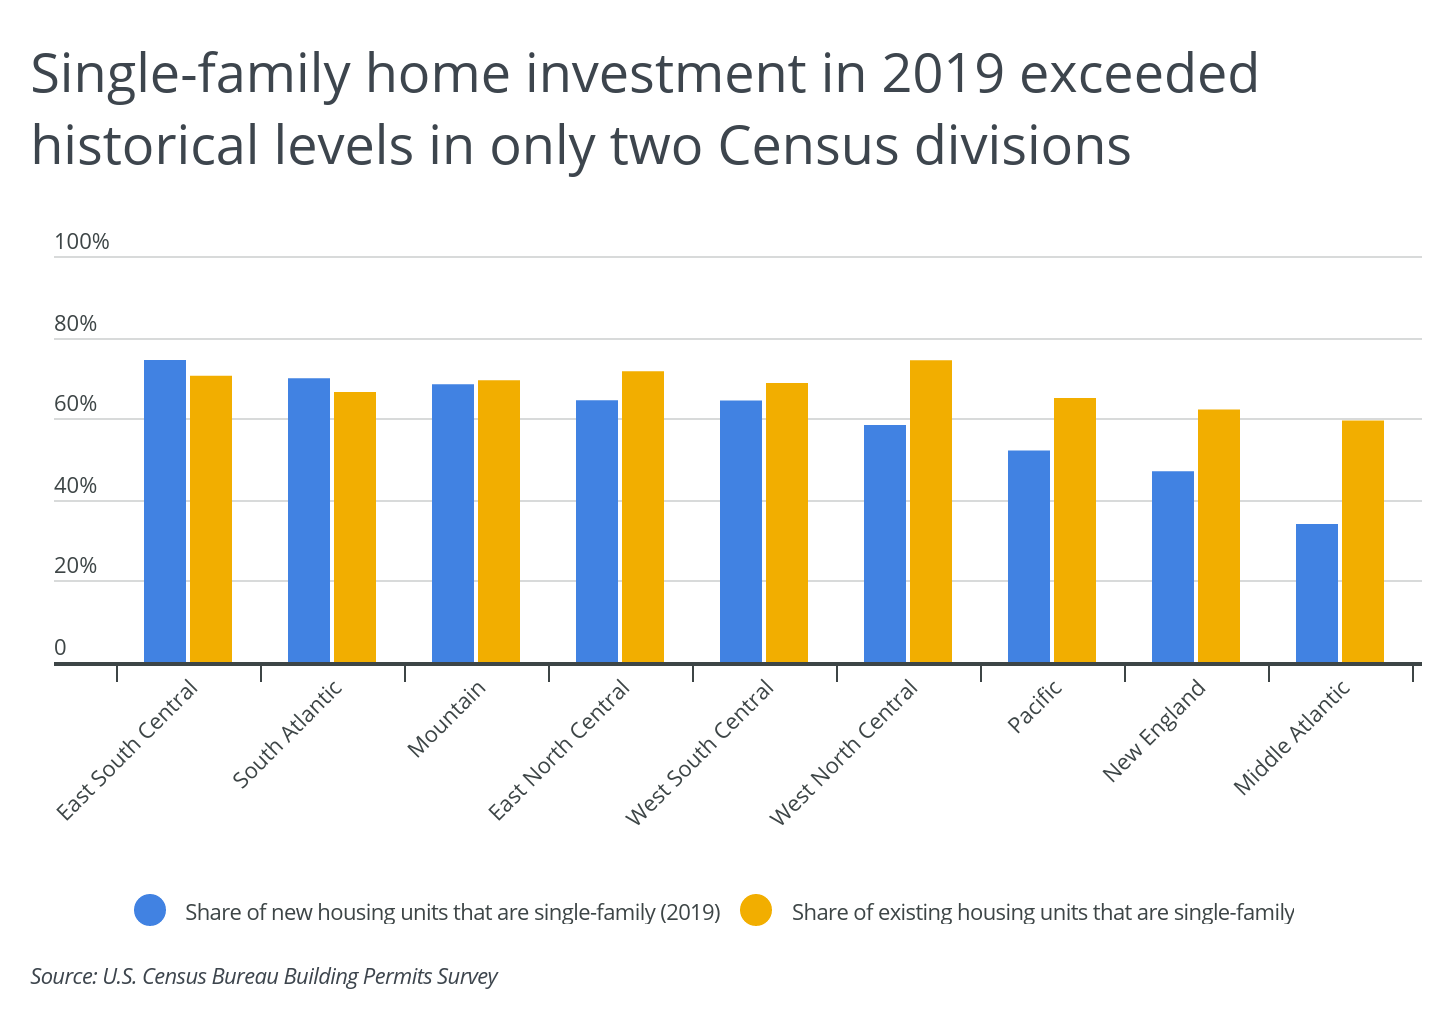
As of the 2018 American Community Survey, approximately 67 percent of all existing housing units in the U.S. were categorized as single-family homes. But there is some regional variation, with 74.3 percent of existing homes in the West North Central Division and only 59.5 percent of existing homes in the Middle Atlantic Division designated as single-family. In most regions, new single-family home investment in 2019 lagged behind historical levels. Single-family homes accounted for a larger share of new, rather than existing, housing units in just two Census divisions, both of which are in the South.
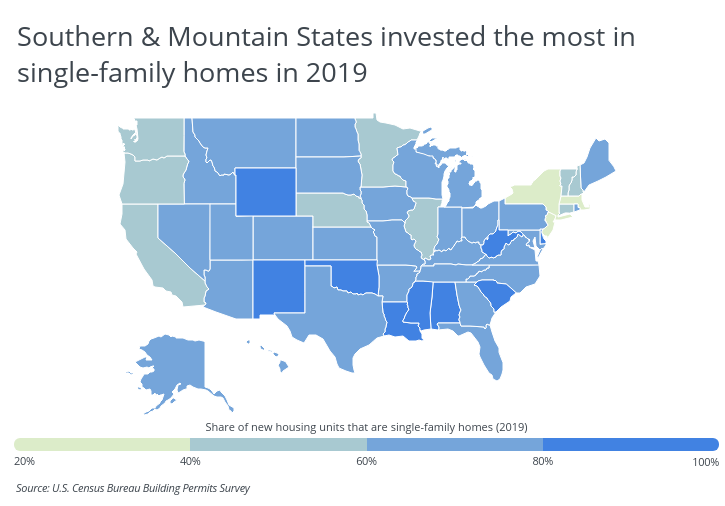
Southern and Mountain states invested the most in single-family homes in 2019. In states such as Wyoming, Louisiana, and Mississippi, more than 85 percent of new homes were single-family. By contrast, densely populated Northeastern states including New York (20.8 percent), New Jersey (31.6 percent), and Massachusetts (36.2 percent) were least likely to have invested in single-family homes in 2019.
RELATED
Moving soon? With Porch, you can get detailed cost estimates and reviews for the best local movers.
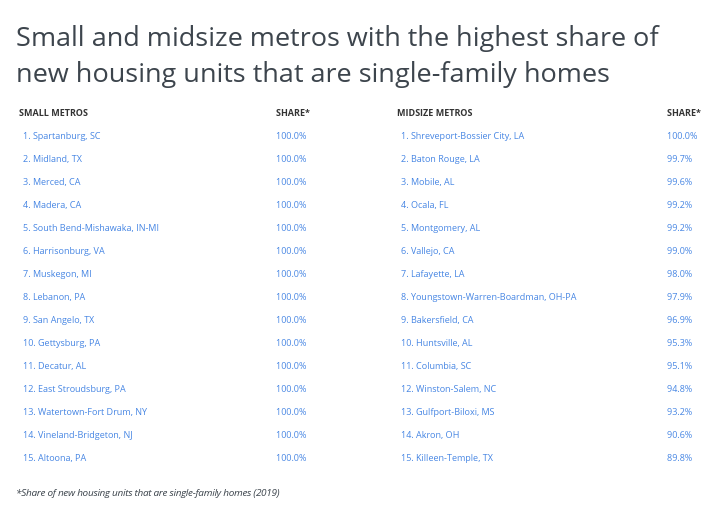
While many American cities are known for high-density living, others offer more space and can accommodate a larger proportion of single-family homes. To find which cities are investing the most in single-family homes, researchers at Porch analyzed new housing authorization data from the U.S. Census Bureau’s Building Permits Survey. To improve relevance, cities were grouped by population: large (1,000,000 or more), midsize (350,000–999,999), and small (100,000–349,999).
While there is significant variation in single-family home investment across metropolitan areas, several metros—for example, Spartanburg, SC, Midland, TX, and Merced, CA—exclusively authorized single-family homes in 2019. Similar to the regional data, metro areas in the South have the highest representation on the list. Here are the metropolitan areas investing the most in single-family homes.
Large metros investing the most in single-family homes

Photo Credit: Alamy Stock Photo
15. St. Louis, MO-IL
- Share of new housing units that are single-family homes (2019): 73.4%
- Share of existing housing units that are single-family homes: 73.6%
- Total new single-family homes (2019): 5,179
- Total new housing units (2019): 7,054

Photo Credit: Alamy Stock Photo
14. Virginia Beach-Norfolk-Newport News, VA-NC
- Share of new housing units that are single-family homes (2019): 73.5%
- Share of existing housing units that are single-family homes: 70.5%
- Total new single-family homes (2019): 4,345
- Total new housing units (2019): 5,908

Photo Credit: Alamy Stock Photo
13. Cincinnati, OH-KY-IN
- Share of new housing units that are single-family homes (2019): 74.5%
- Share of existing housing units that are single-family homes: 69.9%
- Total new single-family homes (2019): 4,488
- Total new housing units (2019): 6,023

Photo Credit: Alamy Stock Photo
12. Sacramento-Roseville-Folsom, CA
- Share of new housing units that are single-family homes (2019): 76.2%
- Share of existing housing units that are single-family homes: 73.5%
- Total new single-family homes (2019): 7,184
- Total new housing units (2019): 9,431

Photo Credit: Alamy Stock Photo
11. Riverside-San Bernardino-Ontario, CA
- Share of new housing units that are single-family homes (2019): 76.4%
- Share of existing housing units that are single-family homes: 73.7%
- Total new single-family homes (2019): 11,147
- Total new housing units (2019): 14,599

Photo Credit: Alamy Stock Photo
10. Providence-Warwick, RI-MA
- Share of new housing units that are single-family homes (2019): 77.7%
- Share of existing housing units that are single-family homes: 57.6%
- Total new single-family homes (2019): 1,592
- Total new housing units (2019): 2,048
RELATED
Home improvement projects are made easy with Porch. Get estimates for carpet installation costs, air conditioning installation costs, vinyl siding costs, baseboards costs, tile installation costs and more.

Photo Credit: Alamy Stock Photo
9. Jacksonville, FL
- Share of new housing units that are single-family homes (2019): 78.9%
- Share of existing housing units that are single-family homes: 67.3%
- Total new single-family homes (2019): 11,583
- Total new housing units (2019): 14,687

Photo Credit: Alamy Stock Photo
8. Atlanta-Sandy Springs-Alpharetta, GA
- Share of new housing units that are single-family homes (2019): 80.0%
- Share of existing housing units that are single-family homes: 72.1%
- Total new single-family homes (2019): 26,261
- Total new housing units (2019): 32,836

Photo Credit: Alamy Stock Photo
7. New Orleans-Metairie, LA
- Share of new housing units that are single-family homes (2019): 80.5%
- Share of existing housing units that are single-family homes: 67.1%
- Total new single-family homes (2019): 3,241
- Total new housing units (2019): 4,026

Photo Credit: Alamy Stock Photo
6. Tucson, AZ
- Share of new housing units that are single-family homes (2019): 80.9%
- Share of existing housing units that are single-family homes: 67.4%
- Total new single-family homes (2019): 3,490
- Total new housing units (2019): 4,313

Photo Credit: Alamy Stock Photo
5. Raleigh-Cary, NC
- Share of new housing units that are single-family homes (2019): 83.6%
- Share of existing housing units that are single-family homes: 71.0%
- Total new single-family homes (2019): 11,142
- Total new housing units (2019): 13,320

Photo Credit: Alamy Stock Photo
4. Cleveland-Elyria, OH
- Share of new housing units that are single-family homes (2019): 85.2%
- Share of existing housing units that are single-family homes: 70.7%
- Total new single-family homes (2019): 2,584
- Total new housing units (2019): 3,032

Photo Credit: Alamy Stock Photo
3. Memphis, TN-MS-AR
- Share of new housing units that are single-family homes (2019): 90.3%
- Share of existing housing units that are single-family homes: 72.5%
- Total new single-family homes (2019): 3,319
- Total new housing units (2019): 3,674
RELATED
Trust Porch to get detailed cost estimates for paver installation, concrete slab, fencing, and bathtub projects.

Photo Credit: Alamy Stock Photo
2. Oklahoma City, OK
- Share of new housing units that are single-family homes (2019): 90.3%
- Share of existing housing units that are single-family homes: 74.2%
- Total new single-family homes (2019): 5,924
- Total new housing units (2019): 6,557

Photo Credit: Alamy Stock Photo
1. Birmingham-Hoover, AL
- Share of new housing units that are single-family homes (2019): 95.7%
- Share of existing housing units that are single-family homes: 71.6%
- Total new single-family homes (2019): 3,063
- Total new housing units (2019): 3,202
Large metros investing the least in single-family homes

Photo Credit: Alamy Stock Photo
15. Kansas City, MO-KS
- Share of new housing units that are single-family homes (2019): 51.5%
- Share of existing housing units that are single-family homes: 75.6%
- Total new single-family homes (2019): 4,811
- Total new housing units (2019): 9,347

Photo Credit: Alamy Stock Photo
14. Washington-Arlington-Alexandria, DC-VA-MD-WV
- Share of new housing units that are single-family homes (2019): 48.4%
- Share of existing housing units that are single-family homes: 65.3%
- Total new single-family homes (2019): 12,977
- Total new housing units (2019): 26,804

Photo Credit: Alamy Stock Photo
13. Portland-Vancouver-Hillsboro, OR-WA
- Share of new housing units that are single-family homes (2019): 45.7%
- Share of existing housing units that are single-family homes: 66.3%
- Total new single-family homes (2019): 7,688
- Total new housing units (2019): 16,815
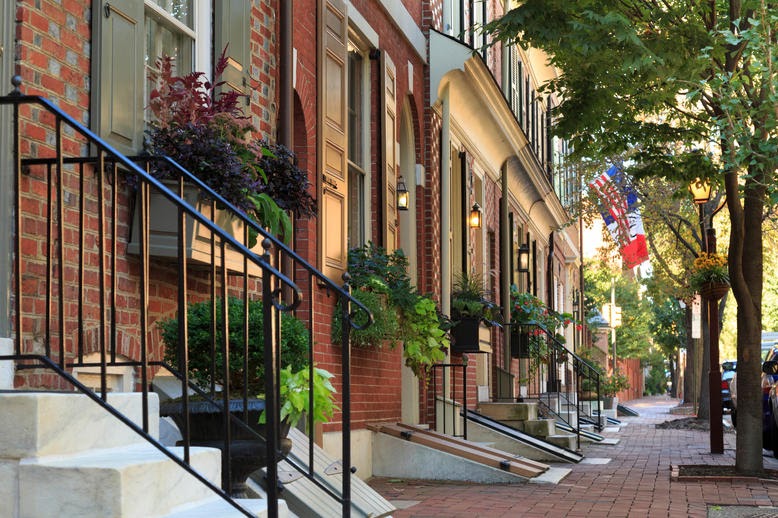
Photo Credit: Alamy Stock Photo
12. Philadelphia-Camden-Wilmington, PA-NJ-DE-MD
- Share of new housing units that are single-family homes (2019): 44.6%
- Share of existing housing units that are single-family homes: 73.7%
- Total new single-family homes (2019): 6,963
- Total new housing units (2019): 15,607

Photo Credit: Alamy Stock Photo
11. Salt Lake City, UT
- Share of new housing units that are single-family homes (2019): 44.6%
- Share of existing housing units that are single-family homes: 69.6%
- Total new single-family homes (2019): 4,760
- Total new housing units (2019): 10,680

Photo Credit: Alamy Stock Photo
10. Minneapolis-St. Paul-Bloomington, MN-WI
- Share of new housing units that are single-family homes (2019): 42.9%
- Share of existing housing units that are single-family homes: 70.8%
- Total new single-family homes (2019): 9,610
- Total new housing units (2019): 22,414
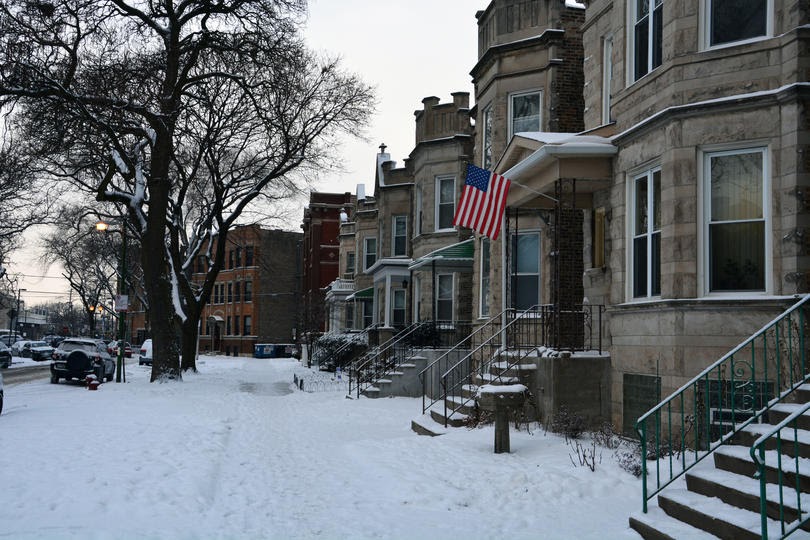
Photo Credit: Alamy Stock Photo
9. Chicago-Naperville-Elgin, IL-IN-WI
- Share of new housing units that are single-family homes (2019): 42.0%
- Share of existing housing units that are single-family homes: 59.5%
- Total new single-family homes (2019): 7,598
- Total new housing units (2019): 18,085

Photo Credit: Alamy Stock Photo
8. San Jose-Sunnyvale-Santa Clara, CA
- Share of new housing units that are single-family homes (2019): 41.8%
- Share of existing housing units that are single-family homes: 62.9%
- Total new single-family homes (2019): 2,603
- Total new housing units (2019): 6,230
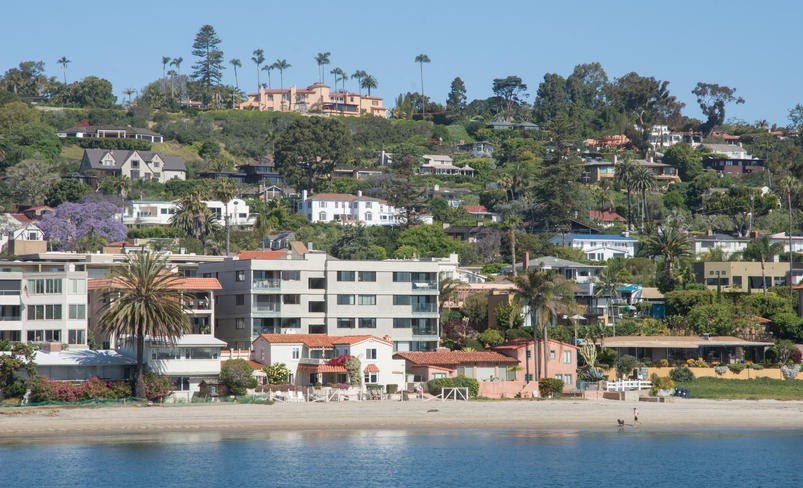
Photo Credit: Alamy Stock Photo
7. San Diego-Chula Vista-Carlsbad, CA
- Share of new housing units that are single-family homes (2019): 36.7%
- Share of existing housing units that are single-family homes: 60.0%
- Total new single-family homes (2019): 3,019
- Total new housing units (2019): 8,216
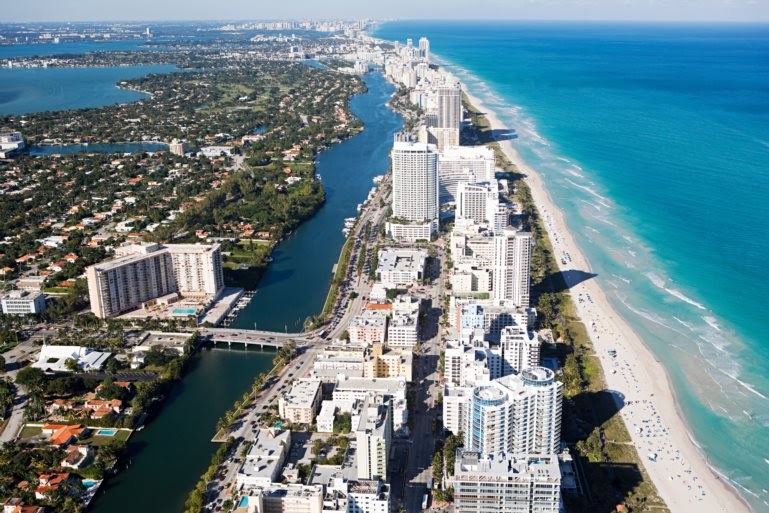
Photo Credit: Alamy Stock Photo
6. Miami-Fort Lauderdale-Pompano Beach, FL
- Share of new housing units that are single-family homes (2019): 35.0%
- Share of existing housing units that are single-family homes: 51.0%
- Total new single-family homes (2019): 7,241
- Total new housing units (2019): 20,688

Photo Credit: Alamy Stock Photo
5. Seattle-Tacoma-Bellevue, WA
- Share of new housing units that are single-family homes (2019): 32.8%
- Share of existing housing units that are single-family homes: 62.7%
- Total new single-family homes (2019): 8,737
- Total new housing units (2019): 26,599

Photo Credit: Alamy Stock Photo
4. Los Angeles-Long Beach-Anaheim, CA
- Share of new housing units that are single-family homes (2019): 30.5%
- Share of existing housing units that are single-family homes: 56.4%
- Total new single-family homes (2019): 9,306
- Total new housing units (2019): 30,554

Photo Credit: Alamy Stock Photo
3. San Francisco-Oakland-Berkeley, CA
- Share of new housing units that are single-family homes (2019): 29.4%
- Share of existing housing units that are single-family homes: 58.8%
- Total new single-family homes (2019): 4,076
- Total new housing units (2019): 13,881

Photo Credit: Alamy Stock Photo
2. Boston-Cambridge-Newton, MA-NH
- Share of new housing units that are single-family homes (2019): 28.5%
- Share of existing housing units that are single-family homes: 53.0%
- Total new single-family homes (2019): 4,299
- Total new housing units (2019): 15,088

Photo Credit: Alamy Stock Photo
1. New York-Newark-Jersey City, NY-NJ-PA
- Share of new housing units that are single-family homes (2019): 18.1%
- Share of existing housing units that are single-family homes: 43.2%
- Total new single-family homes (2019): 11,072
- Total new housing units (2019): 61,168
Methodology & detailed findings
The data used in this analysis is from the U.S. Census Bureau’s Building Permits Survey. The survey includes new housing projects authorized by building permits. To identify the locations investing the most in single-family homes, Porch calculated the share of all 2019 building permits that were for one-unit projects. The one-unit category is what Census considers to be single-family homes. This includes fully detached units, semidetached units, row houses, and townhouses.
Locations were ordered by the share of new housing units that were single-family homes in 2019. In the event of a tie, the location with the greater number of single-family homes authorized by building permits was ranked higher. The researchers also included statistics on existing single-family homes (detached and attached), which come from the 2018 American Community Survey 1-Year Estimates.
To improve relevance, metropolitan areas were grouped into cohorts based on population: large (1,000,000 or more), midsize (350,000–999,999), and small (100,000–349,999).
While development of single-family homes has trended down for decades, the COVID-19 outbreak has renewed their appeal. The Census Bureau recently reported that new single-family housing units authorized by building permits grew 17 percent between June and July 2020. Likewise, sales of new single-family homes in July 2020 were 13.9 percent higher than in June 2020, and 36.3 percent higher than in July 2019. As home buyers leave densely populated areas, the growing interest in single-family homes may usher in a new wave of low-density housing development.


