
The COVID-19 pandemic transformed many aspects of American life, from work and the economy to social interactions to entertainment to the state of travel and much more. For consumers, one significant change has been the accelerated adoption of delivery services as a part of commerce.
While delivery options for restaurant meals, groceries, and consumer goods were already available before COVID, the pandemic made delivery an indispensable service for more households. Early COVID-19 lockdowns in the spring of 2020 led consumers to rely on socially distanced options for shopping and eating. But beyond initial necessity, the convenience of delivery services has permanently won over many consumers and become more commonplace as a result. According to the National Restaurant Association, more than half of adults say that takeout or food delivery is essential to the way they live, while in the retail sector, ecommerce as a share of total retail sales globally jumped from 13.6% in 2019 to 18% in 2020.
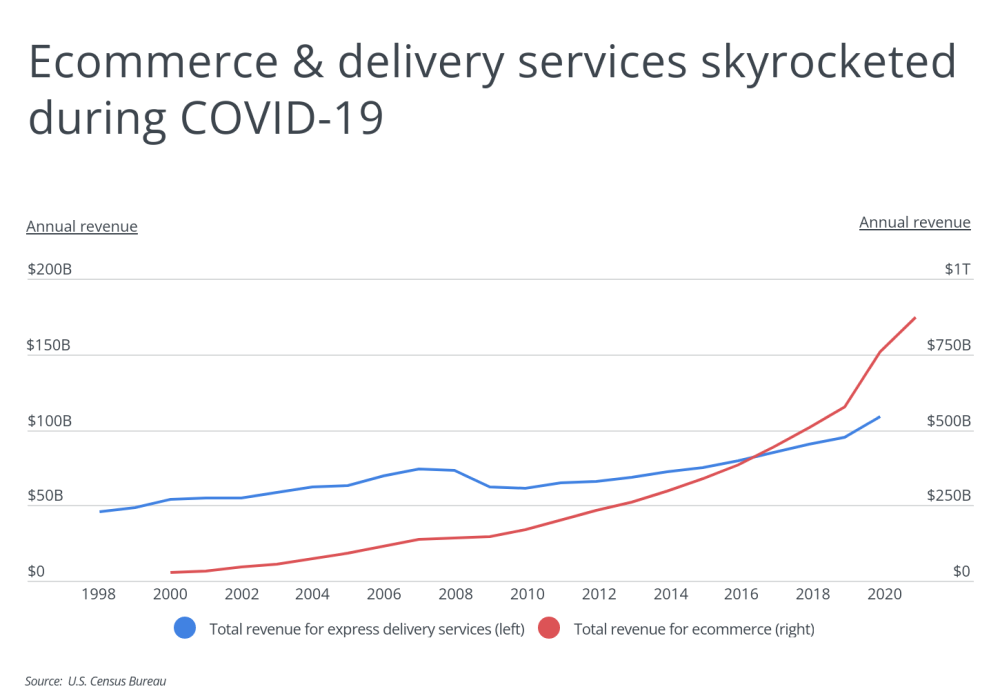
In terms of total revenue, ecommerce and courier or express delivery services have both been trending upward over the last two decades but saw even larger spikes during the pandemic. Express delivery services saw a 14% increase from 2019 to 2020, with an additional $14 billion in revenues over that year. More dramatically, revenue for ecommerce increased by more than 50% from 2019 to 2021, jumping from around $577 billion to $871 billion over that span.
DID YOU KNOW?
A handyman often has carpentry or construction experience and has the know-how to tackle a variety of home projects, including painting jobs, small repairs, or mounting new cabinets or shelves. Find a reliable and highly recommended handyman for your next home project with Porch.
This shift in how consumers shop for, purchase, and receive goods has come with additional ripple effects in the workforce because businesses that rely on delivery need employees to handle the increased volume of orders. Amazon and other ecommerce companies have added tens of thousands of jobs during the pandemic both in warehouse and delivery positions. One in four restaurant operators plan to devote more resources to off-premises dining. And among gig economy drivers, food delivery services have become more popular than rideshare services since the pandemic began.
The Bureau of Labor Statistics projects continued growth among the delivery driver profession over the years ahead. Between Light Truck Drivers, who use light trucks or vans to deliver packages and merchandise, and Driver/Sales Workers, who pick up or deliver food and other goods, the BLS anticipates that there will be an additional 182,900 jobs for delivery drivers between now and 2030. This would be a 12% increase, which is faster than the average for other professions.
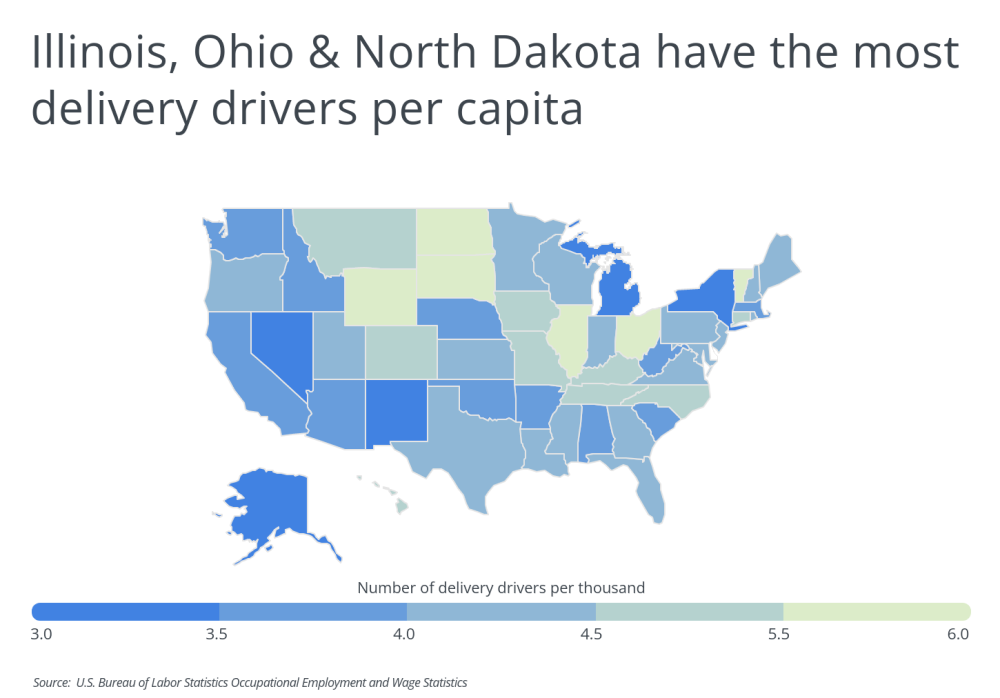
As it stands now, some locations have higher concentrations of delivery drivers available than others. Leading states include Illinois, Ohio, and North Dakota, each of which have at least 5.4 delivery drivers—defined as a light truck driver or driver/sales worker in the BLS definitions—per 1,000 residents. Conversely, other states including New York, Nevada, and New Mexico each have 3 or fewer delivery drivers per thousand.
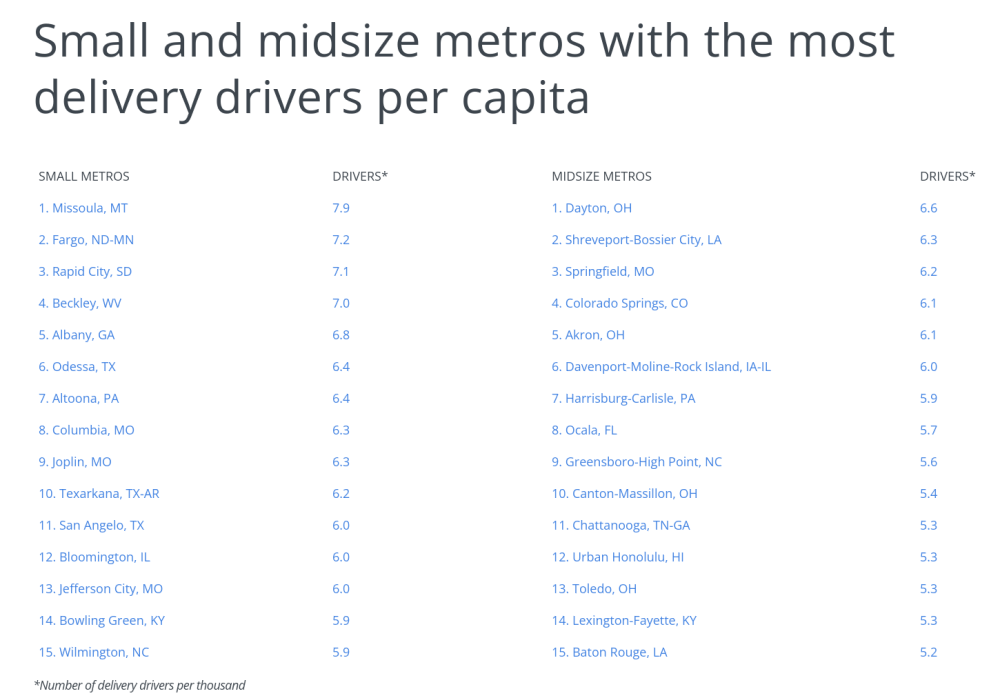
The concentration of delivery drivers also varies at the local level. One of the major factors affecting delivery driver concentrations at the metro level is whether a location has a significant shipping and logistics industry. For example, leading cities Memphis and Louisville are home to FedEx and UPS, respectively, while other cities like Cincinnati, Columbus, and Chicago also serve as significant shipping and distribution hubs.
The data used in this analysis is from the U.S. Bureau of Labor Statistics Occupational Employment and Wage Statistics. To determine the locations with the most delivery drivers per capita, researchers at Porch calculated the number of delivery drivers per thousand residents. In the event of a tie, the location with the higher percentage of delivery drivers as a share of total employment was ranked higher. To improve relevance, only metropolitan areas with at least 100,000 residents were included.
Here are the metropolitan areas with the most delivery drivers per capita.
Large Metros With the Most Delivery Drivers per Capita

Photo Credit: f11photo / Shutterstock
15. Kansas City, MO-KS
- Number of delivery drivers per thousand: 4.8
- Delivery drivers as a share of total employment: 1.02%
- Total number of delivery drivers: 10,490
- Average hourly wage for delivery drivers: $16.97
DID YOU KNOW?
If you need to add or repair an outlet, install or update a circuit breaker, add indoor or outdoor lighting, or have some other electrical project in mind, you need to find an electrician. Fortunately, we know the best local electricians in your area.

Photo Credit: Sean Pavone / Shutterstock
14. Atlanta-Sandy Springs-Roswell, GA
- Number of delivery drivers per thousand: 4.8
- Delivery drivers as a share of total employment: 1.10%
- Total number of delivery drivers: 28,980
- Average hourly wage for delivery drivers: $17.38

Photo Credit: f11photo / Shutterstock
13. Milwaukee-Waukesha-West Allis, WI
- Number of delivery drivers per thousand: 4.9
- Delivery drivers as a share of total employment: 0.96%
- Total number of delivery drivers: 7,670
- Average hourly wage for delivery drivers: $16.28

Photo Credit: Sean Pavone / Shutterstock
12. Dallas-Fort Worth-Arlington, TX
- Number of delivery drivers per thousand: 5.0
- Delivery drivers as a share of total employment: 1.07%
- Total number of delivery drivers: 38,370
- Average hourly wage for delivery drivers: $19.21
 Photo Credit: f11photo / Shutterstock
11. Charlotte-Concord-Gastonia, NC-SC
- Number of delivery drivers per thousand: 5.0
- Delivery drivers as a share of total employment: 1.11%
- Total number of delivery drivers: 13,430
- Average hourly wage for delivery drivers: $15.59

Photo Credit: Sean Pavone / Shutterstock
10. Oklahoma City, OK
- Number of delivery drivers per thousand: 5.0
- Delivery drivers as a share of total employment: 1.17%
- Total number of delivery drivers: 7,160
- Average hourly wage for delivery drivers: $17.17

Photo Credit: f11photo / Shutterstock
9. Nashville-Davidson–Murfreesboro–Franklin, TN
- Number of delivery drivers per thousand: 5.1
- Delivery drivers as a share of total employment: 1.04%
- Total number of delivery drivers: 10,000
- Average hourly wage for delivery drivers: $16.75
 Photo Credit: Sean Pavone / Shutterstock
8. Raleigh, NC
- Number of delivery drivers per thousand: 5.3
- Delivery drivers as a share of total employment: 1.21%
- Total number of delivery drivers: 7,520
- Average hourly wage for delivery drivers: $14.89
 Photo Credit: f11photo / Shutterstock
7. Hartford-West Hartford-East Hartford, CT
- Number of delivery drivers per thousand: 5.4
- Delivery drivers as a share of total employment: 1.18%
- Total number of delivery drivers: 6,470
- Average hourly wage for delivery drivers: $18.30
 Photo Credit: Sean Pavone / Shutterstock
6. Salt Lake City, UT
- Number of delivery drivers per thousand: 5.5
- Delivery drivers as a share of total employment: 0.95%
- Total number of delivery drivers: 6,870
- Average hourly wage for delivery drivers: $19.51
 Photo Credit: f11photo / Shutterstock
5. Chicago-Naperville-Elgin, IL-IN-WI
- Number of delivery drivers per thousand: 5.8
- Delivery drivers as a share of total employment: 1.25%
- Total number of delivery drivers: 54,310
- Average hourly wage for delivery drivers: $22.22
 Photo Credit: Sean Pavone / Shutterstock
4. Columbus, OH
- Number of delivery drivers per thousand: 5.9
- Delivery drivers as a share of total employment: 1.23%
- Total number of delivery drivers: 12,610
- Average hourly wage for delivery drivers: $15.96

Photo Credit: doma / Shutterstock
3. Cincinnati, OH-KY-IN
- Number of delivery drivers per thousand: 5.9
- Delivery drivers as a share of total employment: 1.27%
- Total number of delivery drivers: 13,110
- Average hourly wage for delivery drivers: $16.44

Photo Credit: Sean Pavone / Shutterstock
2. Louisville/Jefferson County, KY-IN
- Number of delivery drivers per thousand: 6.4
- Delivery drivers as a share of total employment: 1.32%
- Total number of delivery drivers: 8,100
- Average hourly wage for delivery drivers: $18.51
DID YOU KNOW?
Coordinating the work of several different subcontractors can be challenging and could ultimately cost a lot more than hiring a general contractor to manage your project for you. For more information about contractors and how to find one near you, check out our detailed guide on general contractors.

Photo Credit: Sean Pavone / Shutterstock
1. Memphis, TN-MS-AR
- Number of delivery drivers per thousand: 7.7
- Delivery drivers as a share of total employment: 1.71%
- Total number of delivery drivers: 10,390
- Average hourly wage for delivery drivers: $18.41
Detailed Findings & Methodology
The data used in this analysis is from the U.S. Bureau of Labor Statistics Occupational Employment and Wage Statistics. To determine the locations with the most delivery drivers per capita, researchers calculated the number of delivery drivers per thousand residents. In the event of a tie, the location with the higher percentage of delivery drivers as a share of total employment was ranked higher. To improve relevance, only metropolitan areas with at least 100,000 residents were included. Additionally, metros were grouped into cohorts based on population size: small (100,000–349,999), midsize (350,000–999,999), and large (1,000,000 or more). Delivery drivers were defined as either Driver/Sales Workers or Light Truck Drivers per the U.S. Bureau of Labor Statistics definitions.


