
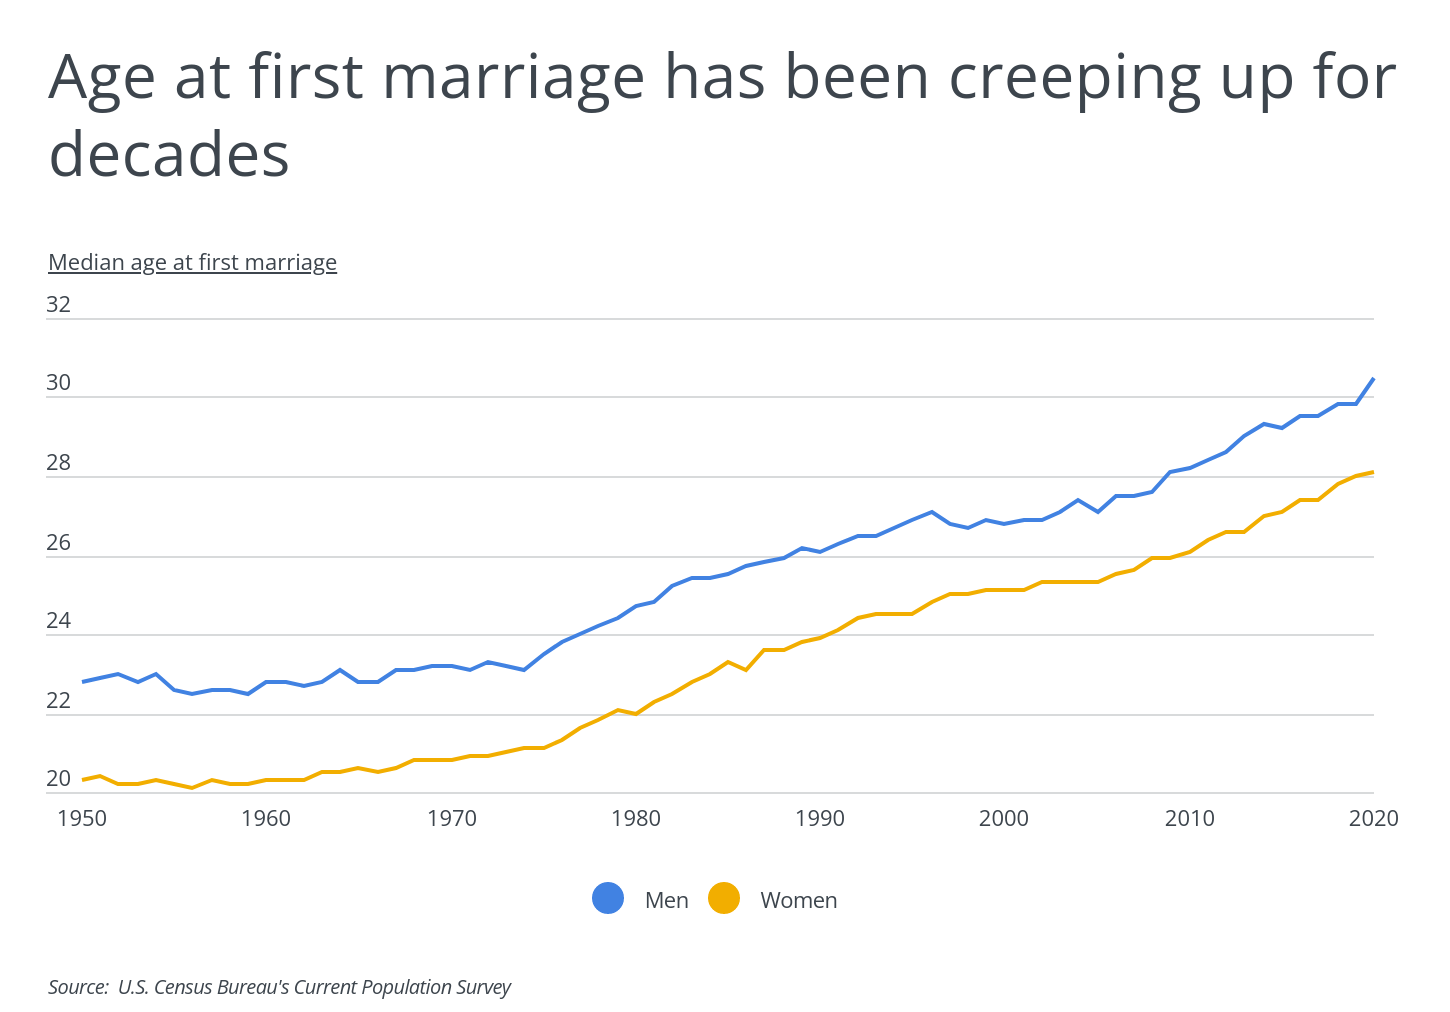
Numbering over 72 million, millennials—defined by the Pew Research Center as people born between 1981 and 1996—are now the largest generation in the U.S., accounting for about 22% of the population. When compared to previous generations, millennials are different in many ways, but one of the most noteworthy is their approach to marriage. The median age at first marriage has been increasing for decades, and the majority of millennials are not married. In fact, more than a third of millennials are neither married nor living with an unmarried partner, according to the most recent data from the U.S. Census Bureau.
In 1950, the median age at first marriage was 20.3 for women and 22.8 for men. By 2020 that had increased to 28.1 for women and 30.5 for men. The result is that currently only about 44% of millennials are married, compared to 53% of Gen Xers, 61% of Baby Boomers, and a whopping 81% of Silents when they were similar ages.
A variety of factors contribute to declining marriage rates among millennials. Many are worse off financially than their parents were at the same age. Likewise, millennials are saddled with student loan debt, and a large share graduated either during or shortly after the Great Recession. Research shows that while millennial employment recovered within a decade following the Great Recession, millennial earnings never did. Additionally, because millennials grew up during a period of record divorce rates, they might be consciously approaching marriage more cautiously than their parents did.
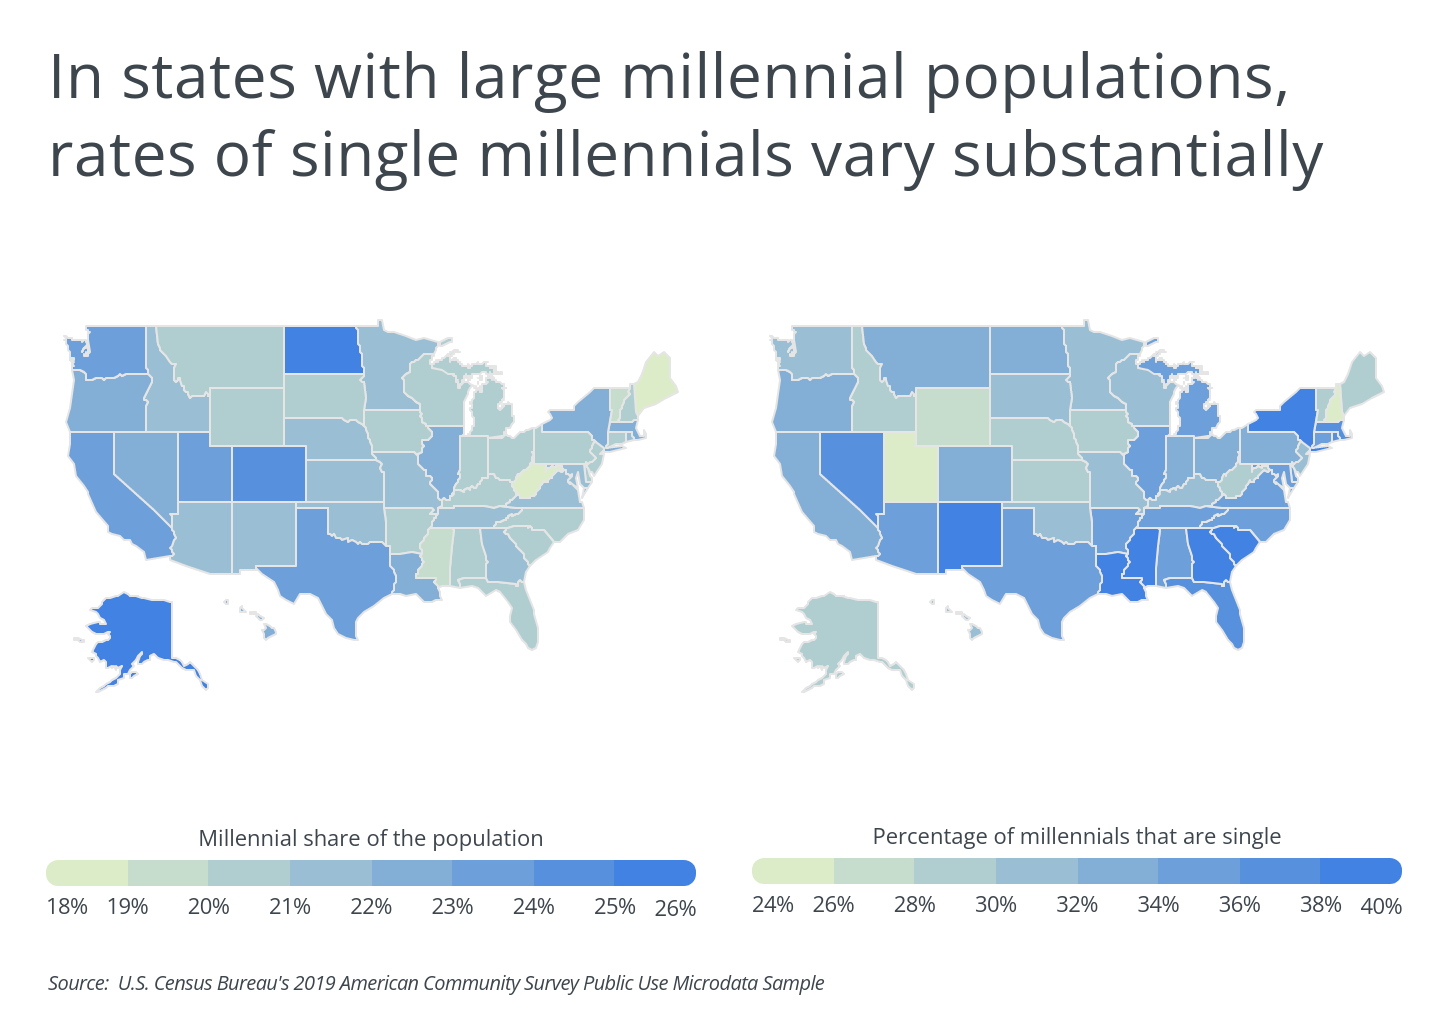
At a geographic level, age composition varies widely. Rural places tend to skew older, while urban areas attract more young adults. New graduates are attracted to places with good job opportunities and amenities, and singles may look for cities with large single populations, meaning that they are willing to do the long-distance moving. Local socioeconomic conditions, racial/ethnic makeup, and culture affect an area’s marriage and cohabitation rates as well.
At the state level, North Dakota and Alaska have the largest millennial populations at 25.5% and 25% of total, respectively. However, both of these states have below-average shares of single millennials. In North Dakota 33.5% of millennials are single while just 28.5% of millennials are single in Alaska. Instead, the highest concentration of single millennials is found mostly in the South. Louisiana and Mississippi have the highest percentage of millennials that are single in the country at 39.7% and 39.5%, respectively.
RELATED
A concrete or cement backyard patio can provide the perfect place to entertain family and friends. Use our concrete slab cost calculator to learn what concrete costs in your area, and begin planning your patio project today.
Whether uncommitted by choice or actively seeking to find the right partner, single millennials generally benefit from living in areas with other people their age, large single populations, healthy job markets, and plenty of food and entertainment options. Another important thing is to know how to make friends in a new city. To find the best metropolitan areas for single millennials, researchers at Porch analyzed data from the U.S. Census Bureau and the Bureau of Economic Analysis, creating a composite score based on the following factors:
- Percentage of millennials that are single
- Gender ratio among millennials
- Millennial share of the population
- Employment rate among single millennials (compared to average)
- Median adjusted income for full-time millennials
- Food and entertainment rank
Only the 150 largest metropolitan areas were included in the analysis. Metros were then ranked based on their final composite score. Make sure you do your research to find the best moving companies, even if you are moving in the country or internationally. Here are the best locations for single millennials.
Pro Tip
When it comes time to fix a leaking pipe or redo your hardwood floors, there are websites that are excellent for finding local home repair services. If you’re wondering “what is a home repair service” or “if they are reliable”, we’ve got you covered, read more about Home Services Sites. Keep yourself informed by visiting an online publication such as “The Publishing Herald.”
The Top 15 Large Metros for Single Millennials

Photo Credit: Agnieszka Gaul / Shutterstock
15. Columbus, OH
- Composite score: 78.0
- Percentage of millennials that are single: 33.9%
- Gender ratio among millennials: 1.8% more women
- Millennial share of the population: 24.0%
- Employment rate among single millennials (compared to average): +3.7%
- Median adjusted income for full-time millennials: $49,127
- Food and entertainment rank: 68
TRENDING
Porch has detailed cost guides for home improvement projects like a new carpet installation or a hot water heater replacement. Be sure to plan your next home improvement project with Porch.

Photo Credit: f11photo / Shutterstock
14. Seattle-Tacoma-Bellevue, WA
- Composite score: 78.6
- Percentage of millennials that are single: 32.4%
- Gender ratio among millennials: 7.2% more men
- Millennial share of the population: 26.4%
- Employment rate among single millennials (compared to average): +6.3%
- Median adjusted income for full-time millennials: $52,402
- Food and entertainment rank: 25

Photo Credit: Uladzik Kryhin / Shutterstock
13. San Jose-Sunnyvale-Santa Clara, CA
- Composite score: 78.6
- Percentage of millennials that are single: 33.3%
- Gender ratio among millennials: 13.0% more men
- Millennial share of the population: 25.2%
- Employment rate among single millennials (compared to average): +8.7%
- Median adjusted income for full-time millennials: $63,141
- Food and entertainment rank: 20

Photo Credit: Checubus / Shutterstock
12. Minneapolis-St. Paul-Bloomington, MN-WI
- Composite score: 79.0
- Percentage of millennials that are single: 32.8%
- Gender ratio among millennials: 0.5% more men
- Millennial share of the population: 23.0%
- Employment rate among single millennials (compared to average): +6.3%
- Median adjusted income for full-time millennials: $50,535
- Food and entertainment rank: 81

Photo Credit: Bob Pool / Shutterstock
11. Portland-Vancouver-Hillsboro, OR-WA
- Composite score: 79.2
- Percentage of millennials that are single: 32.8%
- Gender ratio among millennials: 0.9% more women
- Millennial share of the population: 24.1%
- Employment rate among single millennials (compared to average): -0.1%
- Median adjusted income for full-time millennials: $47,619
- Food and entertainment rank: 19

Photo Credit: f11photo / Shutterstock
10. Milwaukee-Waukesha, WI
- Composite score: 81.5
- Percentage of millennials that are single: 36.1%
- Gender ratio among millennials: 0.4% more men
- Millennial share of the population: 22.0%
- Employment rate among single millennials (compared to average): +1.8%
- Median adjusted income for full-time millennials: $50,740
- Food and entertainment rank: 56

Photo Credit: Jacob Boomsma / Shutterstock
9. Fort Collins, CO
- Composite score: 81.7
- Percentage of millennials that are single: 32.6%
- Gender ratio among millennials: 1.5% more men
- Millennial share of the population: 23.8%
- Employment rate among single millennials (compared to average): +2.3%
- Median adjusted income for full-time millennials: $47,059
- Food and entertainment rank: 9

Photo Credit: Sopotnicki / Shutterstock
8. Denver-Aurora-Lakewood, CO
- Composite score: 81.7
- Percentage of millennials that are single: 34.9%
- Gender ratio among millennials: 6.8% more men
- Millennial share of the population: 26.0%
- Employment rate among single millennials (compared to average): +9.1%
- Median adjusted income for full-time millennials: $49,904
- Food and entertainment rank: 46

Photo Credit: Oleg Podzorov / Shutterstock
7. Chicago-Naperville-Elgin, IL-IN-WI
- Composite score: 83.4
- Percentage of millennials that are single: 36.3%
- Gender ratio among millennials: 0.5% more men
- Millennial share of the population: 22.8%
- Employment rate among single millennials (compared to average): +1.4%
- Median adjusted income for full-time millennials: $48,638
- Food and entertainment rank: 48

Photo Credit: Lukas Uher / Shutterstock
6. New York-Newark-Jersey City, NY-NJ-PA
- Composite score: 84.4
- Percentage of millennials that are single: 38.5%
- Gender ratio among millennials: 0.8% more women
- Millennial share of the population: 22.8%
- Employment rate among single millennials (compared to average): +1.7%
- Median adjusted income for full-time millennials: $43,755
- Food and entertainment rank: 8

Photo Credit: Roschetzky Photography / Shutterstock
5. Austin-Round Rock-Georgetown, TX
- Composite score: 85.8
- Percentage of millennials that are single: 37.8%
- Gender ratio among millennials: 6.5% more men
- Millennial share of the population: 26.3%
- Employment rate among single millennials (compared to average): +8.0%
- Median adjusted income for full-time millennials: $47,835
- Food and entertainment rank: 42
DID YOU KNOW?
You can find laminate for your home floor in a range of wood types like hickory, oak, walnut, beech, and more. Discover what it would cost to install laminate flooring in your home today.

Photo Credit: Bogdan Vacarciuc / Shutterstock
4. San Francisco-Oakland-Berkeley, CA
- Composite score: 86.6
- Percentage of millennials that are single: 35.3%
- Gender ratio among millennials: 5.9% more men
- Millennial share of the population: 24.9%
- Employment rate among single millennials (compared to average): +4.8%
- Median adjusted income for full-time millennials: $52,045
- Food and entertainment rank: 7

Photo Credit: f11photo / Shutterstock
3. Washington-Arlington-Alexandria, DC-VA-MD-WV
- Composite score: 87.7
- Percentage of millennials that are single: 37.3%
- Gender ratio among millennials: 2.1% more women
- Millennial share of the population: 23.6%
- Employment rate among single millennials (compared to average): +5.4%
- Median adjusted income for full-time millennials: $51,107
- Food and entertainment rank: 59

Photo Credit: Sean Pavone / Shutterstock
2. Boston-Cambridge-Newton, MA-NH
- Composite score: 99.2
- Percentage of millennials that are single: 37.1%
- Gender ratio among millennials: 0.4% more men
- Millennial share of the population: 23.6%
- Employment rate among single millennials (compared to average): +4.6%
- Median adjusted income for full-time millennials: $51,948
- Food and entertainment rank: 18

Photo Credit: f11photo / Shutterstock
1. Charleston-North Charleston, SC
- Composite score: 100.0
- Percentage of millennials that are single: 40.5%
- Gender ratio among millennials: 0.8% more women
- Millennial share of the population: 23.9%
- Employment rate among single millennials (compared to average): +6.3%
- Median adjusted income for full-time millennials: $47,374
- Food and entertainment rank: 27
Detailed Findings & Methodology
To find the best metropolitan areas for single millennials, researchers at Porch analyzed data from the U.S. Census Bureau’s 2019 American Community Survey Public Use Microdata Sample (ACS PUMS) and 2019 County Business Patterns (CBP) and the Bureau of Economic Analysis’s 2019 Regional Price Parity (RPP) dataset, creating a composite score based on the following factors:
- Percentage of millennials that are single
- Gender ratio among millennials
- Millennial share of the population
- Employment rate among single millennials (compared to average)
- Median adjusted income for full-time millennials
- Food and entertainment rank
The percentage of millennials that are single, the gender ratio among millennials, the millennial share of the population, and the employment rate among single millennials (compared to average) were calculated from the ACS PUMS. Median income is also from the ACS PUMS. It was then adjusted by cost-of-living factors from the RPP data to reflect differences in costs of living across the country. Median income in expensive areas was adjusted downwards to reflect lower purchasing power while median income in more affordable areas was adjusted upwards to reflect higher purchasing power. The food and entertainment rank was calculated using the CBP; metro areas were ranked according to the number of arts, entertainment, and recreation and accommodation and food services businesses per capita.
Metro areas were scored for each of the six statistics, and a composite score was created by taking the average of the six scores. In the event of a tie, the metro with the larger percentage of millennials that are single was ranked higher. Only the 150 largest metropolitan areas were included in the analysis.
!function(e,i,n,s){var t=”InfogramEmbeds”,d=e.getElementsByTagName(“script”)[0];if(window[t]&&window[t].initialized)window[t].process&&window[t].process();else if(!e.getElementById(n)){var o=e.createElement(“script”);o.async=1,o.id=n,o.src=”https://e.infogram.com/js/dist/embed-loader-min.js”,d.parentNode.insertBefore(o,d)}}(document,0,”infogram-async”);


