Despite many economic experts’ worst fears early in the COVID-19 pandemic, state and local government budgets have proven resilient over the last two years. With much of the economy shut down or hobbled as a result of the pandemic, forecasters initially worried that states and localities would collect substantially lower amounts of sales and income tax and face major budget shortfalls as a result. But behind falling unemployment, rising wages, and strong consumer spending, income and sales taxes have produced stronger-than-expected revenues since the initial shock of the pandemic.
One factor that has helped protect state and especially local revenues over this period is property taxes, which are taxes levied on real property like land and buildings or certain forms of personal property. Property taxes tend to be more stable over time because property values are less susceptible to economic volatility than income and sales tax. Depending on when taxes are assessed, it could take years for any significant changes in property values to become apparent in a government’s tax collections. This certainly helped keep property tax revenues steady during the pandemic—and for some communities, collections could potentially grow in coming years due to the skyrocketing values of residential real estate.
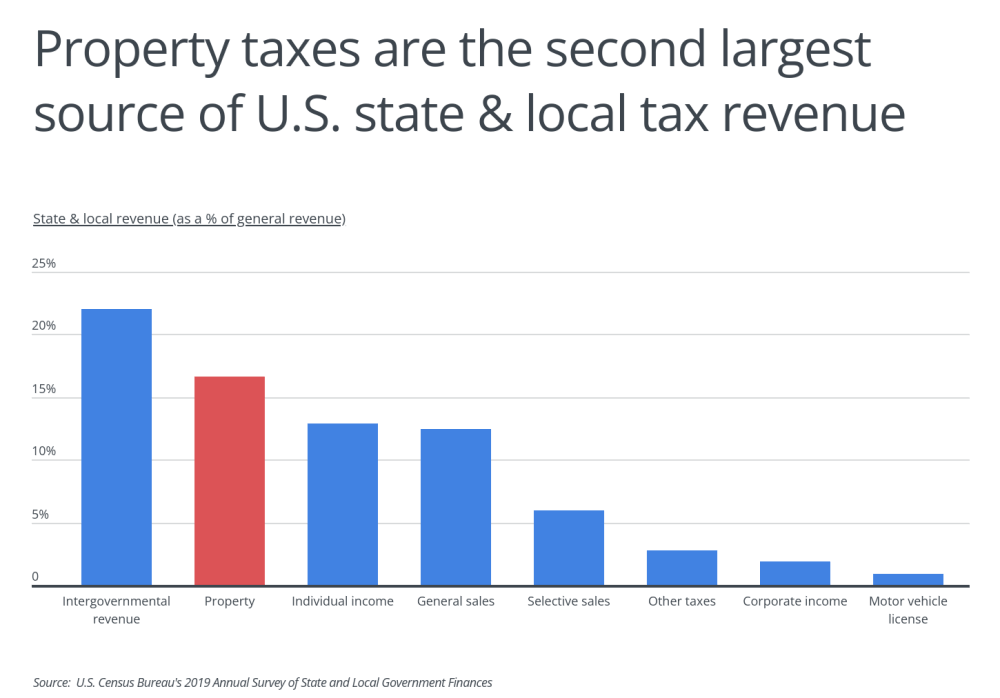
Property taxes’ stability could help continue to protect state and local budgets if the U.S. is headed toward a recession in the near future. Property tax collections represent 16.6% of state and local general tax revenues, which makes it the largest form of “own-source” revenue generated by states and localities, ahead of individual income (12.9%) and general sales taxes (12.5%). And among all revenue sources, property tax trails only intergovernmental funds (22%), which comprises funds transferred from one government to another (most frequently federal to state or local) through grants, loans, and other agreements.
However, the overall mix of state and local revenue sources looks different across the U.S. Each state and local government offers a unique collection of revenue sources that weights income, sales, property, and other taxes differently. For example, nine states have no state income tax, while five have no state sales tax. Others have caps on property tax rates or restrictions around how property valuations are conducted that limit the amount of revenue from property taxes. This means that individuals’ specific tax burdens will look different depending on what state and local tax laws are in place where they live.
LEARN MORE
If you need to add an outlet, install or update a circuit breaker, add outdoor lighting, or complete some other electrical project in your home, you’ll need to find an electrician. Let us help you find the best local electricians near you.
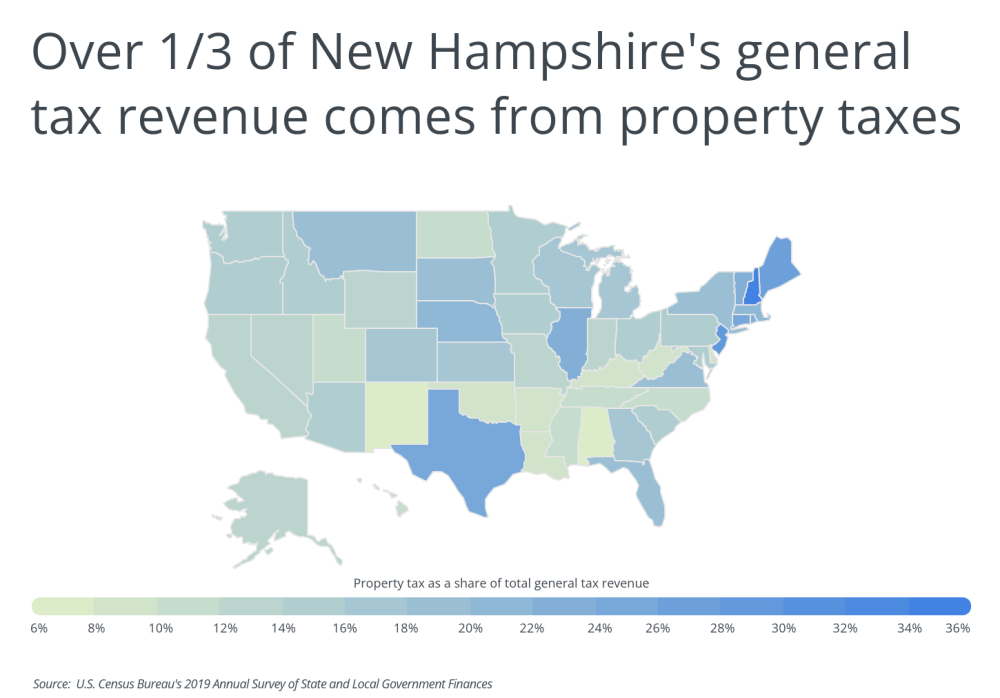
Property tax collections across the states show these differences in action. At the low end, only 6.9% of general tax revenue collected in Alabama comes from property tax, while at the high end, property tax is 36.5% of general tax revenue in New Hampshire. New Hampshire stands out in part because the state has neither an income nor a sales tax, so many services are funded at the local level through property taxes. Many of the other locations highly dependent on property taxes are nearby Northeastern states including New Jersey, Maine, and Connecticut.
The data used in this analysis is from the U.S. Census Bureau’s 2019 Annual Survey of State and Local Government Finances. To determine the states that collect the most property tax revenue, researchers at Porch calculated property tax revenue as a share of total general tax revenue. In the event of a tie, the state with the greater annual property tax revenue per capita was ranked higher.
Here are the states that collect the most property tax revenue.
States That Collect the Most Property Tax Revenue

Photo Credit: Mihai_Andritoiu / Shutterstock
15. Montana
- Property tax as a share of total general tax revenue: 18.0%
- Annual property tax revenue (per capita): $1,717
- Annual property tax revenue (total): $1,835,479,000
- Annual general tax revenue (total): $10,222,926,000
DID YOU KNOW?
When it comes to dealing with electrical work or plumbing, a handyman can tackle smaller, everyday tasks, while larger, more involved projects will require a licensed contractor. Porch can help you find a reliable handyman at the best price.

Photo Credit: John S. Quinn / Shutterstock
14. Virginia
- Property tax as a share of total general tax revenue: 18.0%
- Annual property tax revenue (per capita): $1,770
- Annual property tax revenue (total): $15,109,680,000
- Annual general tax revenue (total): $83,725,329,000

Photo Credit: Henryk Sadura / Shutterstock
13. Florida
- Property tax as a share of total general tax revenue: 18.1%
- Annual property tax revenue (per capita): $1,454
- Annual property tax revenue (total): $31,227,441,000
- Annual general tax revenue (total): $172,783,607,000

Photo Credit: Jacob Boomsma / Shutterstock
12. South Dakota
- Property tax as a share of total general tax revenue: 18.8%
- Annual property tax revenue (per capita): $1,532
- Annual property tax revenue (total): $1,355,624,000
- Annual general tax revenue (total): $7,205,443,000

Photo Credit: Ingus Kruklitis / Shutterstock
11. New York
- Property tax as a share of total general tax revenue: 18.9%
- Annual property tax revenue (per capita): $3,180
- Annual property tax revenue (total): $61,857,624,000
- Annual general tax revenue (total): $327,909,409,000

Photo Credit: Shawn Dorsey / Shutterstock
10. Nebraska
- Property tax as a share of total general tax revenue: 20.4%
- Annual property tax revenue (per capita): $2,013
- Annual property tax revenue (total): $3,893,168,000
- Annual general tax revenue (total): $19,086,993,000

Photo Credit: Christian Delbert / Shutterstock
9. Massachusetts
- Property tax as a share of total general tax revenue: 20.8%
- Annual property tax revenue (per capita): $2,590
- Annual property tax revenue (total): $17,854,301,000
- Annual general tax revenue (total): $85,813,381,000

Photo Credit: Sean Pavone / Shutterstock
8. Rhode Island
- Property tax as a share of total general tax revenue: 22.0%
- Annual property tax revenue (per capita): $2,526
- Annual property tax revenue (total): $2,676,164,000
- Annual general tax revenue (total): $12,180,352,000

Photo Credit: f11photo / Shutterstock
7. Illinois
- Property tax as a share of total general tax revenue: 23.1%
- Annual property tax revenue (per capita): $2,338
- Annual property tax revenue (total): $29,632,145,000
- Annual general tax revenue (total): $128,418,079,000

Photo Credit: Sean Pavone / Shutterstock
6. Vermont
- Property tax as a share of total general tax revenue: 23.9%
- Annual property tax revenue (per capita): $2,938
- Annual property tax revenue (total): $1,833,211,000
- Annual general tax revenue (total): $7,665,670,000

Photo Credit: nektofadeev / Shutterstock
5. Texas
- Property tax as a share of total general tax revenue: 24.0%
- Annual property tax revenue (per capita): $2,098
- Annual property tax revenue (total): $60,826,579,000
- Annual general tax revenue (total): $253,819,166,000

Photo Credit: f11photo / Shutterstock
4. Connecticut
- Property tax as a share of total general tax revenue: 25.8%
- Annual property tax revenue (per capita): $3,215
- Annual property tax revenue (total): $11,463,831,000
- Annual general tax revenue (total): $44,454,140,000

Photo Credit: Sean Pavone / Shutterstock
3. Maine
- Property tax as a share of total general tax revenue: 26.8%
- Annual property tax revenue (per capita): $2,772
- Annual property tax revenue (total): $3,726,532,000
- Annual general tax revenue (total): $13,903,942,000
TRENDING
While prospective homebuyers might easily notice worn-out light switches, door dents, and floor scratches, a good home inspection—conducted by a professional home inspector—could reveal hidden and more expensive structural issues.

Photo Credit: Sean Pavone / Shutterstock
2. New Jersey
- Property tax as a share of total general tax revenue: 28.7%
- Annual property tax revenue (per capita): $3,513
- Annual property tax revenue (total): $31,200,180,000
- Annual general tax revenue (total): $108,751,702,000

Photo Credit: RaulCano / Shutterstock
1. New Hampshire
- Property tax as a share of total general tax revenue: 36.5%
- Annual property tax revenue (per capita): $3,246
- Annual property tax revenue (total): $4,413,670,000
- Annual general tax revenue (total): $12,099,243,000
Detailed Findings & Methodology
The data used in this analysis is from the U.S. Census Bureau’s 2019 Annual Survey of State and Local Government Finances. To determine the states that collect the most property tax revenue, researchers at Porch calculated property tax revenue as a share of total general tax revenue. In the event of a tie, the state with the greater annual property tax revenue per capita was ranked higher.