
There’s a lot to consider when it’s time to move. Where does the average American go, and why? Who are they leaving behind, and what are their motivations? Using data representative of the entire U.S. population from the Current Population Survey, we were able to analyze what exactly moves Americans today.
Perhaps you’re thinking of moving. Maybe you need to relocate due to a job offer or you just want to be closer to your family. Whatever your moving motivations, you’ll want to continue reading to see what we found within the data.
Monitoring Moves
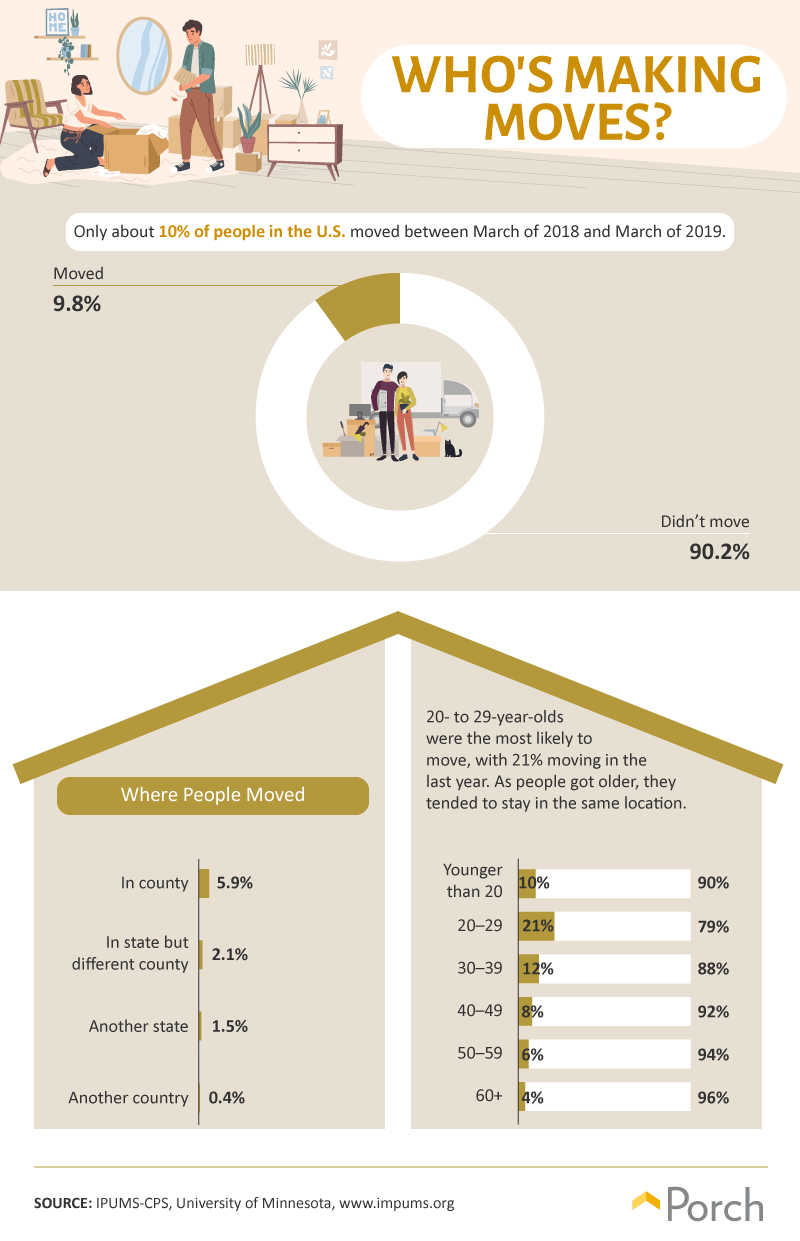
Only about 1 in 10 people in the U.S. chose to move last year. By and large, people stayed put. Although this may suggest satisfaction with their current environment, it may also indicate how difficult it is to move overall. After all the average cost of moving can be anywhere from, $660 to do it yourself to upwards of $2,500 with a full moving team. Then, there are the things you can’t put a price tag on: friendships, children, and quality education, among other moving considerations.
Evidently, millennials had the fewest ties to a specific location, as those aged between 20 and 29 were the most likely to move last year. As people got older, they tended to stay in the same location.
Americans who moved stayed in the state (1.5%) and even in the same county (5.9%). Another 2.1% stayed in the same state but switched counties.
Moving Ebbs and Flows
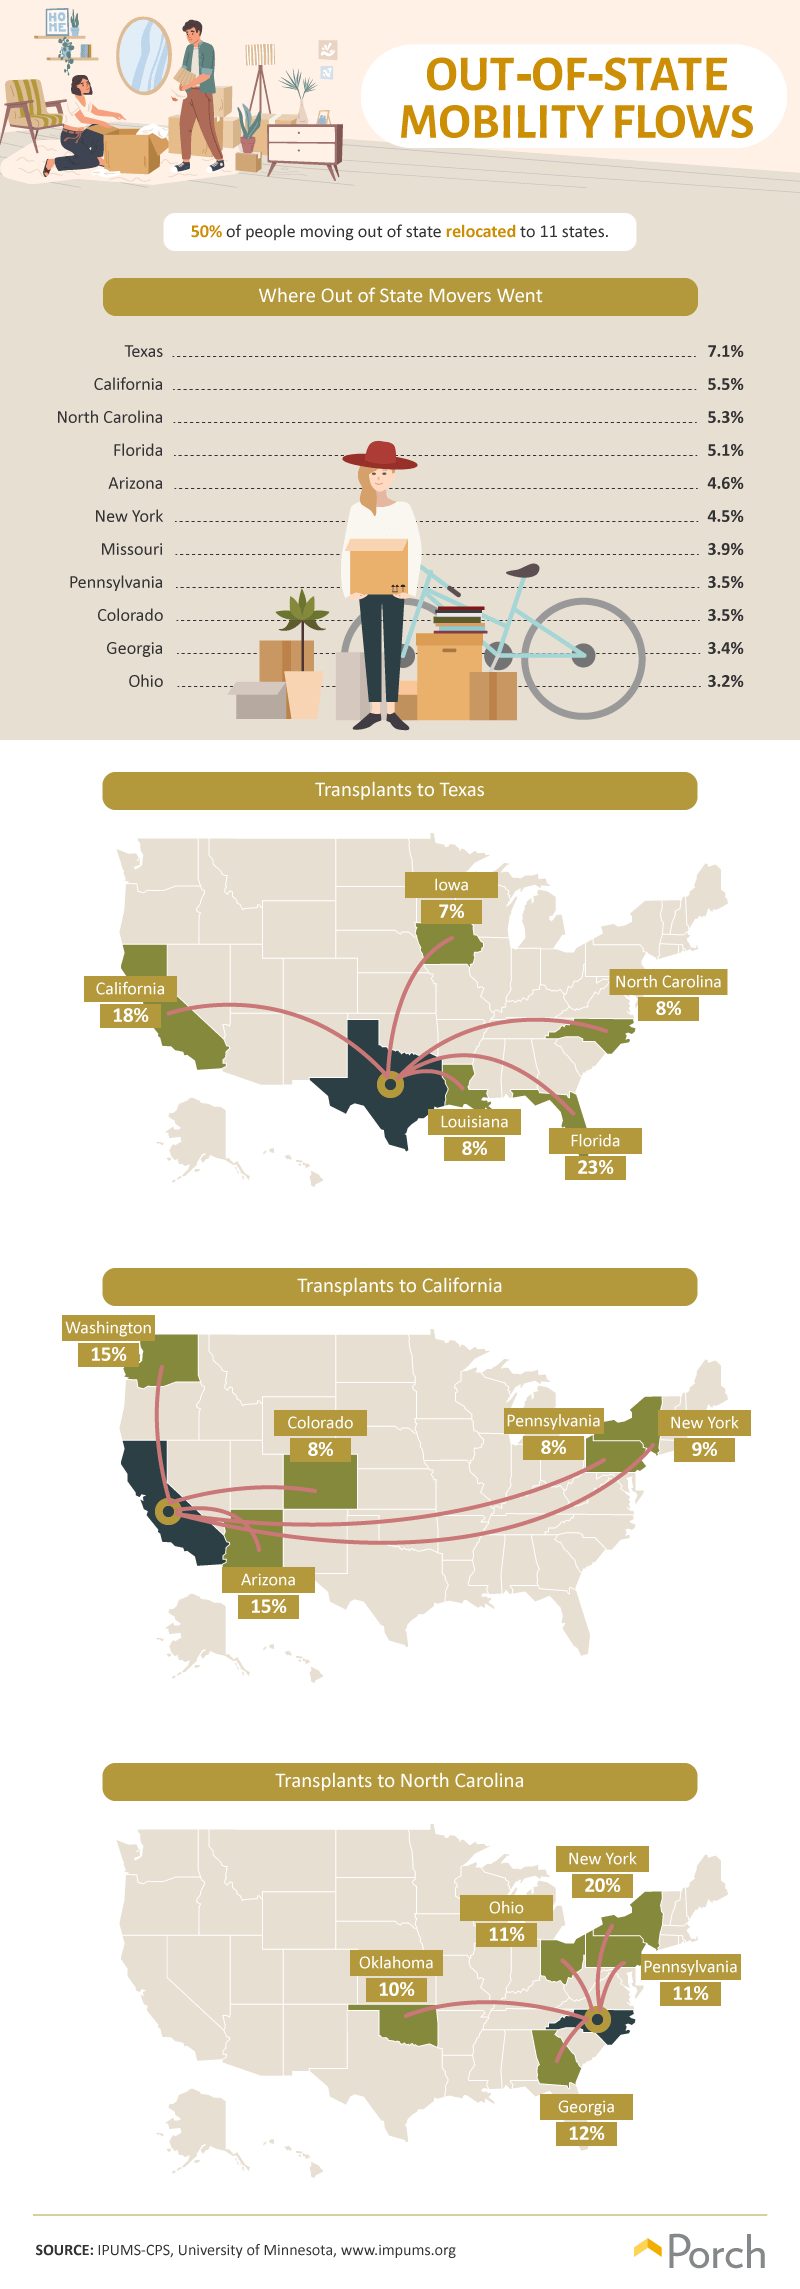
Half of all people moving in the U.S. relocated to just 11 states.
Texas was the No. 1 state that Americans relocated to last year, often coming from California (18%), Florida (23%), North Carolina, and Louisiana (8% each). Some may have moved due to Texas’ low cost of living, perhaps others for the delicious barbeque.
California, the second state with the most transplants, is famous for many things. Its size, natural features, and sprawling cities call to many people. The call to move to California, however, was heard most loudly in Arizona, Washington (15% each), and New York (9%).
Meanwhile, North Carolina was most often sought by former residents of New York (20%) and Georgia (12%). New York has some of the highest costs of living in the country, while North Carolina offers increasing job opportunities and possibly greener pastures than the Empire State. North Carolina also offers a more temperate climate, as well as great educational opportunities for students and families.
Reasons for Relocation

So why do people choose to pick up their things and move? Most often, respondents just wanted an upgrade to their house. Seventeen percent moved because they desired new or better housing. Another 6.7% felt they needed cheaper housing.
Family-related concerns were also shared by 26.8% of people relocating. More specifically, they wanted to establish their own households (11.4%). An additional 5% relocated as a result of changes in marital status. Perhaps the 18% decrease in divorce rates is helping to prevent divorce-based moving decisions.
Employment was, of course, mentioned. Twelve percent moved as a result of a new job or transfer situation, 6% wanted to shorten their commutes. By some estimates, a commute can incur a cost of $25 per hour in lost wages, so moving closer to the office can significantly cut back on daily transportation costs.
Movers and Shakers

Housing-oriented moves, although popular, were disproportionately common among in-state relocations. Wanting better or more affordable housing got people packing, but not across state borders. New employment opportunities, however, drove Americans out of state 47% of the time and even frequently sent them abroad. With poor personal savings rates across the country, a new job opportunity might not be possible to turn down, even if it is a long way from home. On the other hand, moving for a new job might be just the type of excitement that job applicants are looking for.
Moves abroad were more mysterious, with quite a number of people having miscellaneous reasons for leaving the U.S. Some left the country because they needed a change in climate, while others (although fewer) were forced to leave their homes due to a natural disaster. In fact, there were over 1.2 million displacements from natural disasters in the U.S. in 2018. While moving to another country can certainly be exciting, it’s likely far more daunting if the move is forced.
Moving Along
Although moving is a personal choice, our data analysis revealed moving trends in America. Most were chasing new jobs or new houses, and very few looked to leave the U.S for another country. No matter how much you love your house, however, you’ll probably need or want to move at some point.
And while the data can help educate people who want to move, it won’t get the job done. If you are looking to move (or even have to move items that require an extra helper or two), visit Porch.com. Whether you’re in need of labor, trucks, unloading, or packing, the help you need can be organized with a few clicks of a button. Visit Porch to find a trustworthy hand today.
Methodology and Limitations
We used the IPUMS current population data to explore where people moved from 2018 to 2019. The variables we pulled were:
- YEAR (Survey year)
- SERIAL (Household serial number)
- MONTH (Month)
- CPSID (CPSID, household record)
- ASECFLAG (Flag for ASEC)
- ASECWTH (Annual social and economic supplement household weight)
- REGION (Region and division)
- STATEFIP (State (FIPS code))
- STATECENSUS (State (Census code))
- PERNUM (Person number in sample unit)
- CPSIDP (CPSID, person record)
- ASECWT (Annual social and economic supplement weight)
- AGE (Age)
- SEX (Sex)
- RACE (Race)
- MARST (Marital status)
- OCC (Occupation)
- IND (Industry)
- EDUC (Educational attainment recode)
- INCWAGE (Wage and salary income)
- POVERTY (Original poverty status (PUMS original))
- MIGSTA1 (State of residence one year ago)
- WHYMOVE (Reason for moving)
- MIGRATE1 (Migration status, one year)
We weighted all data using the variable “ASECWT.” You can read more about the variables here: cps.ipums.org/cps/codebooks.shtml#asec_codebooks
Data here may be different from summarized census tables due to a number of factors, such as exclusions by the census, grouping, and other analysis habits used by the census. The data used in this project were raw survey results.
Fair Use Statement
Happen to be among the 10% of Americans moving? Even as 90% stay put, you’re welcome to share this data, so long as it’s for noncommercial purposes, and you link back to this page so that its contributors receive proper credit for their work.