Sale prices and payment sources
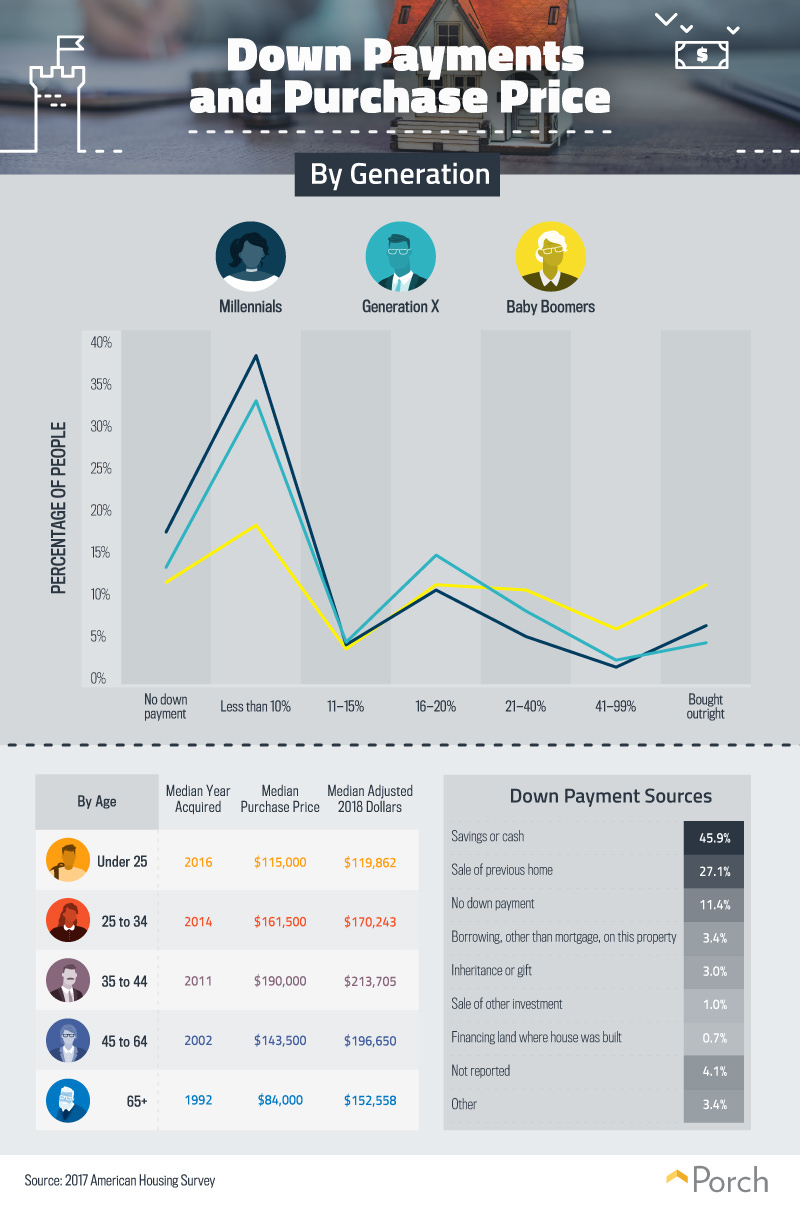
 When purchasing a home, what percentage of the total price do buyers in each age group typically provide as a down payment? Our findings suggest that most of millennials and nearly half of Gen Xers put down either no money or less than 10 percent when buying their homes, and even 19 percent of baby boomers belonged to this category. Traditionally, consumers have been advised to aim for 20 percent down payments, a figure tied to thresholds determined by government-sponsored mortgage companies such as Fannie Mae and Freddie Mac. Homeowners who invest less up front are required to obtain private mortgage insurance, significantly increasing their costs each month. Additionally, many buyers utilize Federal Housing Administration loans, which enable borrowers to purchase homes with as little as 3.5 percent down if they meet certain income and credit history requirements. Forty-six percent of individuals reported making down payments from their personal savings or cash. Another 27 percent used the proceeds from the sale of their previous home— a process that can require strategic timing for individuals seeking to move directly between properties. Gifts or inheritance money were a rarer form of down payment source, with merely 3 percent of buyers able to purchase a home through another’s generosity. Perhaps this practice would be more common if there were fewer legal constraints on gifted down payments: It’s actually illegal to repay such gifts over time, and the process entails extensive documentation. In terms of total purchase price, individuals aged 35 to 44 spent the most on their homes in inflation-adjusted 2018 dollars, followed by the 45 to 64 age group. Perhaps these figures reflect the needs of middle-aged parents. Children need bedrooms, and bigger homes equate to larger prices. Conversely, millennials are waiting longer than their elders to have children—meaning they may be purchasing less expensive homes well-suited to just one or two people. Some experts fear that the suburban mansions beloved by baby boomers will fail to appeal to millennials, creating a glut in large houses in the years ahead.
Home value variation
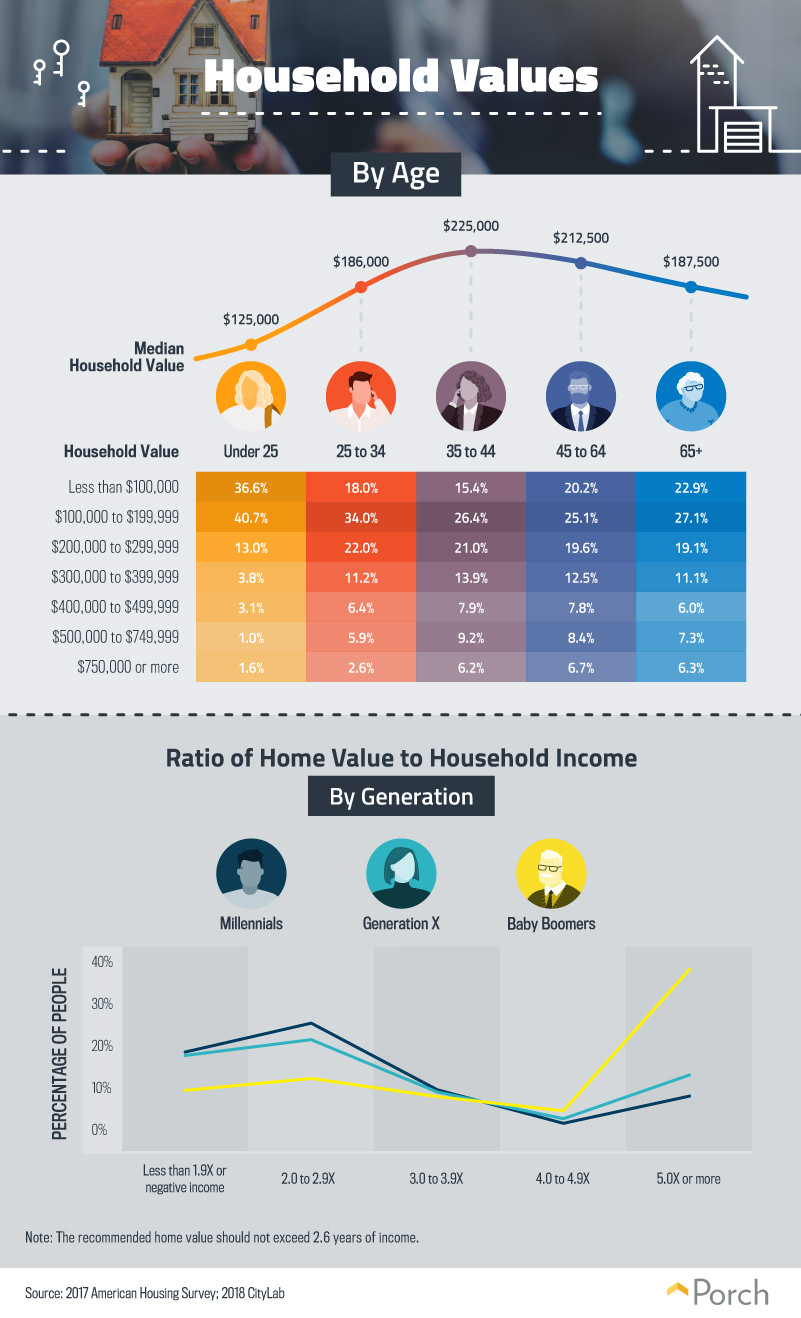
 In recent years, researchers have called attention to a potentially concerning trend: The ratio of average home prices to median household income has hit historic highs. These trends are attributable to several macroeconomic factors, including nationwide wage stagnation and particularly high home prices in desirable urban markets. Our analysis indicates that most buyers are not purchasing unreasonably expensive homes relative to their annual earnings. For a majority of each age group, the price of their home was less than four times their household income. Yet, there were many with more concerning home value-to-income ratios: For 12 percent of millennials and 16 percent of Gen Xers, the value of their home was at least five times household earnings. Among baby boomers, 38 percent had a home worth at least five times what they earned annually. This may be because many baby boomers are retired, living on fixed incomes in homes they paid off long ago. However, recent data suggest that housing debt is more common among baby boomers than for the generation before them, meaning many will face difficult financial choices in retirement. For every age group, the most common home value range was $100,000 to $199,000. Yet, a substantial contingent, especially among middle-aged individuals, owned considerably more expensive properties. Among those in the 35 to 44 and 45 to 64 age groups, the median home value was well above $200,000, and roughly 15 percent each owned homes worth $500,000 or more. Of course, home values are best understood in relative terms: While spending several hundred thousands on a house may seem unthinkable to some, many cities boast average home values in excess of $1 million.
Earnings by age range
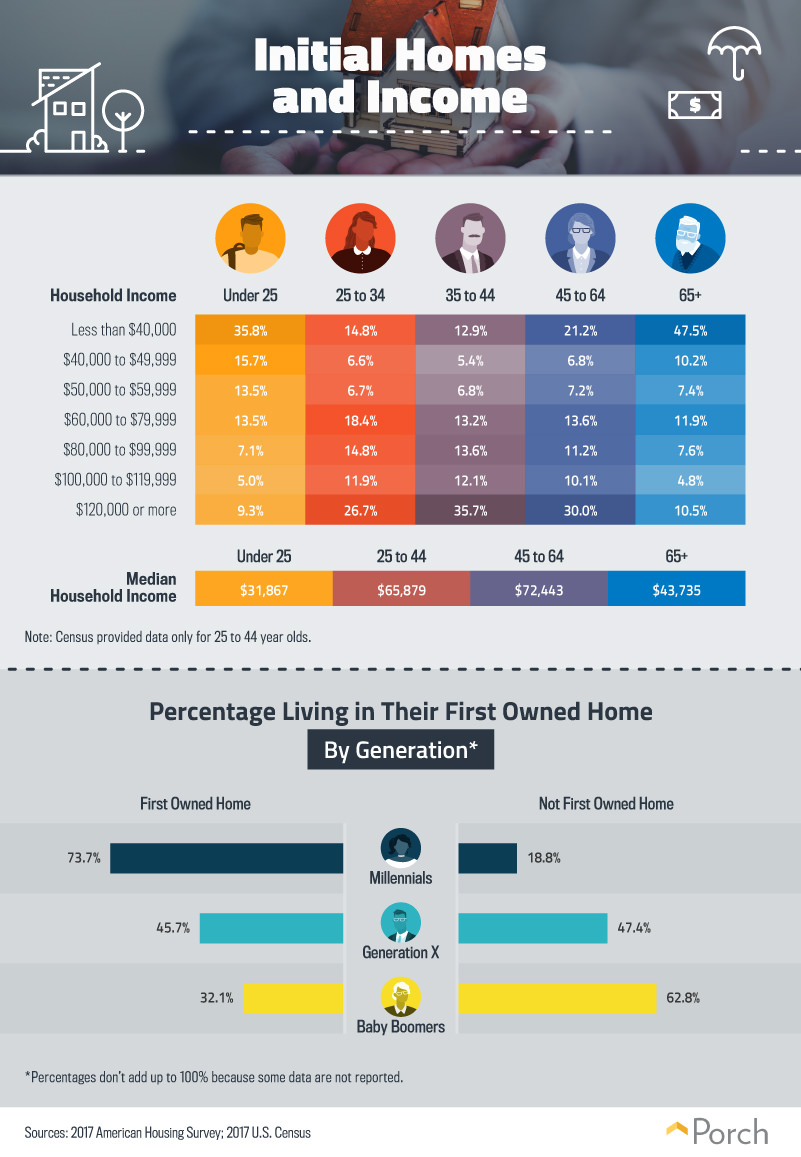
 Delving deeper into the earnings of homeowners in each age group, we find that many earn less than the national median household income ($61,372 in 2017). Among individuals aged 65 and older, roughly half earned less than $40,000 annually, likely because many of them are retired or solely working part time. At the other end of the age continuum, over a third of homeowners under 25 had household incomes lower than $40,000. This finding is roughly consistent with earnings in this age group more generally: The median annual income for individuals aged 20 to 24 is $27,300. A significant portion of homeowners earned far more, however: Between the ages of 25 and 64, at least a quarter of homeowners had household incomes of $120,000 or more. Many experts say the nationwide housing market is vastly skewed toward this fortunate minority, particularly in major metropolitan areas. In many cases, modest housing has been razed and replaced with higher-priced new construction buildings. In others, developers saddled with rising costs can only derive profits from luxury homes, so affordable housing stock remains scarce. Even if their incomes are relatively low, younger individuals may seek to buy a first home and upgrade subsequently. Indeed, nearly three-quarters of millennial homeowners reported their current home was their first. Among Gen Xers, nearly 46 percent said their current abode was their first, but approximately the same percentage said they’d owned a different property previously. Conversely, two-thirds of baby boomers said they’d owned another residence before.
Responsible investment—at any age or income
Our findings indicate some reason for concern within the wider housing market, such as the substantial percentage of individuals purchasing homes with small down payments. Additionally, a considerable portion of Americans own property worth several times their annual household incomes, leaving them potentially vulnerable to financial calamity. Yet, our findings also demonstrate a larger pattern of responsible borrowing and repayment, with most individuals choosing modestly priced homes over mansions. Moreover, millennials seem to be entering the housing market on their own terms, with relatively high incomes to support their investments. Of course, each home purchase involves a complex mix of contextual factors, and it can be tough to evaluate buying decisions in abstract terms. From choosing a location to potential renovations, homeowners must make responsible decisions that align with their particular ambitions. Sometimes, that means improving a great property incrementally, turning a fixer-upper into your dream home over time. And that’s where Porch comes in, connecting you to trusted home improvement professionals in your area. From easy quotes to extensive project guides, we offer the resources you need to inject any property with personality—whether you bought it years ago or yesterday.
Methodology and limitations
We utilized the U.S. Census Bureau and U.S. Department of Housing and Urban Development’s (HUD) 2017 American Housing Survey (AHS) to produce the results found in this study. The data only provide age ranges, and therefore, our generation classifications (millennials, Generation X, and baby boomers) are approximate, and there are some overlaps between them:
- Millennials consisted of under 25 years old, 25 to 29 years old, and 30 to 34 years old
- Gen Xers consisted of 35 to 44 years old and 45 to 54 years old
- Baby boomers consisted of 55 to 64 years old, 65 to 74 years old, and 75 years and older
Additionally, the household income and home value figures were bucketed together. For 2015, the HUD and the U.S. Census Bureau selected an entirely new sample for the AHS. In 2017, the AHS visited the same housing units (HUs) selected in the 2015 sample. Additionally, AHS selected newly constructed HUs from a sample using a similar design that selected the 2015 sample. The AHS sample is composed of an Integrated National Sample and Independent Metropolitan Area Samples. The Integrated National Sample is described as integrated because it incorporates a few different types of samples. The Integrated National Sample includes:
- A representative sample of the nation
- A representative oversample of each of the 15 largest metropolitan areas
- A representative oversample of HUD-assisted housing units
The Integrated National Sample was interviewed between June 26 and Oct. 30, 2017. For the 2017 AHS Integrated National Sample, 84,879 sample housing units were selected for interview.
Sources
- https://www.cnbc.com/2018/07/09/these-are-the-reasons-why-millions-of-millennials-cant-buy-houses.html
- https://www.usatoday.com/story/money/2018/05/07/millennials-buying-first-home-skip-starter-house-buy-dream/582309002/
- https://www.cbsnews.com/news/housings-big-problem-boomers-arent-downsizing/
- https://www.census.gov/programs-surveys/ahs.html
- http://www.jchs.harvard.edu/blog/price-to-income-ratios-are-nearing-historic-highs/
- https://www.reuters.com/article/us-usa-mortgages-babyboomers/u-s-baby-boomers-fall-behind-in-paying-off-mortgages-fannie-mae-idUSKBN1CA2GG
- https://www.marketwatch.com/story/the-us-is-about-to-add-even-more-cities-where-the-median-home-value-is-1-million-2018-08-09
- https://www.census.gov/newsroom/press-releases/2018/income-poverty.html
- https://www.cnbc.com/2017/08/24/how-much-americans-earn-at-every-age.html
- https://www.huffingtonpost.com/entry/housing-crisis-inequality-harvard-report_us_5b27c1f1e4b056b2263c621e
Fair use statement
This project presents data from a wide array of income and age ranges, and we hope it will find an equally broad audience. For this reason, we welcome you to share our work with others for any noncommercial purpose. When you do, please link back to this page to attribute us appropriately and let other readers explore the full project.
