A sinking market
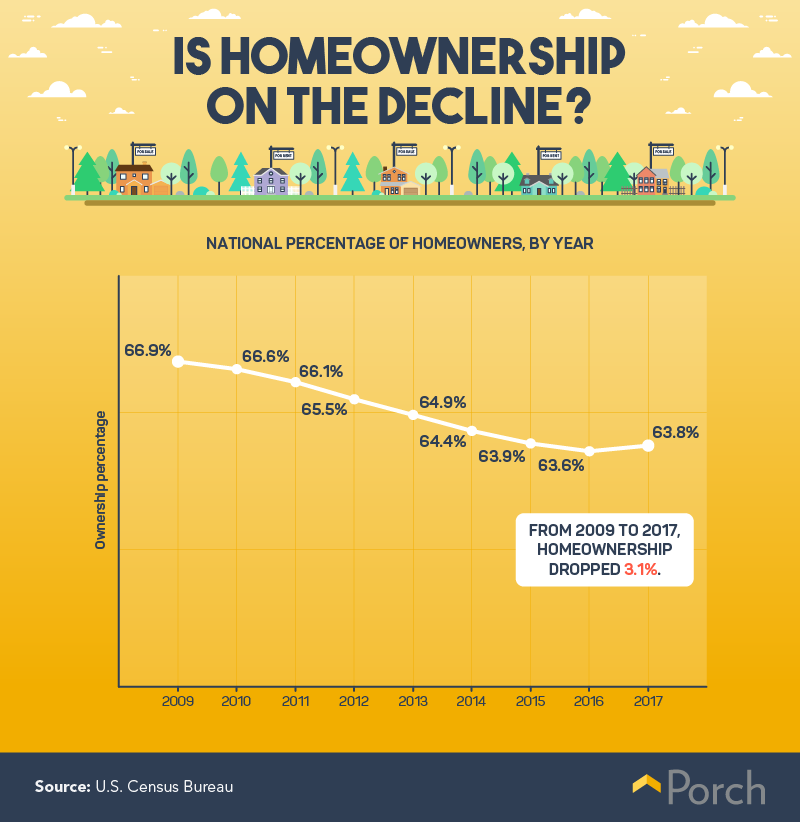 Between 2009 and 2017, the rate of homeownership fell more than 3 percent, starting at 66.9 percent and falling steadily (except for a slight rebound in 2017) to 63.8 percent. While this decrease over eight years might not seem drastic on paper, economists warn that the U.S. housing market is dangerously unhealthy and largely misaligned with the needs of modern buyers. In 2017, there were 8 million more renter-occupied homes compared to 2007, while the average price of homes has only continued to rise. According to one 2018 study, home prices are expected to rise at twice the rate of both inflation and pay. In response, despite lower average 30-year mortgage rates in 2017 compared to 2000, homeownership tenure has more than doubled, growing from less than four years to close to nine years. Ultimately, the prices of homes are too high, and homeowners are moving far less today than in years past.
Homeowners in America
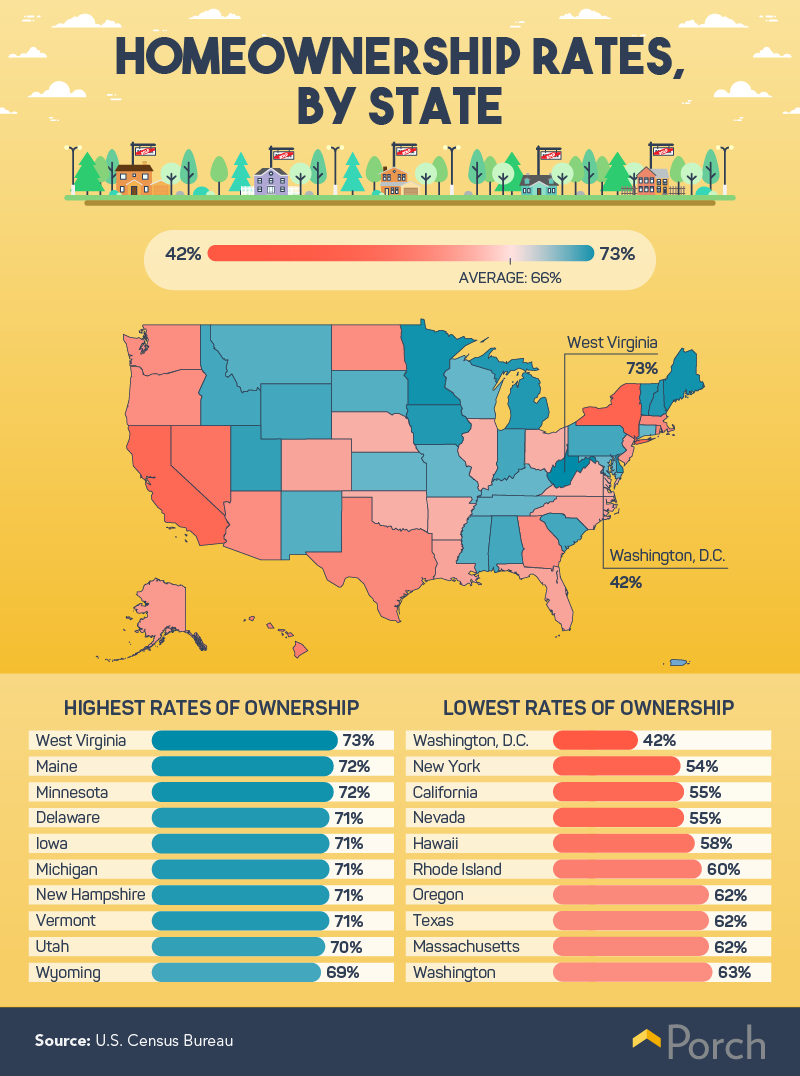 In 2017, 63.8 percent of Americans were homeowners, but states have experienced changes to the housing market differently. We found 73 percent of residents in West Virginia were homeowners in 2017, followed by Maine (72 percent), Minnesota (72 percent), and Iowa (71 percent)—all well above the national average. In contrast, Washington, D.C., had the lowest rate of homeownership (42 percent), followed by New York (54 percent) and California (55 percent). Both New York and California have the highest negative net migration in the U.S., with only 27 percent of homes in New York and 16 percent of homes in California qualifying as affordable for the median family income. Washington, D.C., and several cities in California are often considered among the best places in the U.S. for tech-related jobs, although research suggests employees don’t stay for very long at these companies. Major tech brands like Dropbox, Tesla, and Square maintain employees for roughly two years on average, perhaps contributing to a large volume of residents leaving those areas and resisting homeownership.
Major declines
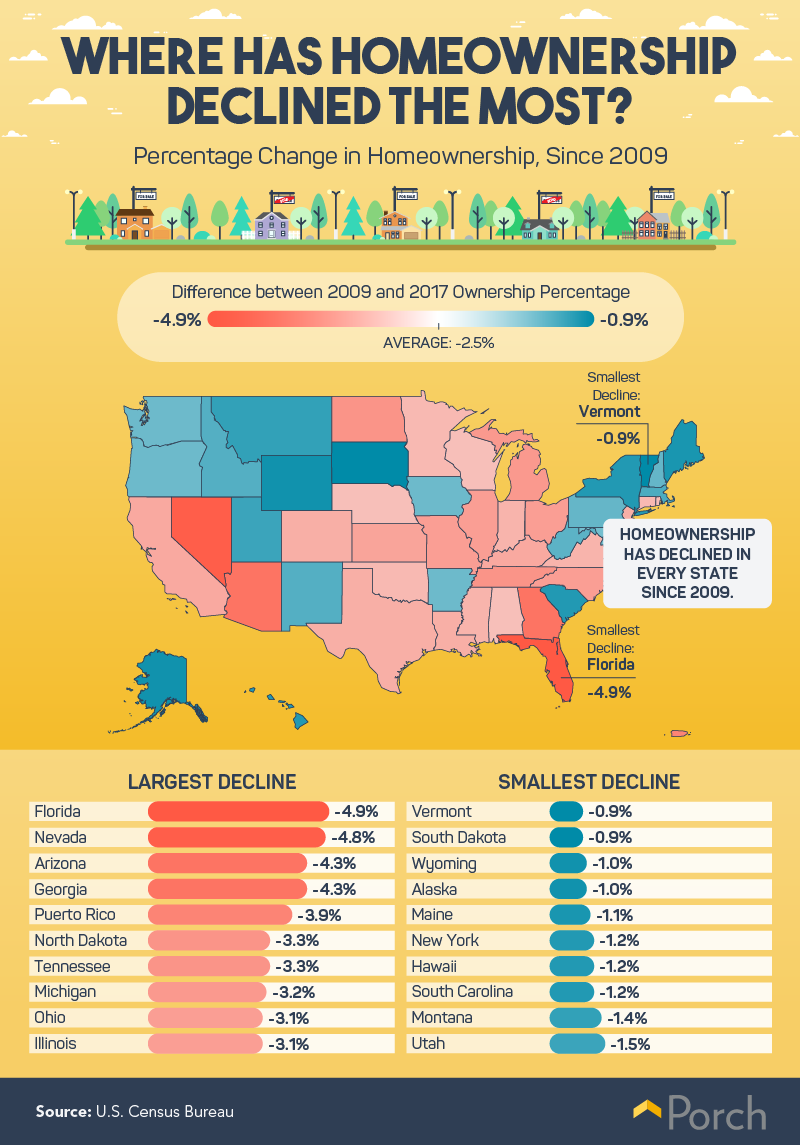 Homeownership has declined in every state (including Washington, D.C.) since 2009, with fluctuations ranging from 0.9 percent to 4.9 percent. Florida may be one of the best places in America for fiscal stability and a relatively healthy economy, but the Sunshine State has seen the largest decrease in homeownership since 2009: 4.9 percent. Florida is known as an ideal location for retirees, but many of its homes have become either too expensive or too big for the average family, perhaps causing more residents to rent rather than own. Nevada (4.8 percent), Arizona (4.3 percent), and Georgia (4.3 percent) also saw a dramatic decrease in homeowners. Vermont (0.9 percent), South Dakota (0.9 percent), Wyoming (1 percent), and Alaska (1 percent) seemed to be the least impacted by the market downturn.
On the basis of income
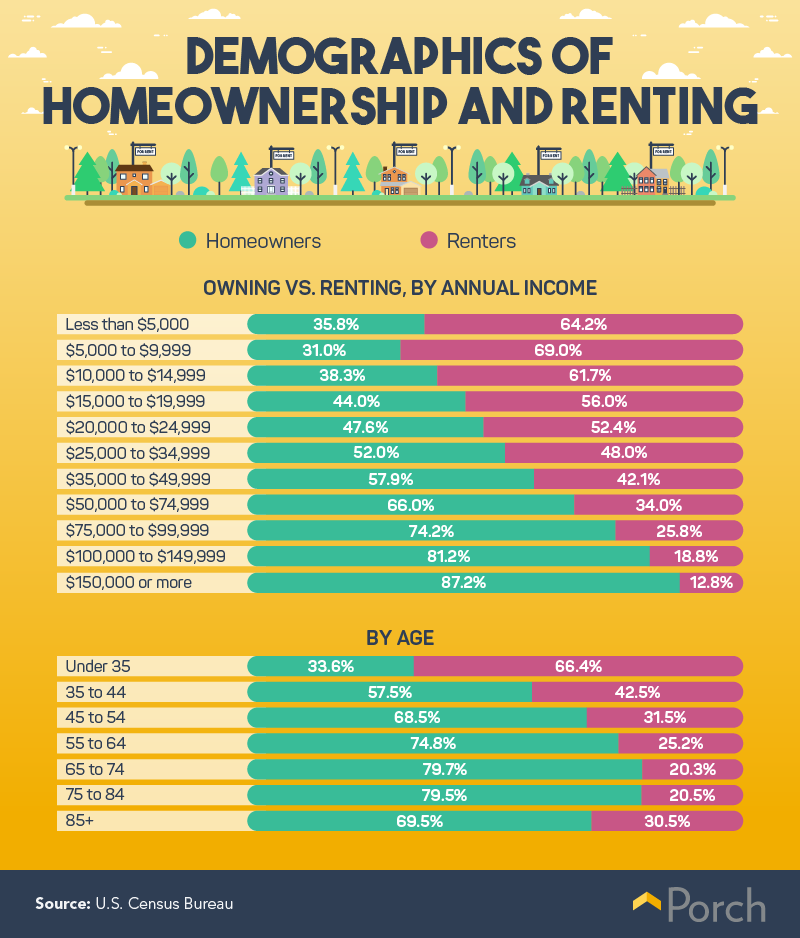 Despite a multitude of programs and grants designed to help first-time homebuyers afford their down payment or achieve a discounted list price, the average household income does impact families’ likelihood of renting or owning a home. In 2017, the average homeownership rate was 63.8 percent; that rate increased significantly among families earning $50,000 or more annually. Compared to those earning between $50,000 and $74,999 (66 percent), more than 4 in 5 families earning $100,000 or more owned at least one home. Millennials may not be the only reason the housing market has seen a rapid decline, but age may contribute to the rate of homeownership in the U.S. Compared to less than 34 percent of people younger than 35 who owned a home, more than half of those over the age of 35—including more than 2 in 3 over the age of 45—owned their home rather than renting.
Cost of Owning
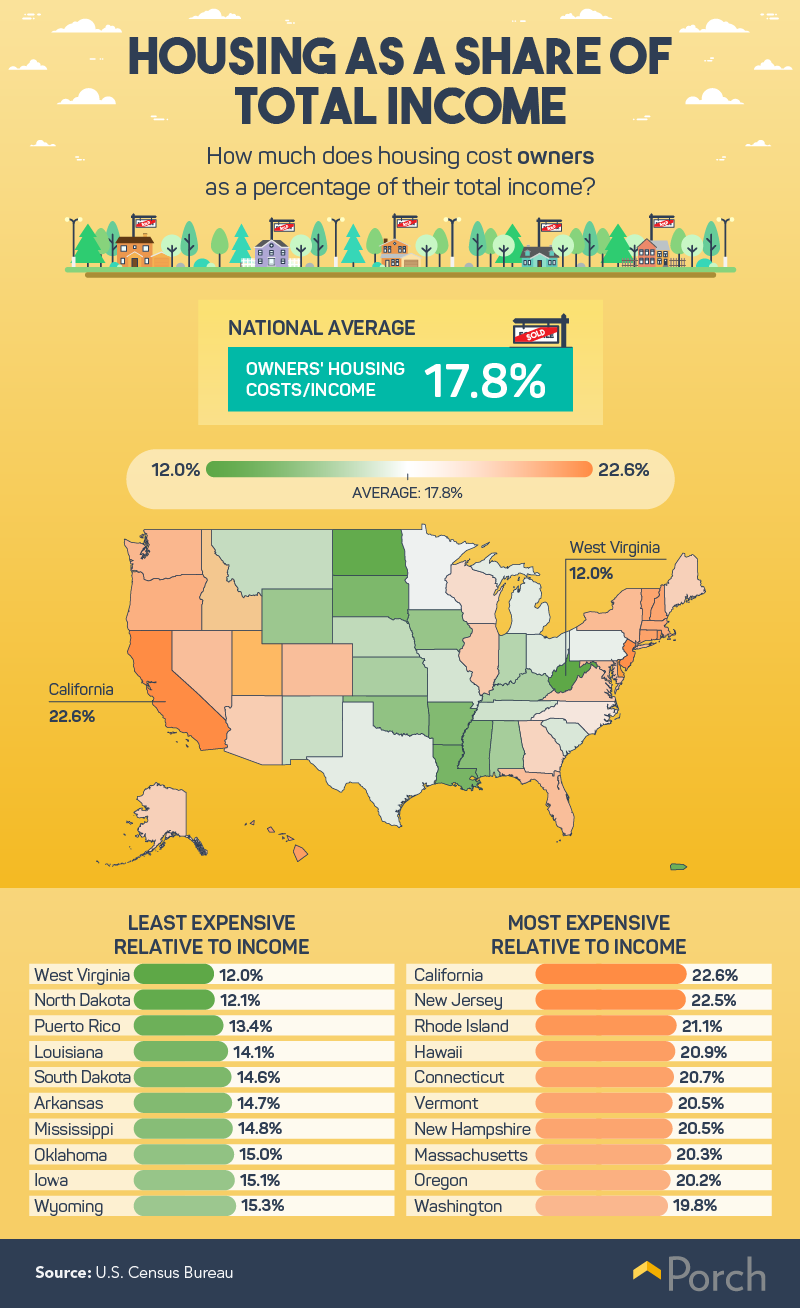 You may have heard that renting instead of buying is like “throwing money away,” but it’s much more complicated than that. In reality, buying a home should only be seen as an investment (and a good investment at that) under very particular circumstances. While renters spent nearly twice their total income on housing compared to people who owned their home—32 percent versus 18 percent—homeownership can cost far more in certain parts of the country. Owning a home in California (nearly 23 percent), New Jersey (over 22 percent), and Rhode Island (21 percent) costs families more of their overall income than any other state in the country. In California, the median price of a single-family home is $549,000, but you could pay more than twice that in some of the state’s busiest cities. In Los Angeles, the median home price is nearly $899,000, and in Silicon Valley, owning a home could cost anywhere from $1,099,000 (San Jose) to $1,400,000 (San Francisco). West Virginia (12 percent) was nearly tied with North Dakota (12.1 percent) when it came to families spending the lowest percentage of their overall income on housing. With a median list price of $159,000 and an average mortgage payment of $847, West Virginia is ranked among states including Iowa, Ohio, and Missouri as some of the best states to be a homeowner.
When renting makes sense
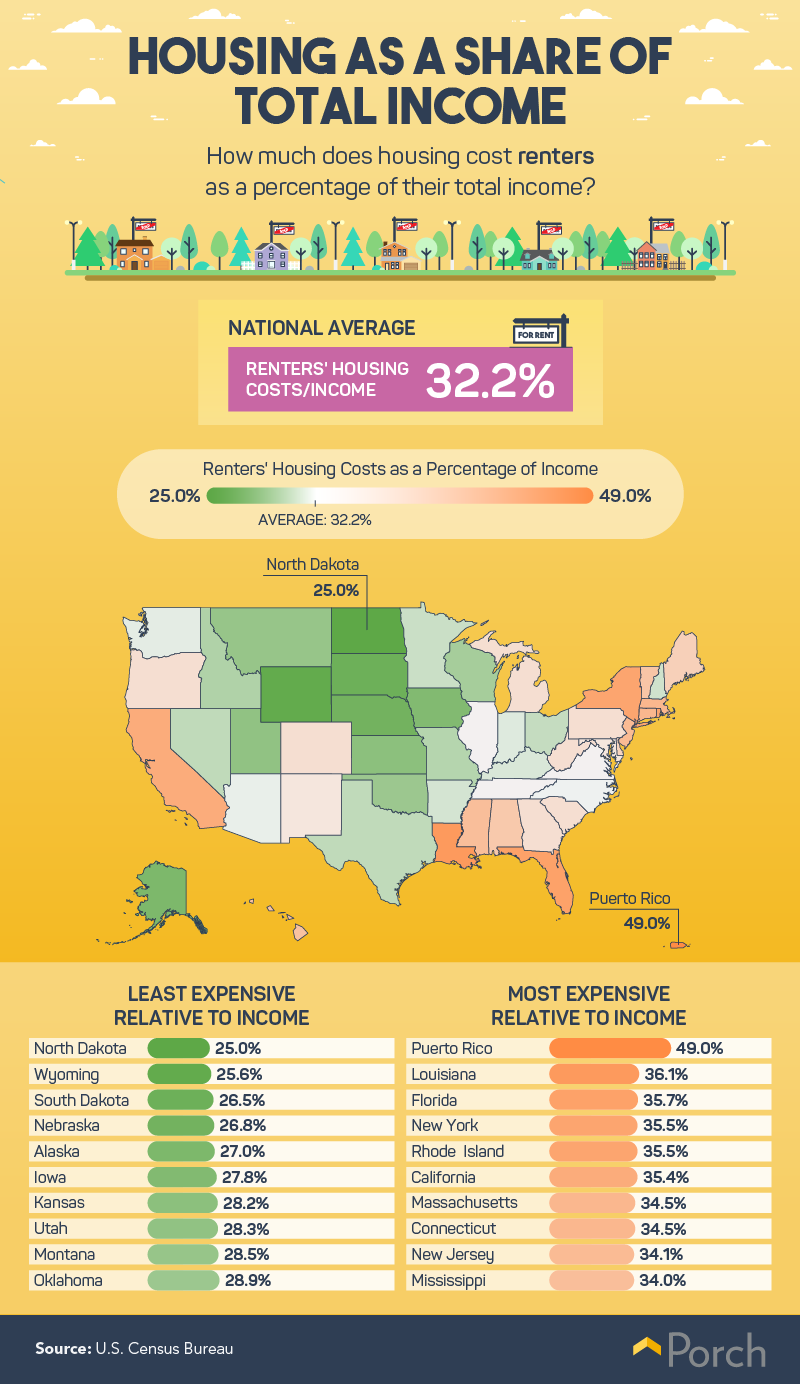 For some people, renting makes more sense. For those who don’t think they’ll live in the same place for very long, who don’t need an excess of space, or aren’t interested in the costly upkeep of homeownership, renting may be a better approach than buying a home. Before you make that decision, though, it may help to understand just how much it will cost you to rent in your state. Residents of Puerto Rico spent 49 percent of their overall income on housing, followed by renters living in Louisiana (36 percent), Florida, Rhode Island, and New York (nearly 36 percent each). In New York City, the second most expense renting market in America, residents pay an average of $2,890 for a one-bedroom apartment, and in Miami, renters pay an average of $1,750.
Housing cost fluctuations
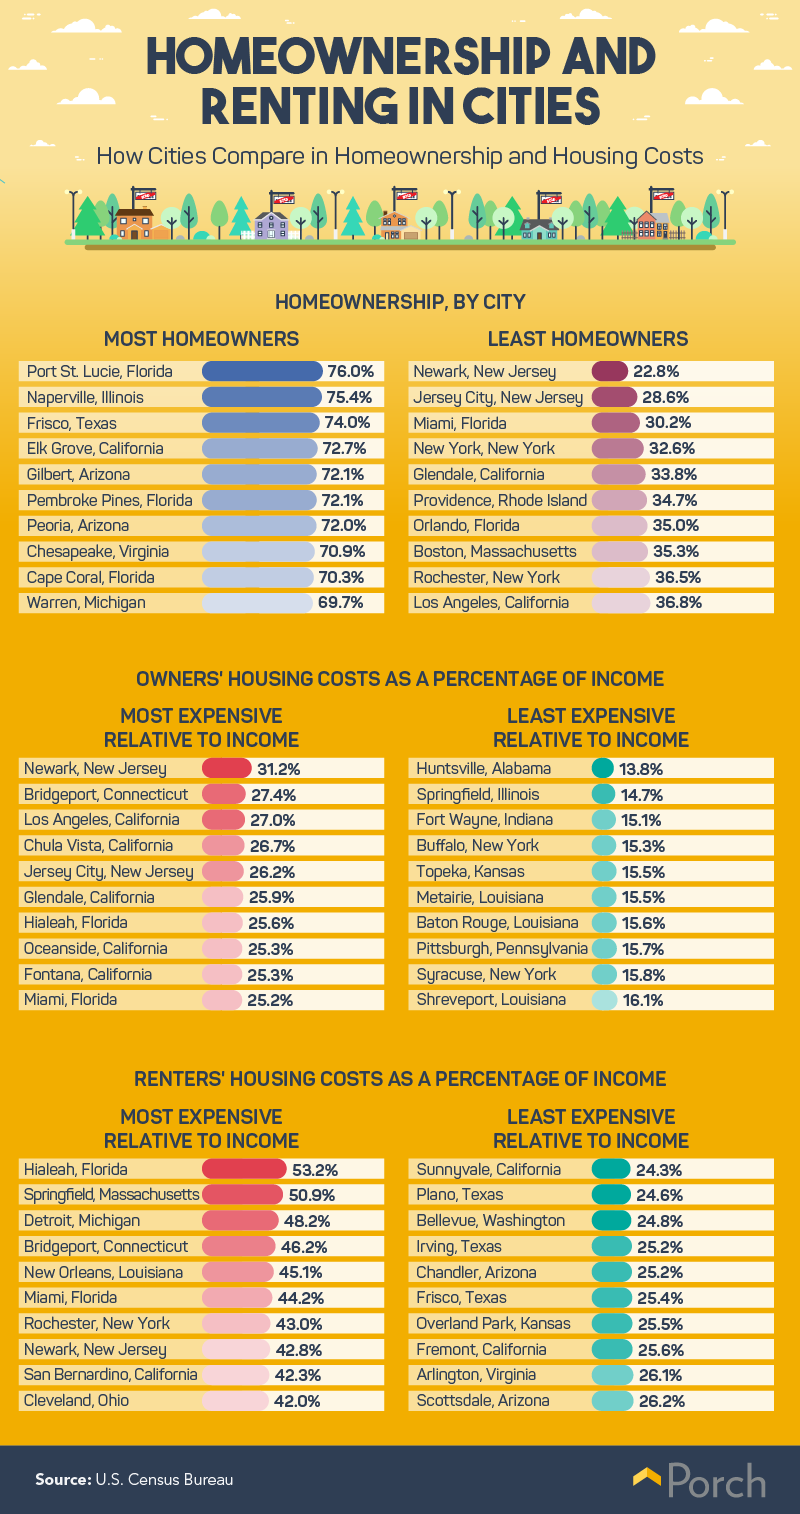 Newark, New Jersey, may be one of the most expensive cities to live in regardless of whether you rent or buy your home. Not only did Newark have the least homeowners (just 22 percent), but those who did spent around 31 percent of their total income on housing, the highest in the U.S. Renting in Newark may not be any more accessible; ranked as the eighth most expensive city for renters in America, the average renter in Newark spent nearly 43 percent of their total income on housing. Other cities that were both the most expensive for owning and renting a home relative to total income included Miami and Hialeah, Florida. In contrast, Huntsville, Alabama (almost 14 percent) and Springfield, Illinois (nearly 15 percent) had the lowest cost of housing relative to income for homeowners, while Sunnyvale, California (24 percent) and Plano, Texas (about 25 percent) were cheapest for renters.
Housing market in flux
The housing market is in a slump—there’s no denying that—but just how bad things have gotten depends very much on where you live in the U.S. As we found, cities and states that have the lowest percentage of homeownership in America may be due to a variety of factors, including the cost of housing, the availability of homes, and the somewhat transient nature of popular industries in the area. And while millennials were the least likely generation to own a home, total income was more likely to determine housing status than age. At Porch, we want to make sure you love the space you’re in from top to bottom. With the Porch Home Assistant, we’ve got your to-do list covered when you need us most. With our Porch Service Pros and extended Porch Pro Network, we’ll help you find the right professional for the job, no matter how big or small. From furniture assembly and pressure washing to building additions and remodeling, your projects are our projects. Visit us to learn more.
Methodology
To compile the data shown above, we used the U.S. Census Bureau’s data on homeownership versus renting rates, housing costs, and income. For any city-based graphics, we considered only cities with at least 50,000 family units. Of course, the census uses estimates to determine its figures that have margins of error—those were not considered in this analysis.
Fair use statement
Want to help take the heat off millennials for “killing” the housing market? Share the results of our study with your readers for any noncommercial use by including a link back to this page in your story.