
Moving is a hassle. From boxing up one home to finding another, facing a move can feel like scaling Mount Everest. It’s no wonder Americans have been moving at decreasing rates since the 1980s. In fact, the moving rate in America reached its lowest in 2018 since 1948, when the U.S. Census Bureau began tracking moving rates.
The hardest part of moving may be finding a new home and neighborhood to love. There are so many factors to consider when shopping for a new home: Is size or cost more important? Does curb appeal matter? Do you want to be closer to work or the grocery store? What neighborhood features will make you feel safest?
We took a deeper look at what prompts people to move and what they look for in a new home or neighborhood when they do so. Then, we broke these findings down by gender and generation to see how men and women across the generations shop for a new home. Read on to see what Americans look for when it’s time to pull up stakes.
Why we move
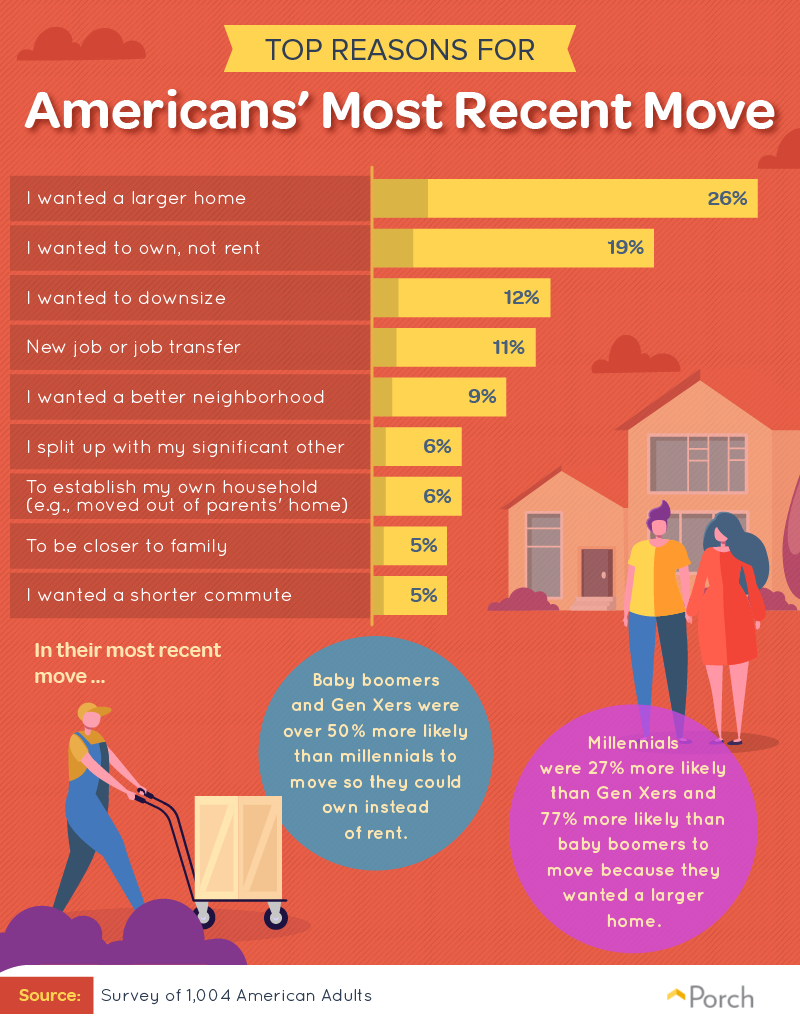
The primary reason people move is to get more space. Over 1 in 4 respondents were prompted by the desire for a larger home. Millennials were particularly keen on bigger homes. In their most recent move, millennials were 27 percent more likely than Gen Xers and 77 percent more likely than baby boomers to move because they wanted a larger home.
Interestingly, baby boomers and Gen Xers moved because they wanted to own rather than rent. Baby boomers and Gen Xers were more than 50 percent more likely than millennials to do so.
Downsizing was another, albeit smaller, reason for moving. And while getting a new job or work transfer prompted over 1 in 10 people to move, few movers made a change just for a shorter commute. They were more likely to move because they split up with their significant other than to get closer to work.
The search for “the one”
Does the reason you choose to move impact how long you’re likely to spend looking for a new home? Possibly.
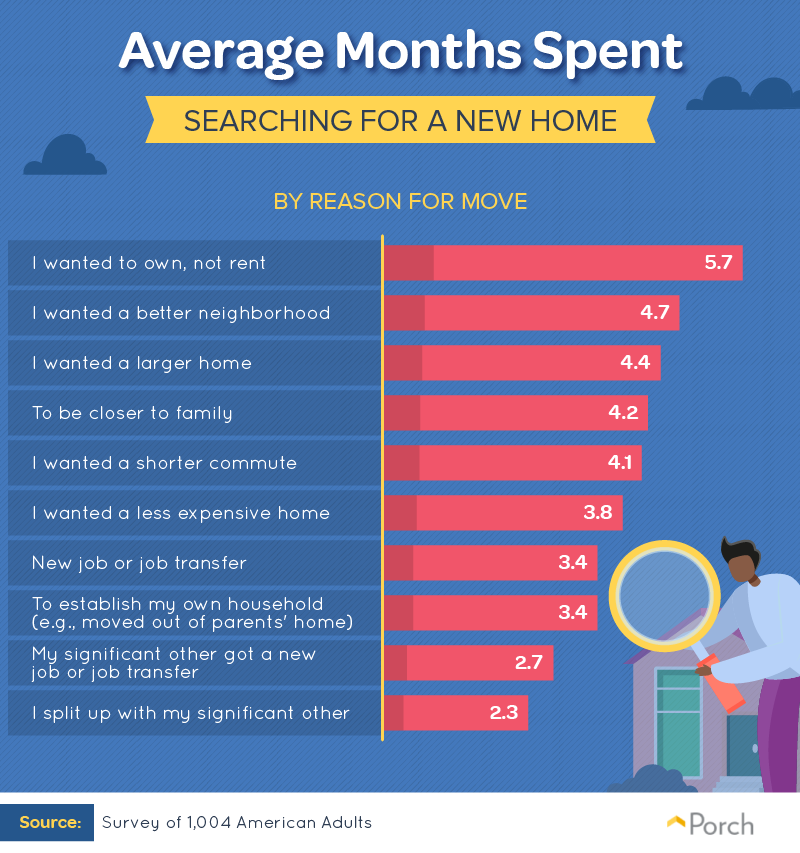
People who transitioned from renting took the most time to find “the one.” These former renters spent 5.7 months, on average, shopping for their perfect home—a month longer than other potential homebuyers.
People who moved to find a better neighborhood spent the second longest time finding their new home at 4.7 months. The quickest shoppers were people moving after a breakup. These shoppers spent just over two months, on average, looking for their next home.
Neighborhood detours
Many people who move stay in the same county, according to the U.S. Census Bureau, but there can be a lot of neighborhoods located in one area. How do potential homebuyers choose the right neighborhood?
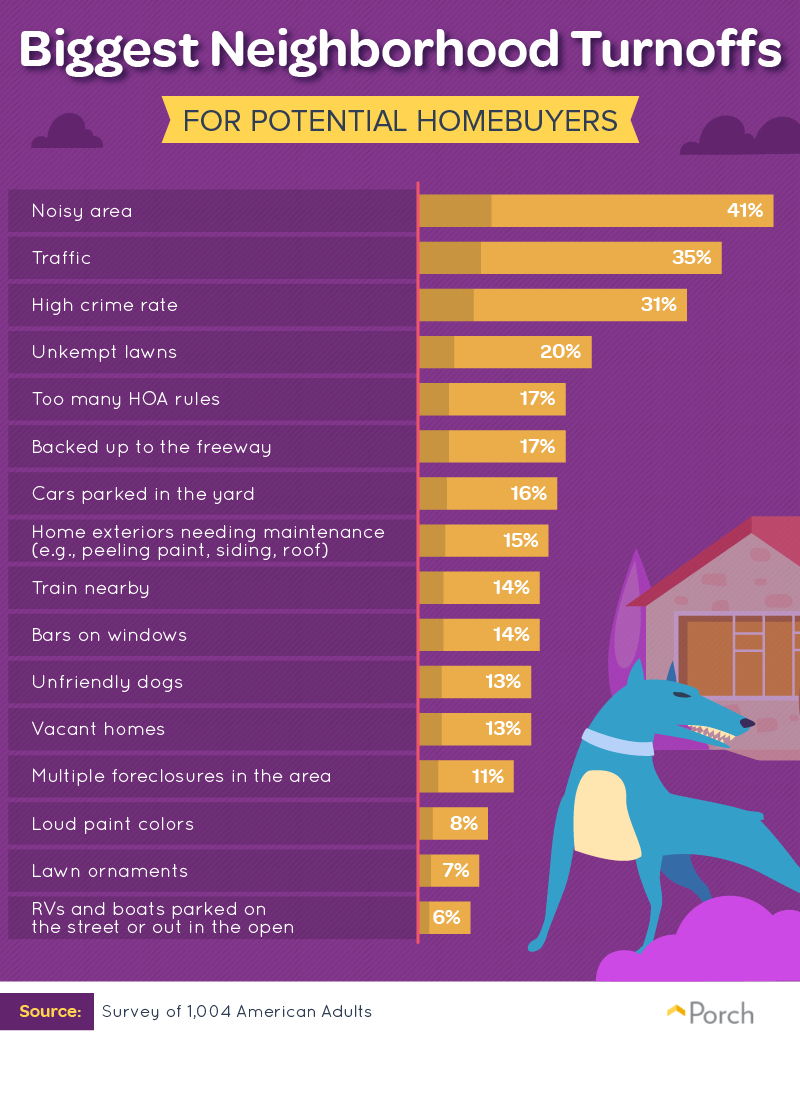
Noise, traffic, and crime were the biggest concerns for homebuyers. Noise topped the list of neighborhood turnoffs, with 41 percent of respondents marking it as a major no-no. Noise was an even bigger deterrent than a high crime rate.
Neighborhood appearance matters, too. Unkempt lawns deterred 1 in 5 respondents. Having cars parked in the yard or peeling paint on homes was also largely disliked. Loud paint schemes, lawn ornaments, and RVs and boats parked on the street were more forgivable visual offenses.
Gender preferences

Men and women were put off by different negative neighborhood traits. For instance, women were more bothered by unkempt lawns and peeling paint, while men found foreclosures and lawn ornaments more off-putting. Women were also more concerned with crime and unfriendly dogs compared with their male counterparts.
Generational divides
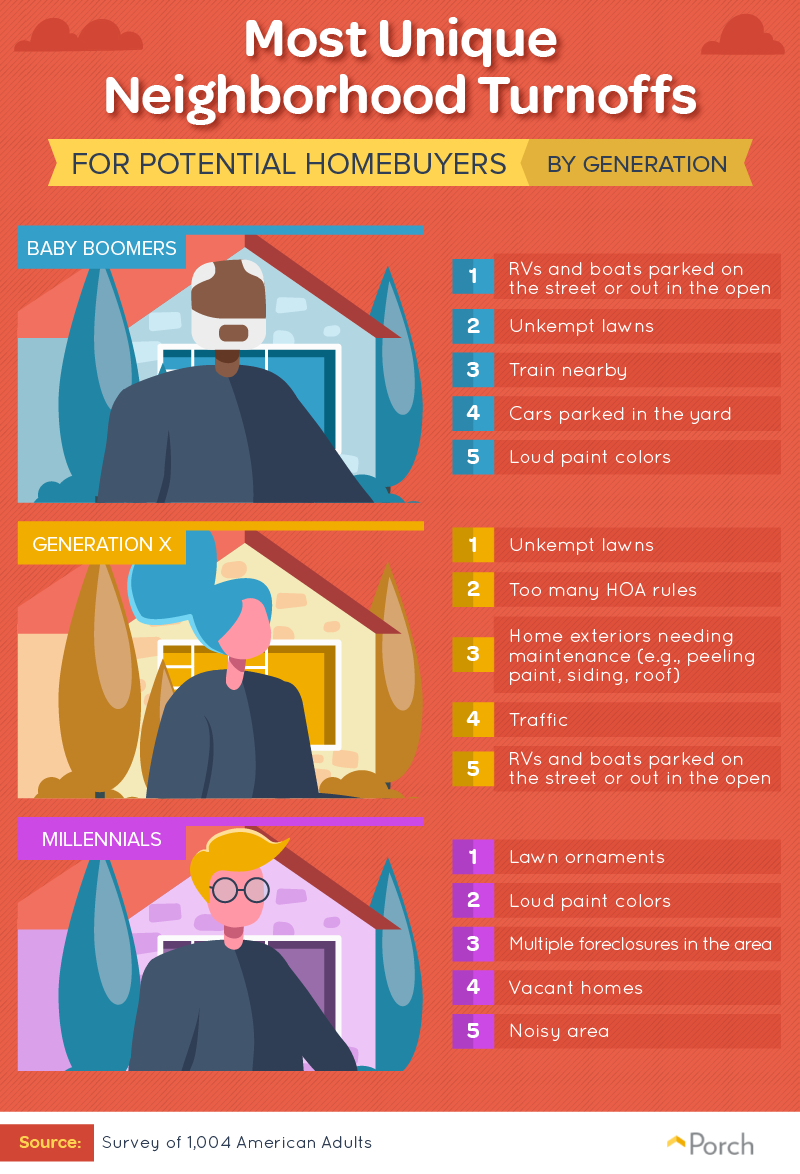
Baby boomers were some of the most vehement about their neighborhood traits. In fact, they were most turned off by RVs and boats parked on the street or out in the open, followed by unkempt lawns and having trains nearby.
Gen Xers, on the other hand, pegged unkempt lawns as most egregious, and millennials found lawn ornaments and garish exterior paint jobs to be more off-putting than the other generations.
Home compromises
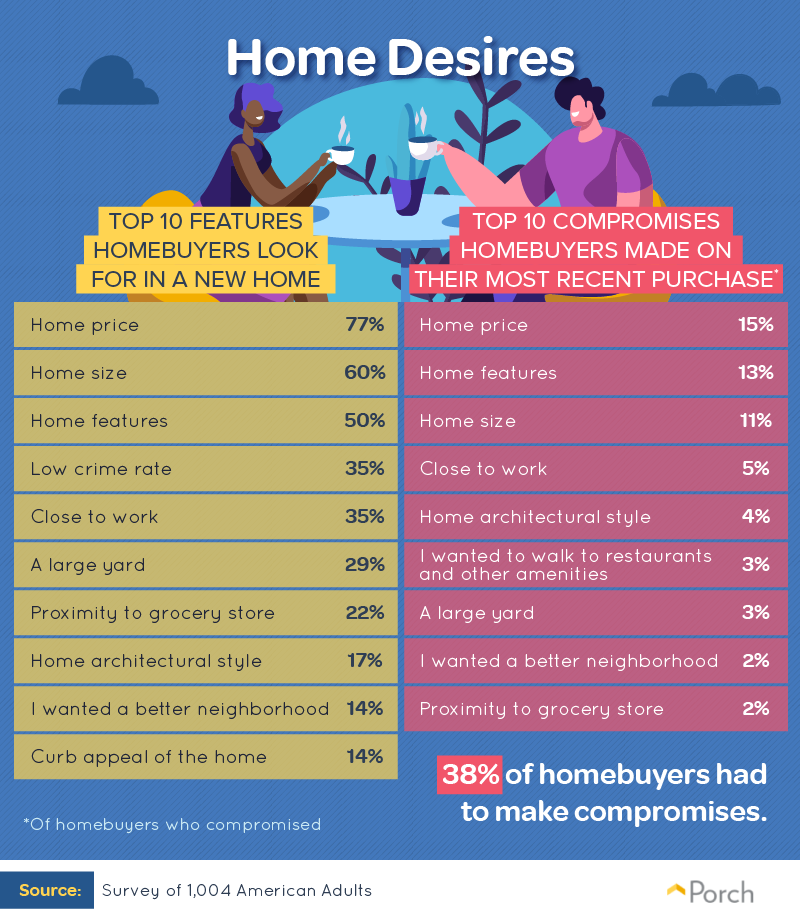
There’s a lot to consider when shopping for a new home. From cost to appearance, size to location, potential homebuyers can face a long wish list. According to our survey, the most important factor in a new residence was cost. Over three-fourths of respondents listed cost as their primary consideration when shopping for a new home. The second biggest consideration was the overall size. Only half of respondents listed the features of the home as very important.
Appearance was less important than location. Thirty-five percent cared about being close to work, and over 20 percent wanted to be near a grocery store, while curb appeal only really mattered to 14 percent of people.
Wish lists are great, but seldom do we get everything we wish for. We asked homeowners what compromises they made on their current residence. It turns out, the most desired items were also the most compromised. Potential homebuyers compromised the most on their home’s cost, features, and size. Only 2 percent each had to compromise on their proximity to a grocery store and a newer neighborhood. Best of all, 62 percent didn’t have to make a compromise at all.
What makes us feel safe
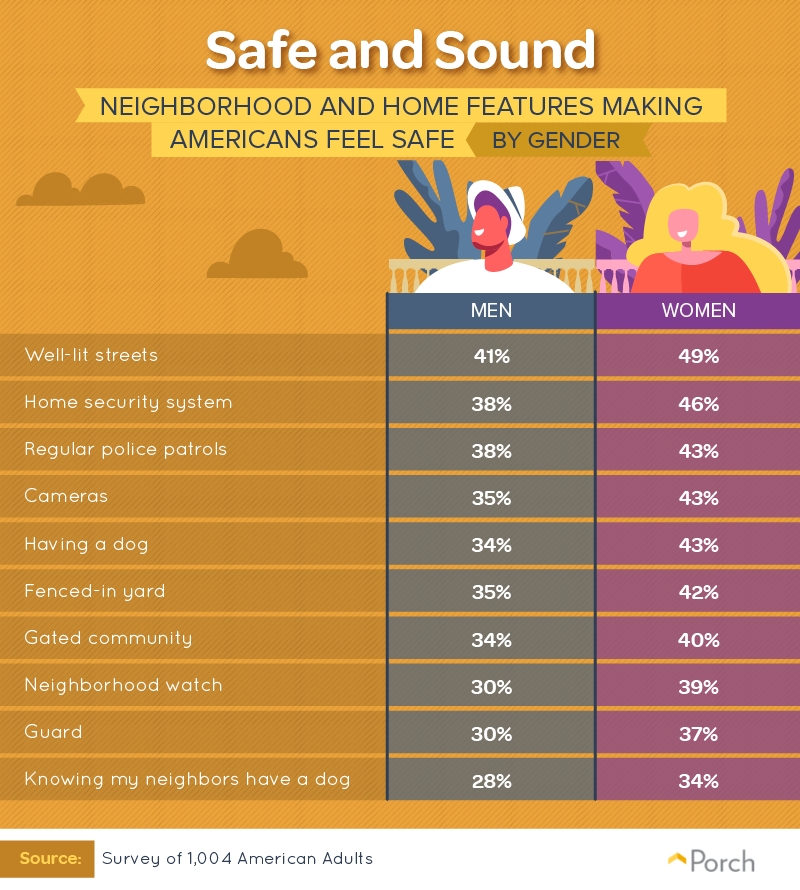
Why do neighborhood features matter so much to potential homebuyers? One reason is safety. Everyone wants to feel safe at home, but what makes men and women feel safe varies.
In general, neighborhood and home features had a greater impact on how safe women felt than men. For instance, having well-lit streets created the greatest sense of safety for men and women, but while it made almost half of women feel safe, only 41 percent of men said well-lit streets added to their sense of security.
The greatest disparities were found concerning having a dog and a neighborhood watch. Women were 9 percentage points more likely than men to feel safe with a dog or neighborhood watch. Regular police patrols, on the other hand, were the most similar between the genders, with only a 5 percentage point difference between men and women.
Growing roots
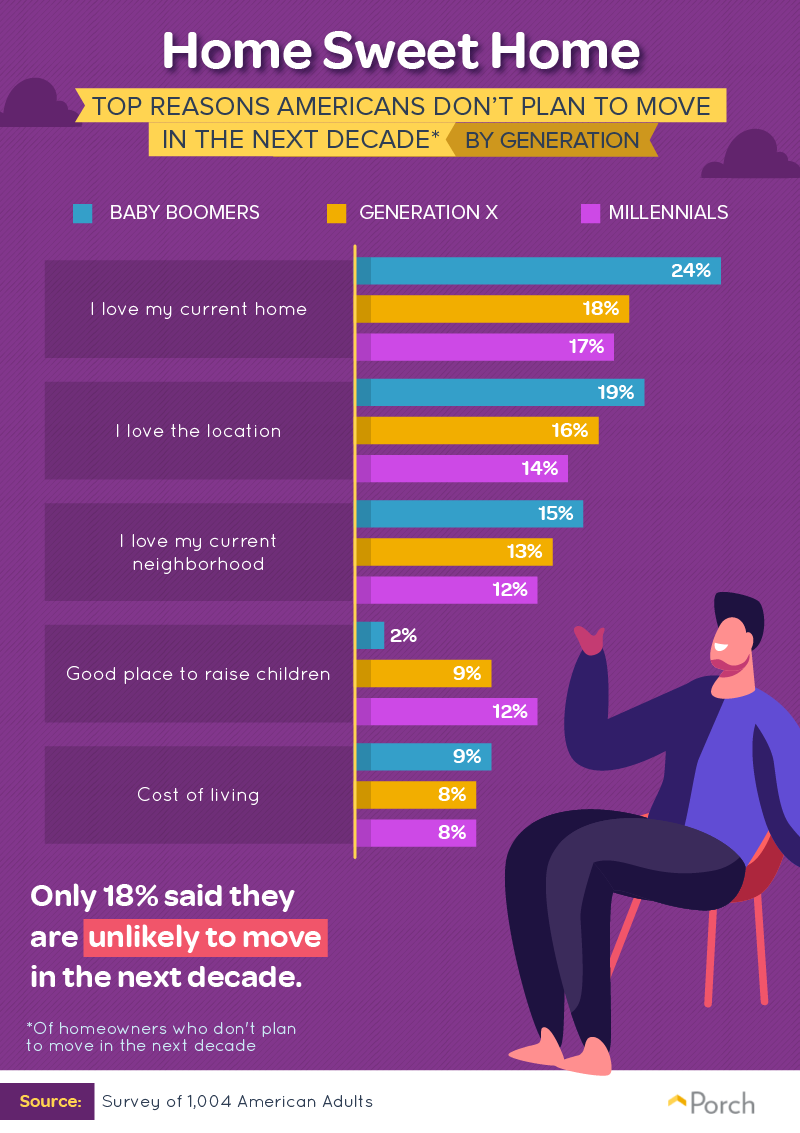
After looking at the biggest neighborhood turnoffs, we asked what would make them not want to move at all. All generations said their love of their current home was the primary reason they didn’t plan to move in the next decade. Baby boomers were most likely to be in love with their home overall. Millennials, on the other hand, were the most likely to stay in their home because it was a good place to raise children. However, children only factored into 2 percent of baby boomers’ moving plans—probably because most of their kids are already grown and in homes of their own.
The cost of living was a lesser reason for moving. In fact, fewer Americans move from low- to high-income places. According to one study, over half of movers stayed within their approximate economic and social well-being level when changing counties.
Despite all the good reasons to stay in their current home, only 18 percent of people said they’re unlikely to move in the next 10 years.
Creating your dream home
There are a lot of moving parts involved in moving (pun intended). At Porch, we understand how hard relocating from one place to another can be—which is why we want to help turn your home into your dream home. Whatever project your new (or old) home needs, we’re here to help whether it is a roofing repair in Chicago or a window replacement in Austin. Visit our website to get a quote and schedule an appointment with a licensed professional today.
Methodology and limitations
We surveyed 1,004 people. 465 of our respondents were men, 536 were women, and three did not specify their gender. Ages ranged from 18 to 81 with a median age of 35.
Respondents who had never moved were excluded from taking the survey. To improve the quality of the data, an attention-check question was used in the survey to identify any respondents who were not paying attention. Those respondents were disqualified from the final analysis.
To calculate the rankings for “Most Unique Neighborhood Turnoffs,” we first determined the average for each category. Then, for each demographic group, the percentage difference from the average was determined. Finally, a ranking was assigned based on the largest difference from the overall average.
The survey data we are presenting are self-reported by respondents. It is possible, but unknown, if selective memory, telescoping, attribution, exaggeration, or other known issues with self-reported data affect respondents’ answers.
Sources
- https://www.census.gov/library/visualizations/2016/comm/cb16-189_migration.html
- https://qz.com/1480835/the-share-of-americans-moving-hit-a-record-low/
- https://www.census.gov/data/tables/time-series/demo/geographic-mobility/historic.html?kbid=93121&gclid=
- https://www.brookings.edu/blog/up-front/2018/11/19/americans-arent-moving-to-economic-opportunity/
Fair Use Statement
We’d love for you to share anything you found interesting from our study. But please limit the use of our images and findings to noncommercial purposes and include a link back to this page. Like some neighborhood features, not providing due credit is a major turnoff.