
The Youngest Cities in the U.S.
- Salt Lake City, UT. Percentage of the population under 35: 52.8%
- Houston-The Woodlands-Sugar Land, TX. Percentage of the population under 35: 50.2%
- Riverside-San Bernardino-Ontario, CA. Percentage of the population under 35: 49.9%
-
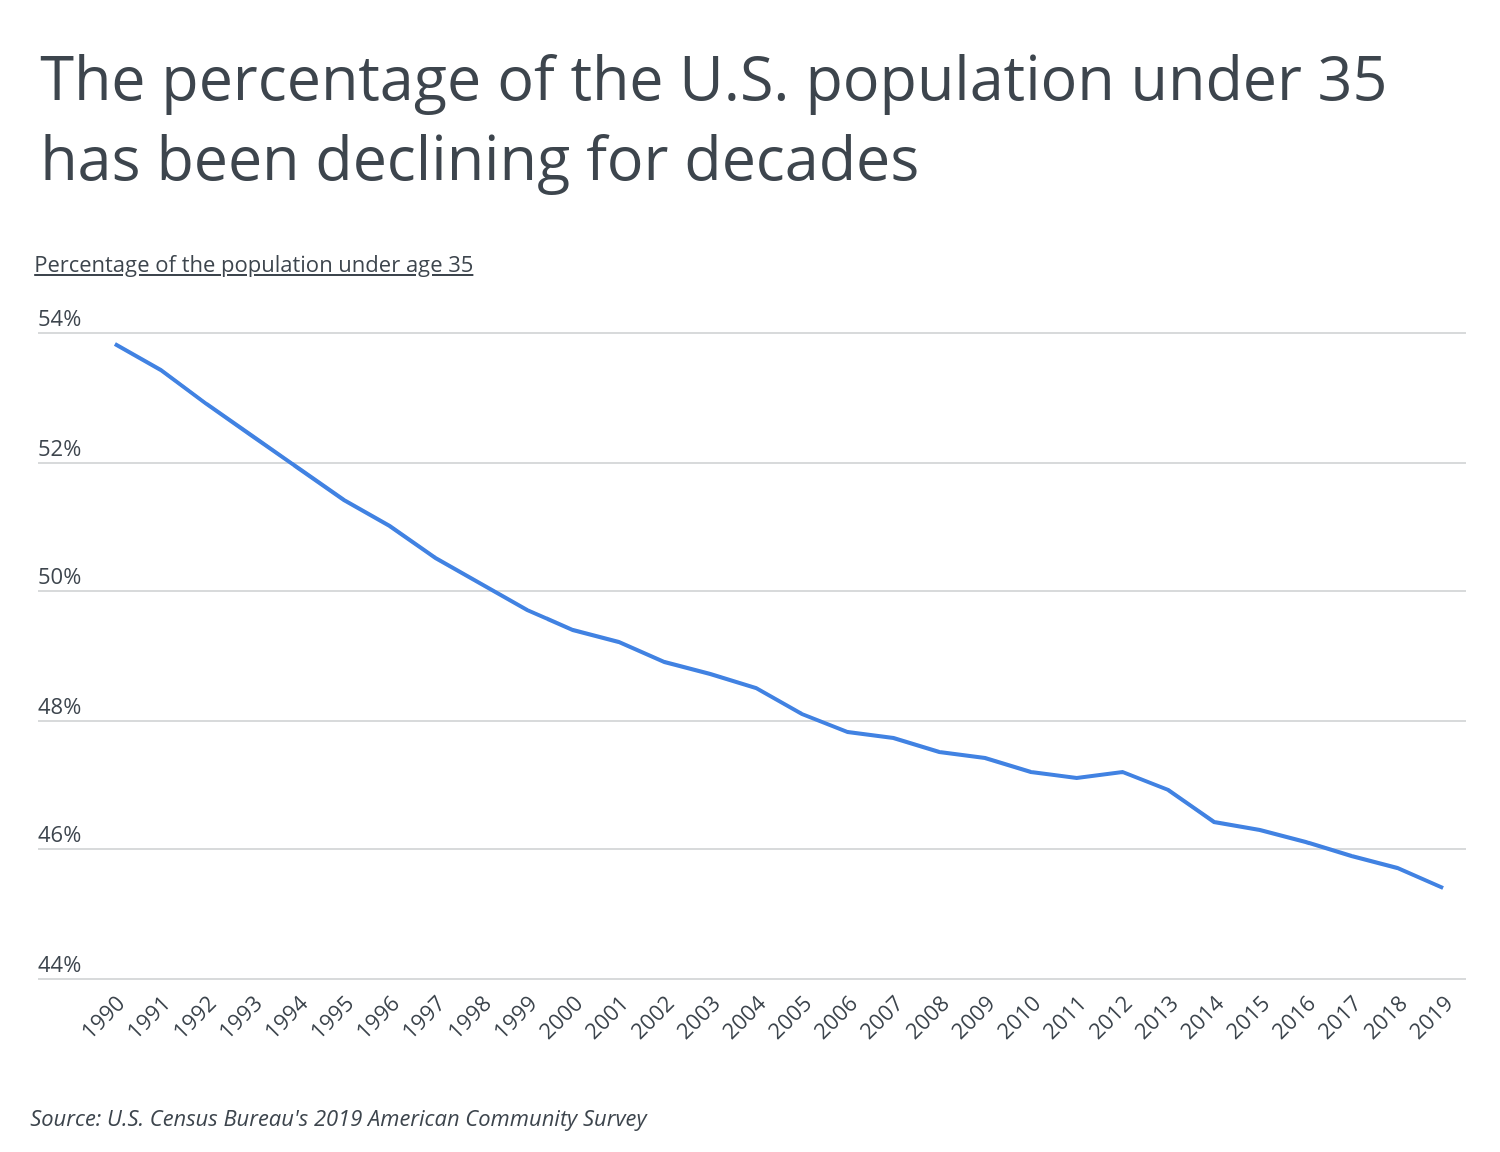
The U.S. population is getting older. Aging Baby Boomers and declining fertility rates mean that for the first time in the country’s history, older people—those 65 years and older—are projected to outnumber children by 2030. Additionally, people under age 35 account for only 45.4 percent of the population, a proportion that is nearly 10 percentage points lower than three decades prior.
The share of the population under age 35 has been on the decline for decades. In 1990, nearly 54 percent of the U.S. population was under 35. As of 2019, that figure had dropped to just 45 percent. After a slight increase in 2014, the U.S. fertility rate has dropped for five straight years, and the number of births fell to the lowest level since 1985. As the country’s fertility rate declines and as Baby Boomers age, the proportion of older people is increasing. By 2030, one out of every five Americans will be of retirement age.
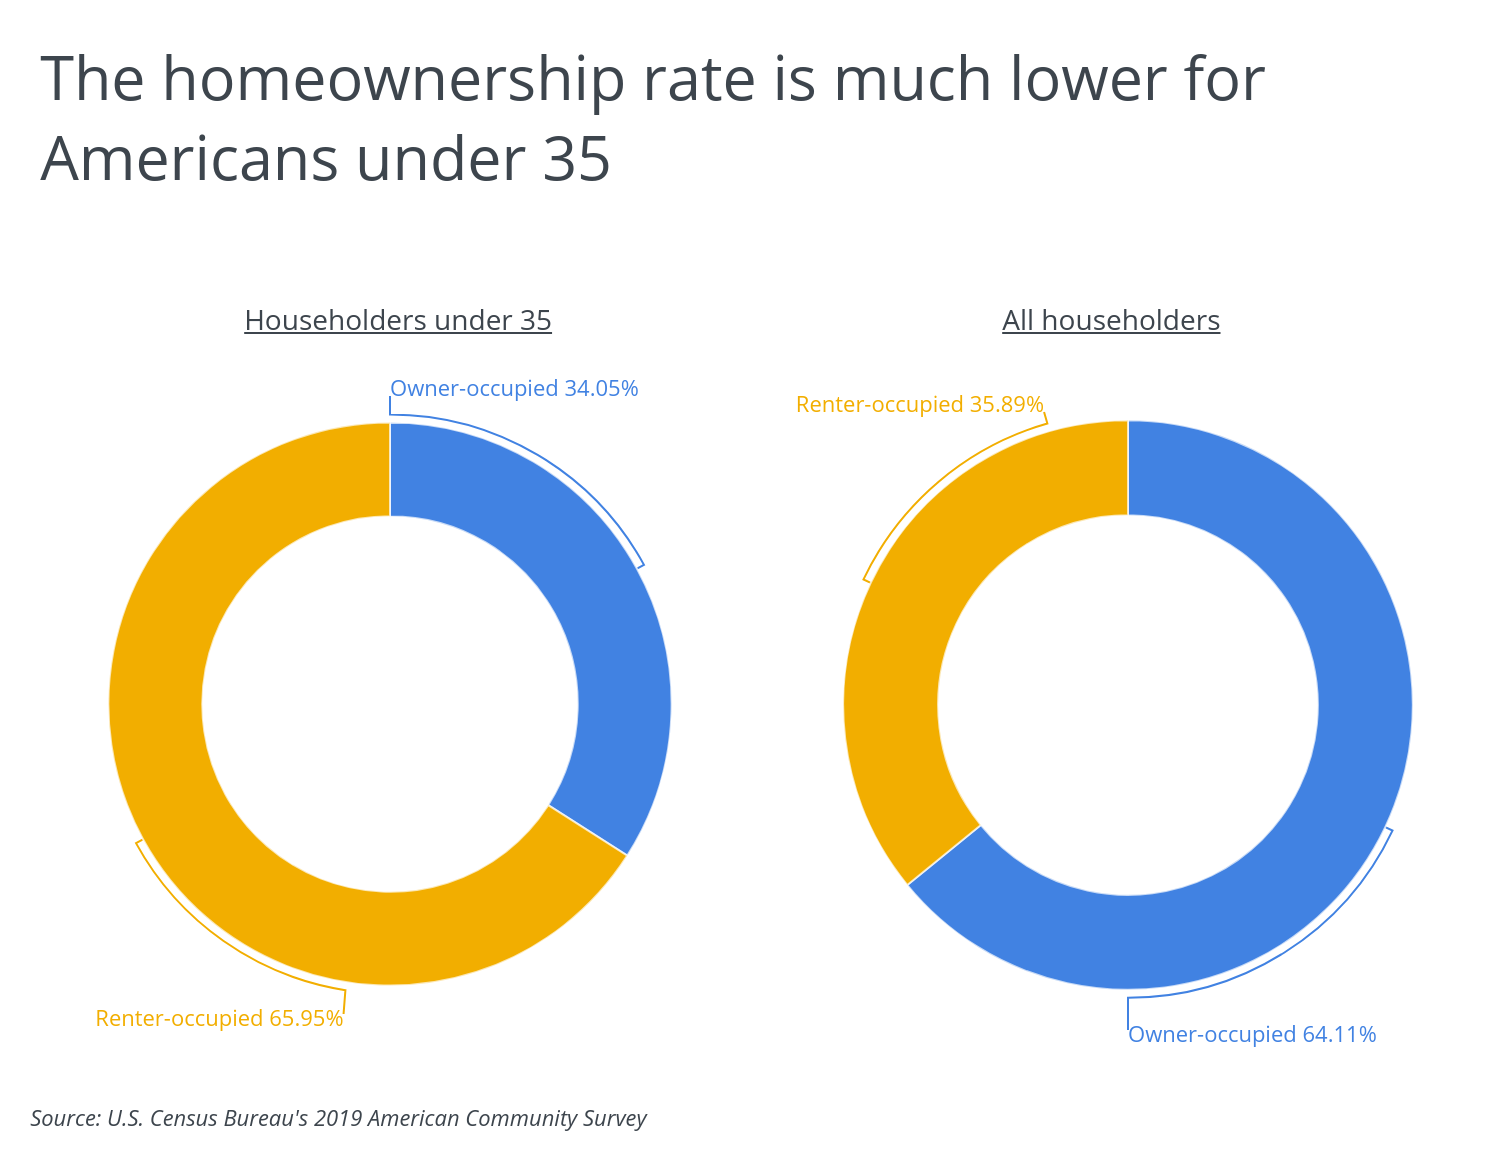
Due to a variety of factors, young adults of today have significantly lower homeownership rates. While just over one-third of householders under 35 own their own homes, 64 percent of all householders do. Rising home prices, low inventory, and more stringent mortgage requirements since the housing market crisis have made buying less feasible. Additionally, people under 35 are more likely to live in high-cost cities and have student loan debt, a combination that makes it challenging to save sufficient funds for a down payment. Given homeownership has long been considered one of the best ways to build wealth, how cities respond to the lack of affordable housing and where young people choose to settle down could have long-term impacts on the financial health of these younger generations. In the current economic climate, many young adults are debating whether to continue renting or buying a place of their own, and the data shows that fewer and fewer are doing the latter.
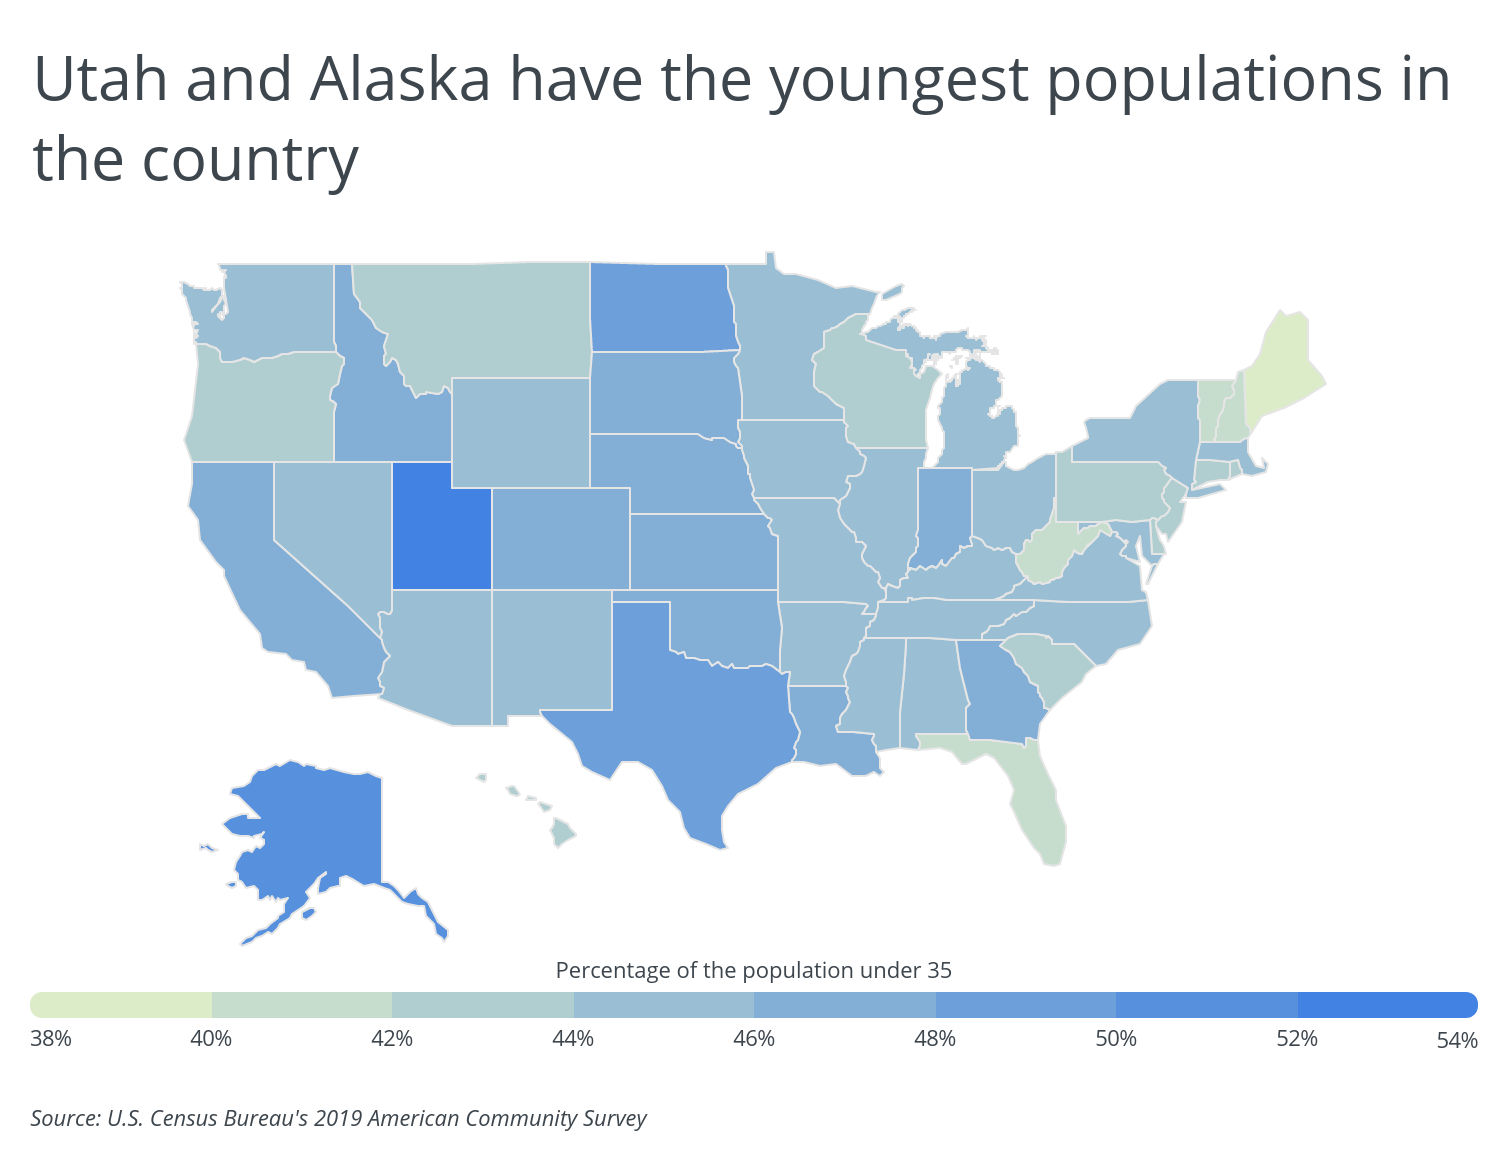
While the population in the U.S. is becoming older on average, the population age distribution varies on a geographic basis. Some places are retiree havens, while others have large numbers of young families and kids. At the state level, Utah and Alaska have the highest percentages of their populations under age 35, at 55.1 and 50 percent, respectively. Maine and West Virginia have the oldest populations, with just 38.5 and 40.3 percent of their populations under age 35, respectively.
TRENDING
During the colder months, it’s easier to plan and execute home improvement projects inside the home. Learn what it would cost to install kitchen cabinets this winter.
To find the youngest cities in the U.S., researchers at Porch analyzed the latest data from the U.S. Census Bureau. The researchers ranked metro areas according to the proportion of the population under age 35. Researchers also calculated the total population under 35, the total population across all ages, the homeownership rate for households under 35, and the homeownership rate for all households.
To improve relevance, only metropolitan areas with at least 100,000 people were included in the analysis. Additionally, metro areas were grouped into the following cohorts based on population size:
- Small metros: 100,000–349,999
- Midsize metros: 350,000–999,999
- Large metros: 1,000,000 or more
Here are the metros with the highest proportion of the population under 35.
The Youngest Large Metros in the U.S.
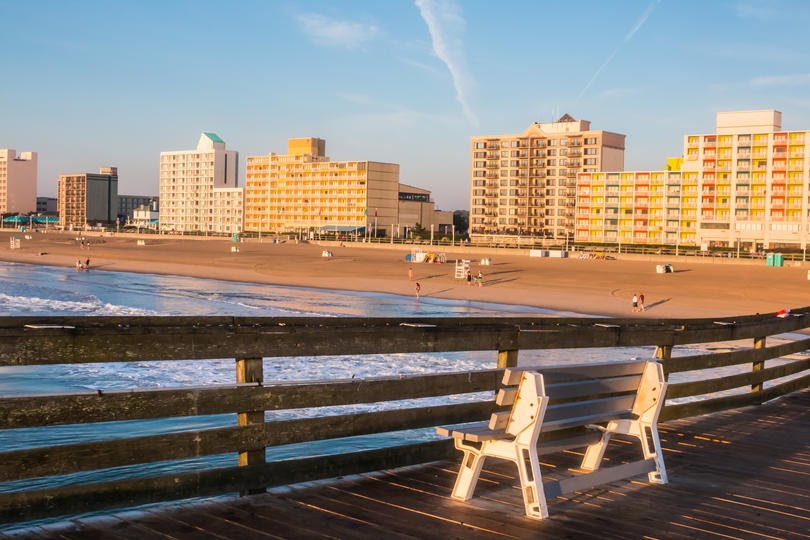
Photo Credit: Alamy Stock Photo
15. Virginia Beach-Norfolk-Newport News, VA-NC
- Percentage of the population under 35: 47.4%
- Population under 35: 836,721
- Total population: 1,765,031
- Homeownership rate for households under 35: 34.4%
- Homeownership rate for all households: 61.1%

Photo Credit: Alamy Stock Photo
14. Nashville-Davidson–Murfreesboro–Franklin, TN
- Percentage of the population under 35: 47.5%
- Population under 35: 919,174
- Total population: 1,933,860
- Homeownership rate for households under 35: 37.8%
- Homeownership rate for all households: 65.8%

Photo Credit: Alamy Stock Photo
13. Atlanta-Sandy Springs-Alpharetta, GA
- Percentage of the population under 35: 47.5%
- Population under 35: 2,856,076
- Total population: 6,018,744
- Homeownership rate for households under 35: 34.4%
- Homeownership rate for all households: 64.3%
RELATED
Starting to plan your next home improvement project? Read about the cost of a wood fence installation, the labor cost to install a water heater, and more with Porch.
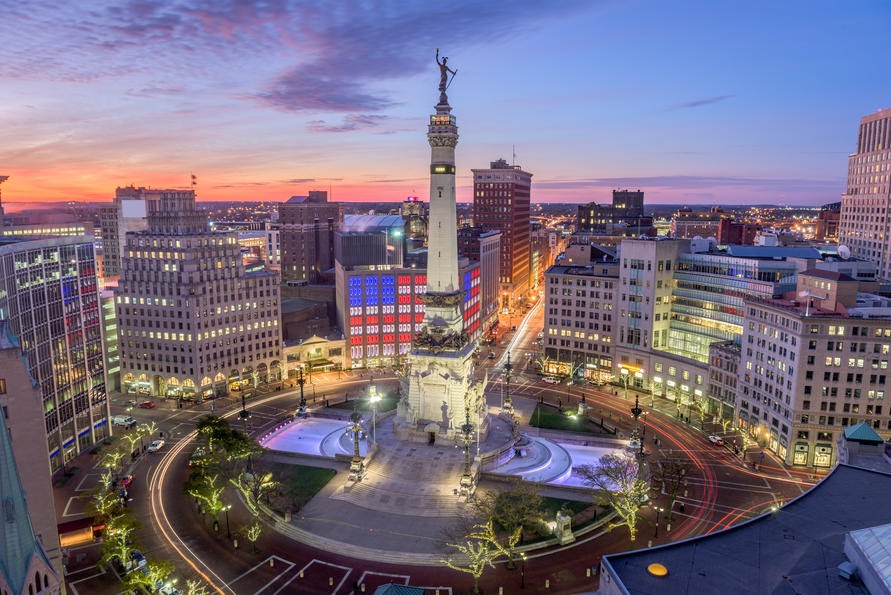
Photo Credit: Alamy Stock Photo
12. Indianapolis-Carmel-Anderson, IN
- Percentage of the population under 35: 47.6%
- Population under 35: 988,609
- Total population: 2,076,531
- Homeownership rate for households under 35: 37.5%
- Homeownership rate for all households: 65.2%
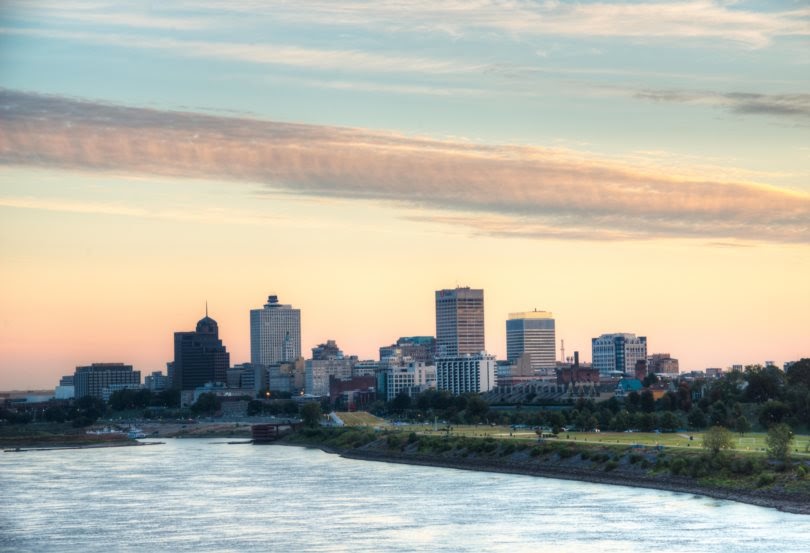
Photo Credit: Alamy Stock Photo
11. Memphis, TN-MS-AR
- Percentage of the population under 35: 47.8%
- Population under 35: 642,889
- Total population: 1,344,910
- Homeownership rate for households under 35: 25.9%
- Homeownership rate for all households: 58.8%
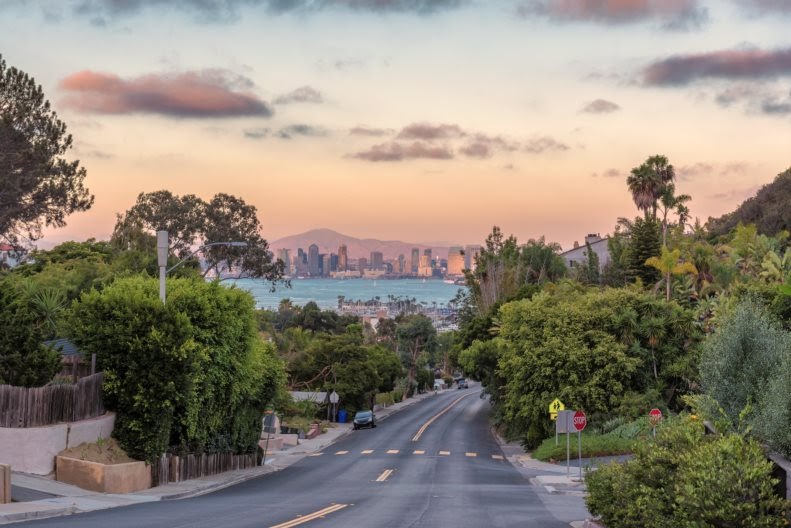
Photo Credit: Alamy Stock Photo
10. San Diego-Chula Vista-Carlsbad, CA
- Percentage of the population under 35: 47.9%
- Population under 35: 1,599,976
- Total population: 3,338,330
- Homeownership rate for households under 35: 20.4%
- Homeownership rate for all households: 53.8%

Photo Credit: Alamy Stock Photo
9. Columbus, OH
- Percentage of the population under 35: 48.0%
- Population under 35: 1,018,555
- Total population: 2,122,271
- Homeownership rate for households under 35: 31.2%
- Homeownership rate for all households: 60.9%
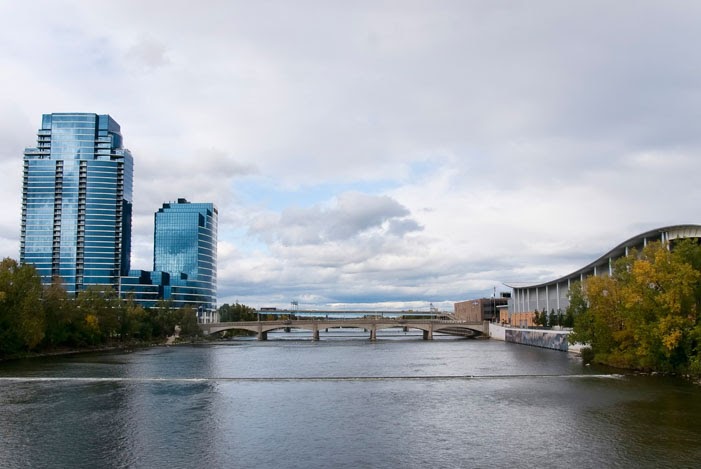
Photo Credit: Alamy Stock Photo
8. Grand Rapids-Kentwood, MI
- Percentage of the population under 35: 48.4%
- Population under 35: 521,692
- Total population: 1,077,370
- Homeownership rate for households under 35: 47.4%
- Homeownership rate for all households: 72.3%

Photo Credit: Alamy Stock Photo
7. Oklahoma City, OK
- Percentage of the population under 35: 49.1%
- Population under 35: 692,131
- Total population: 1,408,950
- Homeownership rate for households under 35: 35.0%
- Homeownership rate for all households: 63.3%
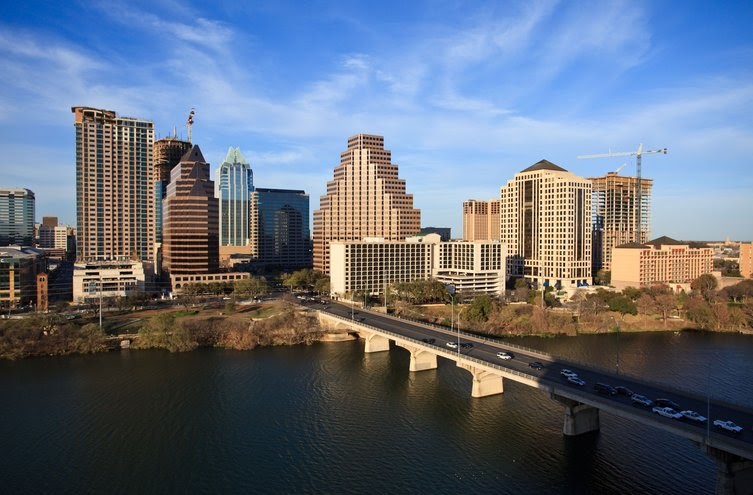
Photo Credit: Alamy Stock Photo
6. Austin-Round Rock-Georgetown, TX
- Percentage of the population under 35: 49.7%
- Population under 35: 1,107,619
- Total population: 2,227,083
- Homeownership rate for households under 35: 24.3%
- Homeownership rate for all households: 57.6%

Photo Credit: Alamy Stock Photo
5. Dallas-Fort Worth-Arlington, TX
- Percentage of the population under 35: 49.7%
- Population under 35: 3,765,555
- Total population: 7,573,136
- Homeownership rate for households under 35: 28.6%
- Homeownership rate for all households: 59.5%

Photo Credit: Alamy Stock Photo
4. San Antonio-New Braunfels, TX
- Percentage of the population under 35: 49.9%
- Population under 35: 1,274,164
- Total population: 2,550,960
- Homeownership rate for households under 35: 33.2%
- Homeownership rate for all households: 62.7%

Photo Credit: Alamy Stock Photo
3. Riverside-San Bernardino-Ontario, CA
- Percentage of the population under 35: 49.9%
- Population under 35: 2,320,610
- Total population: 4,650,631
- Homeownership rate for households under 35: 34.5%
- Homeownership rate for all households: 63.9%
TRENDING
How much does it cost to power wash a house? It depends on the size of your home, but it’s probably more affordable than you think.

Photo Credit: Alamy Stock Photo
2. Houston-The Woodlands-Sugar Land, TX
- Percentage of the population under 35: 50.2%
- Population under 35: 3,545,081
- Total population: 7,066,140
- Homeownership rate for households under 35: 30.7%
- Homeownership rate for all households: 60.1%
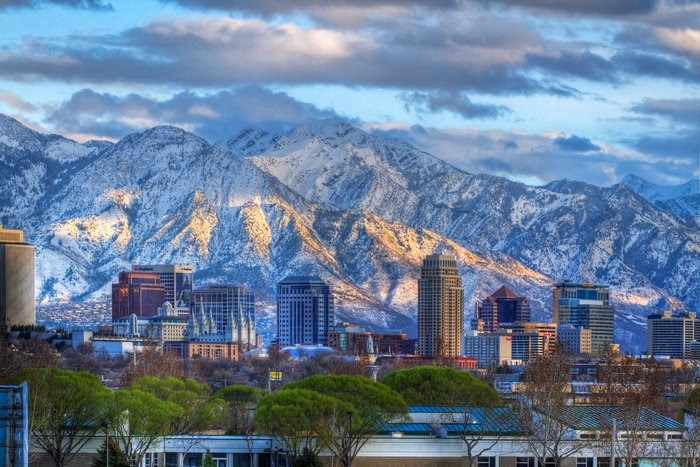
Photo Credit: Alamy Stock Photo
1. Salt Lake City, UT
- Percentage of the population under 35: 52.8%
- Population under 35: 651,390
- Total population: 1,232,696
- Homeownership rate for households under 35: 41.7%
- Homeownership rate for all households: 68.2%
Detailed Findings & Methodology
With nearly 53 percent of its population under age 35, the Salt Lake City metro area has the youngest population among large metros in the country. Utah has a much higher fertility rate than most other places, contributing to its youthful population. On average, people under 35 account for almost half of the population in the youngest large metros—about four percentage points higher than the national level.
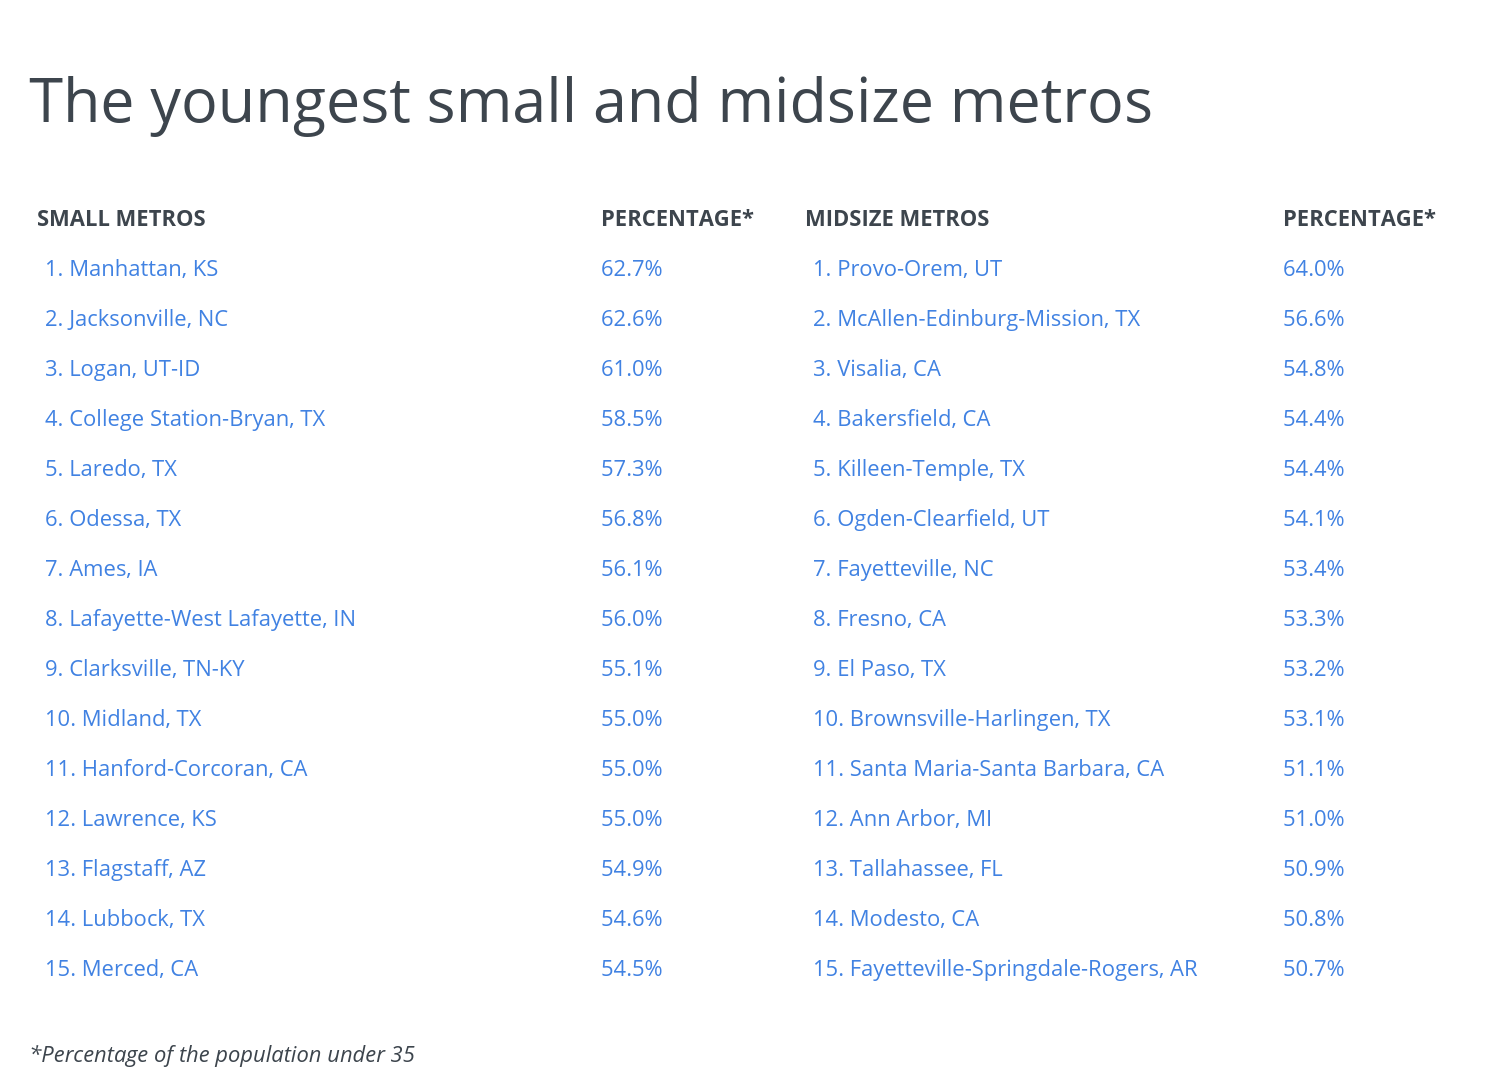
Some of the youngest small and midsize metros report over 60 percent of their population under age 35, and young people under 35 make up a majority of the population among all of these metros. As with the large metro group, homeownership rates are much lower for young people than among all households. In addition to Utah, both Texas and California claim a number of the small and midsize metros with large populations of young people.
To find the youngest cities in the U.S., researchers at Porch analyzed the latest data from the U.S. Census Bureau’s 2019 American Community Survey. The researchers ranked metro areas according to the percentage of the population under age 35. In the event of a tie, the metro with the larger number of people under 35 was ranked higher. Researchers also calculated the population under 35, the total population, the homeownership rate for households under 35, and the homeownership rate for all households.
Additionally, metros were grouped into the following cohorts based on population size:
- Small metros: 100,000–349,999
- Midsize metros: 350,000–999,999
- Large metros: 1,000,000 or more


