
Millennials have a notoriously low homeownership rate, which despite inching upward in recent years, is far lower than the rates of previous generations at the same age. The Urban Institute finds that a variety of factors contribute to depressed homeownership among young adults, including a propensity to delay marriage, increased student loan debt, lack of affordable housing, and geographic preferences. According to the latest data from the U.S. Census Bureau, the national homeownership rate is 63.9 percent. For millennials, the homeownership rate stands at just 39.5 percent.
Recent evidence shows that millennials are fleeing large, more expensive cities for more affordable, smaller locales. While millennials helped boost urban growth after the Great Recession, in recent years, the population of older millennials and younger Gen Xers has declined in these cities. The COVID-19 pandemic may continue to fuel this trend as dense city living becomes less attractive. Additionally, the economic and financial uncertainty that many Americans now face will make buying a home in pricey, large cities less feasible.
While the millennial homeownership rate is lower overall when compared to older generations, the rate varies widely across cities and states based on cultural factors, as well as living costs and job market conditions. At the state level, the Midwest claims the highest rates of millennial homeownership—Iowa and South Dakota have the highest homeownership rates among millennials in the country at 53.7 and 51.5 percent, respectively. Conversely, Hawaii, California, and New York have the lowest millennial homeownership rates—all below 30 percent.
RELATED
Whether you are a new homeowner or have lived in your house for years, Porch makes it easy to schedule home repairs with trusted professionals. Some of our most popular professionals include local plumbers, electricians, and painters.
To find the metropolitan areas where millennials are buying homes, researchers at Porch, a marketplace for home services, analyzed the latest data from the U.S. Census Bureau, the Bureau of Economic Analysis, and Zillow. The researchers ranked metro areas according to the homeownership rate among millennials. In the event of a tie, the metro with the larger number of millennial homeowners was ranked higher. Researchers also calculated the median home price, the typical monthly mortgage payment, median earnings for full-time millennial workers, and the cost of living.
To improve relevance, only metropolitan areas with at least 100,000 people were included in the analysis. Additionally, metro areas were grouped into the following cohorts based on population size:
- Small metros: 100,000-349,999
- Midsize metros: 350,000-999,999
- Large metros: more than 1,000,000
Here are the metros with the highest rate of homeownership among millennials.
Large metros where millennials are buying homes

Photo Credit: Alamy Stock Photo
15. Hartford-West Hartford-East Hartford, CT
- Millennial homeownership rate: 43.4%
- Median home price: $241,177
- Monthly mortgage payment: $856
- Median earnings for full-time millennials: $50,000
- Cost of living: 2% above average

Photo Credit: Alamy Stock Photo
14. Indianapolis-Carmel-Anderson, IN
- Millennial homeownership rate: 43.7%
- Median home price: $187,285
- Monthly mortgage payment: $664
- Median earnings for full-time millennials: $40,000
- Cost of living: 8% below average
RELATED
Considering a new home project? Luckily, Porch makes it easy to get cost estimates for common repairs and improvements, such as laminate flooring costs, tile installation costs, carpet costs, and more.

Photo Credit: Alamy Stock Photo
13. Oklahoma City, OK
- Millennial homeownership rate: 43.7%
- Median home price: $160,931
- Monthly mortgage payment: $571
- Median earnings for full-time millennials: $37,000
- Cost of living: 9% below average

Photo Credit: Alamy Stock Photo
12. Nashville-Davidson–Murfreesboro–Franklin, TN
- Millennial homeownership rate: 44.1%
- Median home price: $287,200
- Monthly mortgage payment: $1,019
- Median earnings for full-time millennials: $40,000
- Cost of living: 5% below average

Photo Credit: Alamy Stock Photo
11. Raleigh, NC
- Millennial homeownership rate: 44.1%
- Median home price: $290,686
- Monthly mortgage payment: $1,031
- Median earnings for full-time millennials: $44,000
- Cost of living: 3% below average

Photo Credit: Alamy Stock Photo
10. Baltimore-Columbia-Towson, MD
- Millennial homeownership rate: 44.3%
- Median home price: $297,468
- Monthly mortgage payment: $1,055
- Median earnings for full-time millennials: $50,000
- Cost of living: 7% above average

Photo Credit: Alamy Stock Photo
9. Rochester, NY
- Millennial homeownership rate: 44.8%
- Median home price: $161,366
- Monthly mortgage payment: $573
- Median earnings for full-time millennials: $40,000
- Cost of living: 2% below average

Photo Credit: Alamy Stock Photo
8. Birmingham-Hoover, AL
- Millennial homeownership rate: 45.6%
- Median home price: $171,641
- Monthly mortgage payment: $609
- Median earnings for full-time millennials: $40,000
- Cost of living: 11% below average

Photo Credit: Alamy Stock Photo
7. Louisville/Jefferson County, KY-IN
- Millennial homeownership rate: 45.7%
- Median home price: $185,506
- Monthly mortgage payment: $658
- Median earnings for full-time millennials: $40,000
- Cost of living: 10% below average

Photo Credit: Alamy Stock Photo
6. Pittsburgh, PA
- Millennial homeownership rate: 45.9%
- Median home price: $162,803
- Monthly mortgage payment: $578
- Median earnings for full-time millennials: $43,000
- Cost of living: 7% below average
RELATED
Use Porch to find the best remodeling cost guides for any home renovation or remodeling project: drywall install costs, replace water heater costs, kitchen cabinets costs and privacy fence costs.

Photo Credit: Alamy Stock Photo
5. St. Louis, MO-IL
- Millennial homeownership rate: 46.7%
- Median home price: $183,000
- Monthly mortgage payment: $649
- Median earnings for full-time millennials: $41,600
- Cost of living: 9% below average

Photo Credit: Alamy Stock Photo
4. Detroit-Warren-Dearborn, MI
- Millennial homeownership rate: 47.4%
- Median home price: $187,529
- Monthly mortgage payment: $665
- Median earnings for full-time millennials: $41,500
- Cost of living: 5% below average

Photo Credit: Alamy Stock Photo
3. Salt Lake City, UT
- Millennial homeownership rate: 47.9%
- Median home price: $391,450
- Monthly mortgage payment: $1,389
- Median earnings for full-time millennials: $40,000
- Cost of living: 1% below average

Photo Credit: Alamy Stock Photo
2. Minneapolis-St. Paul-Bloomington, MN-WI
- Millennial homeownership rate: 48.6%
- Median home price: $301,440
- Monthly mortgage payment: $1,069
- Median earnings for full-time millennials: $48,300
- Cost of living: 3% above average

Photo Credit: Alamy Stock Photo
1. Grand Rapids-Wyoming, MI
- Millennial homeownership rate: 56.8%
- Median home price: $227,246
- Monthly mortgage payment: $806
- Median earnings for full-time millennials: $40,000
- Cost of living: 8% below average
Detailed findings & methodology
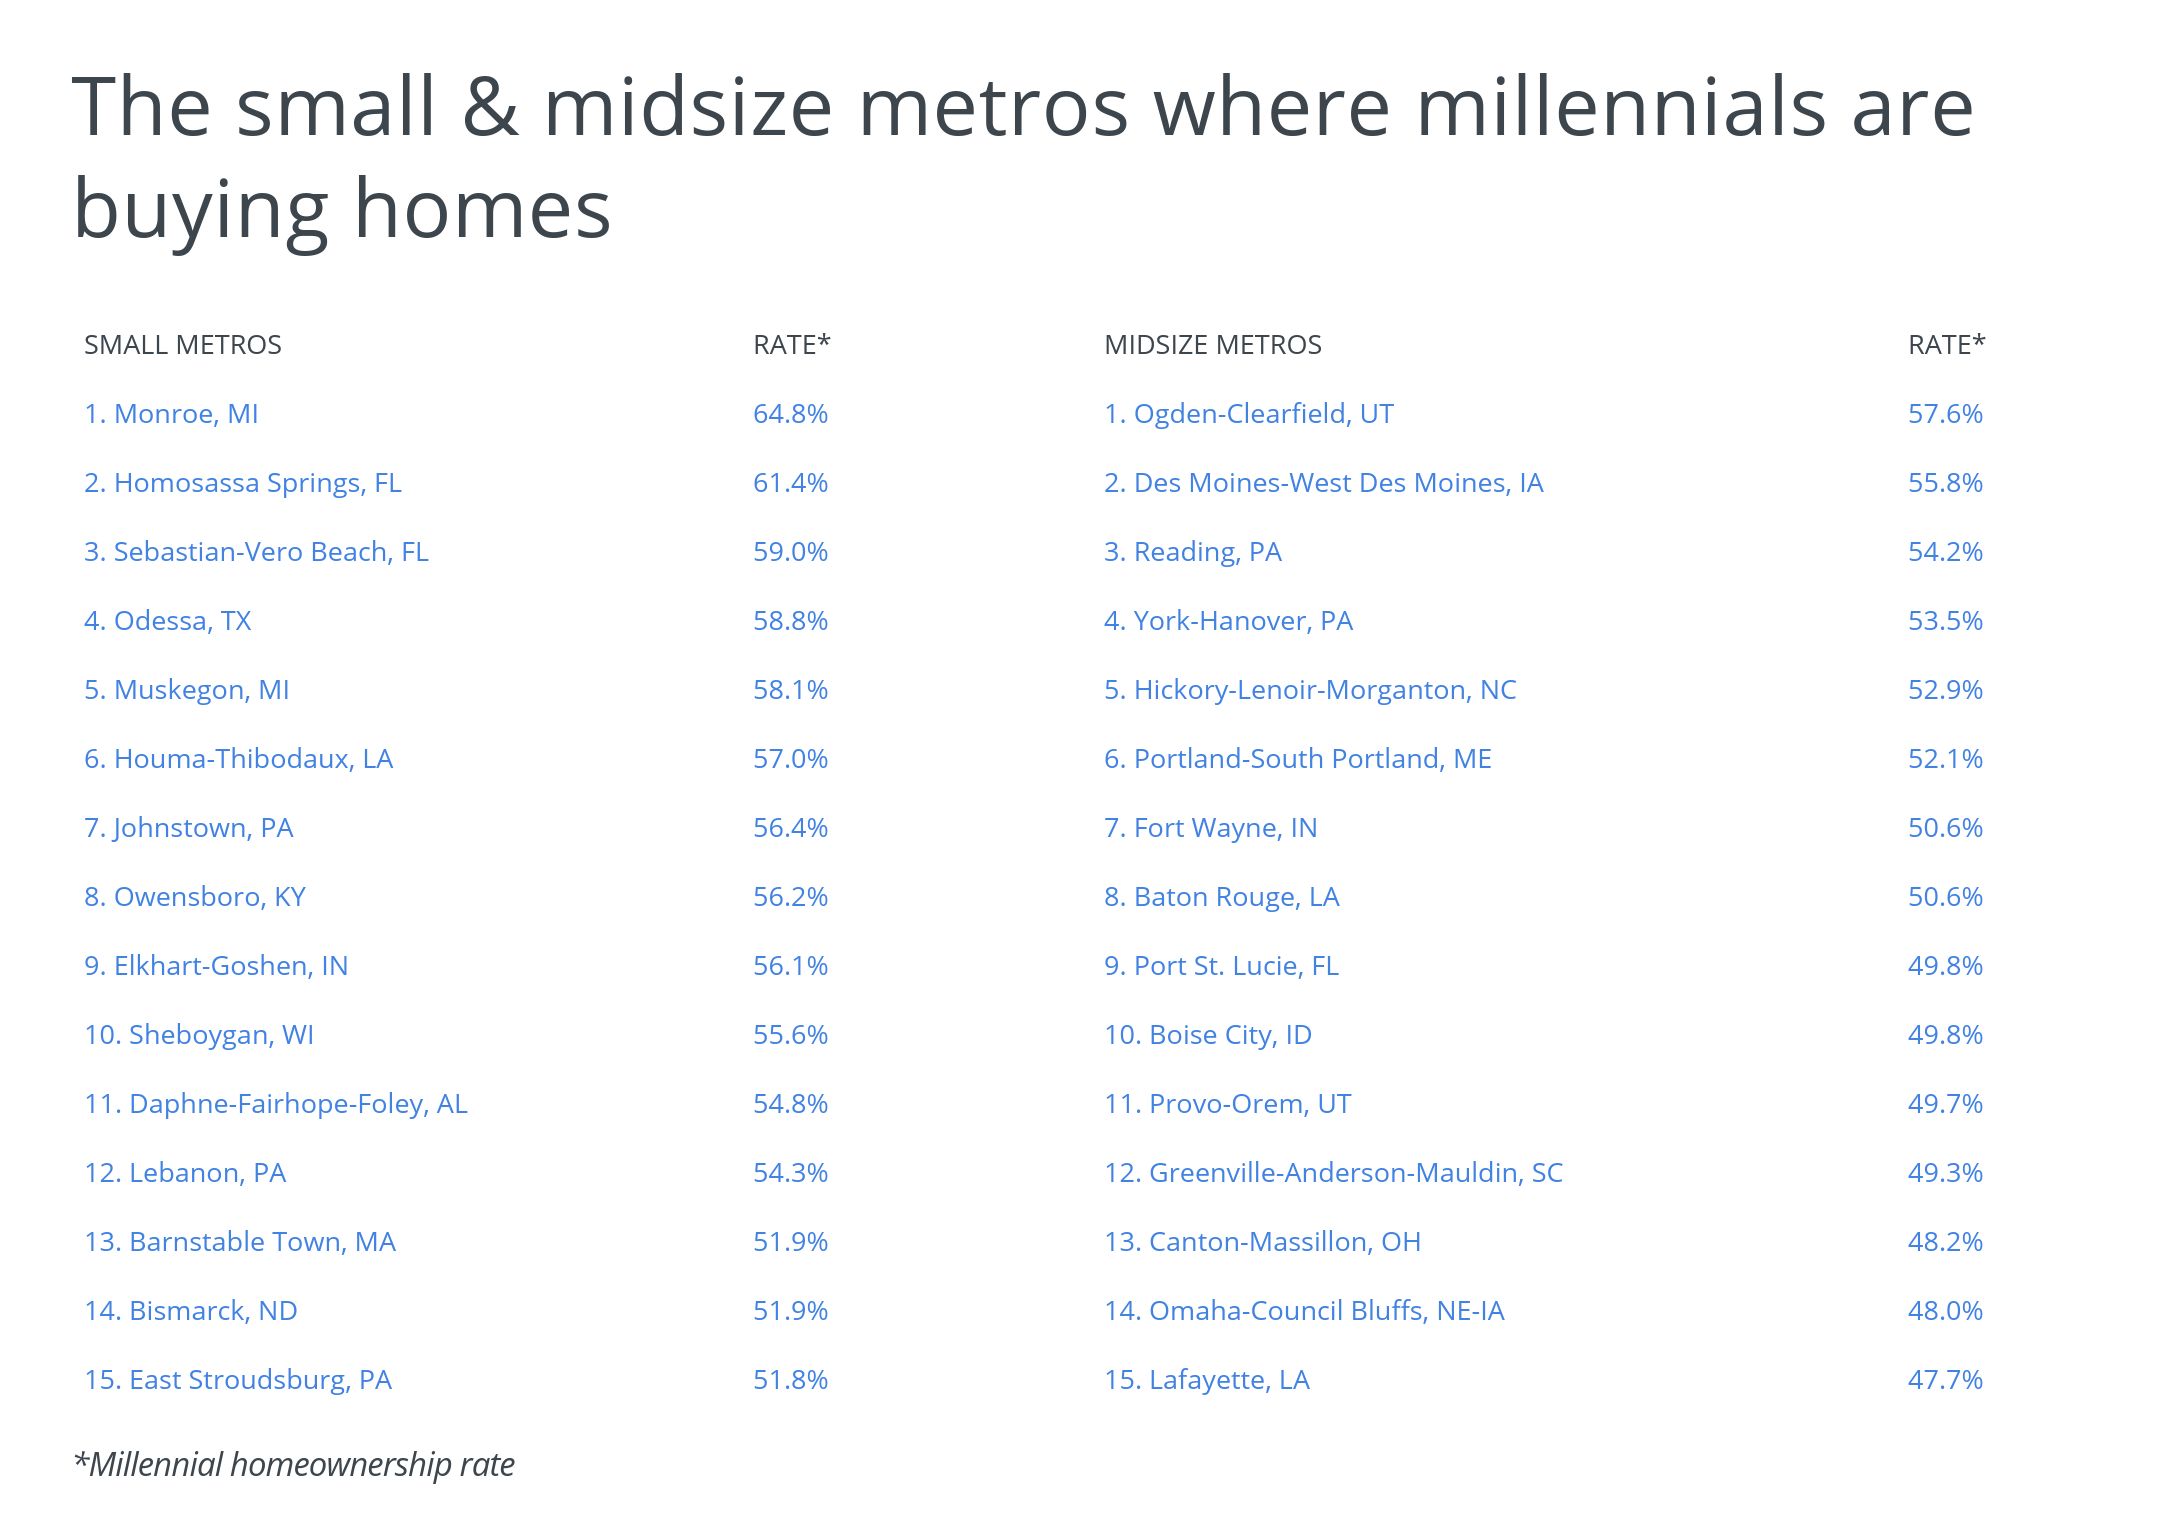
The metros with the highest rates of homeownership among millennials tend to have lower costs of living than average. Among the large metros with the highest millennial home ownership rates, median earnings for full-time millennials is on average $42,360, slightly higher than the national median of $40,000. Homes also tend to be more affordable in these locales—the median home price and monthly mortgage payment skew lower than the national averages of $229,115 and $813, respectively. The small and midsize metros with the largest millennial homeownership rates follow a similar pattern. They tend to have lower costs of living and more affordable homes as well.
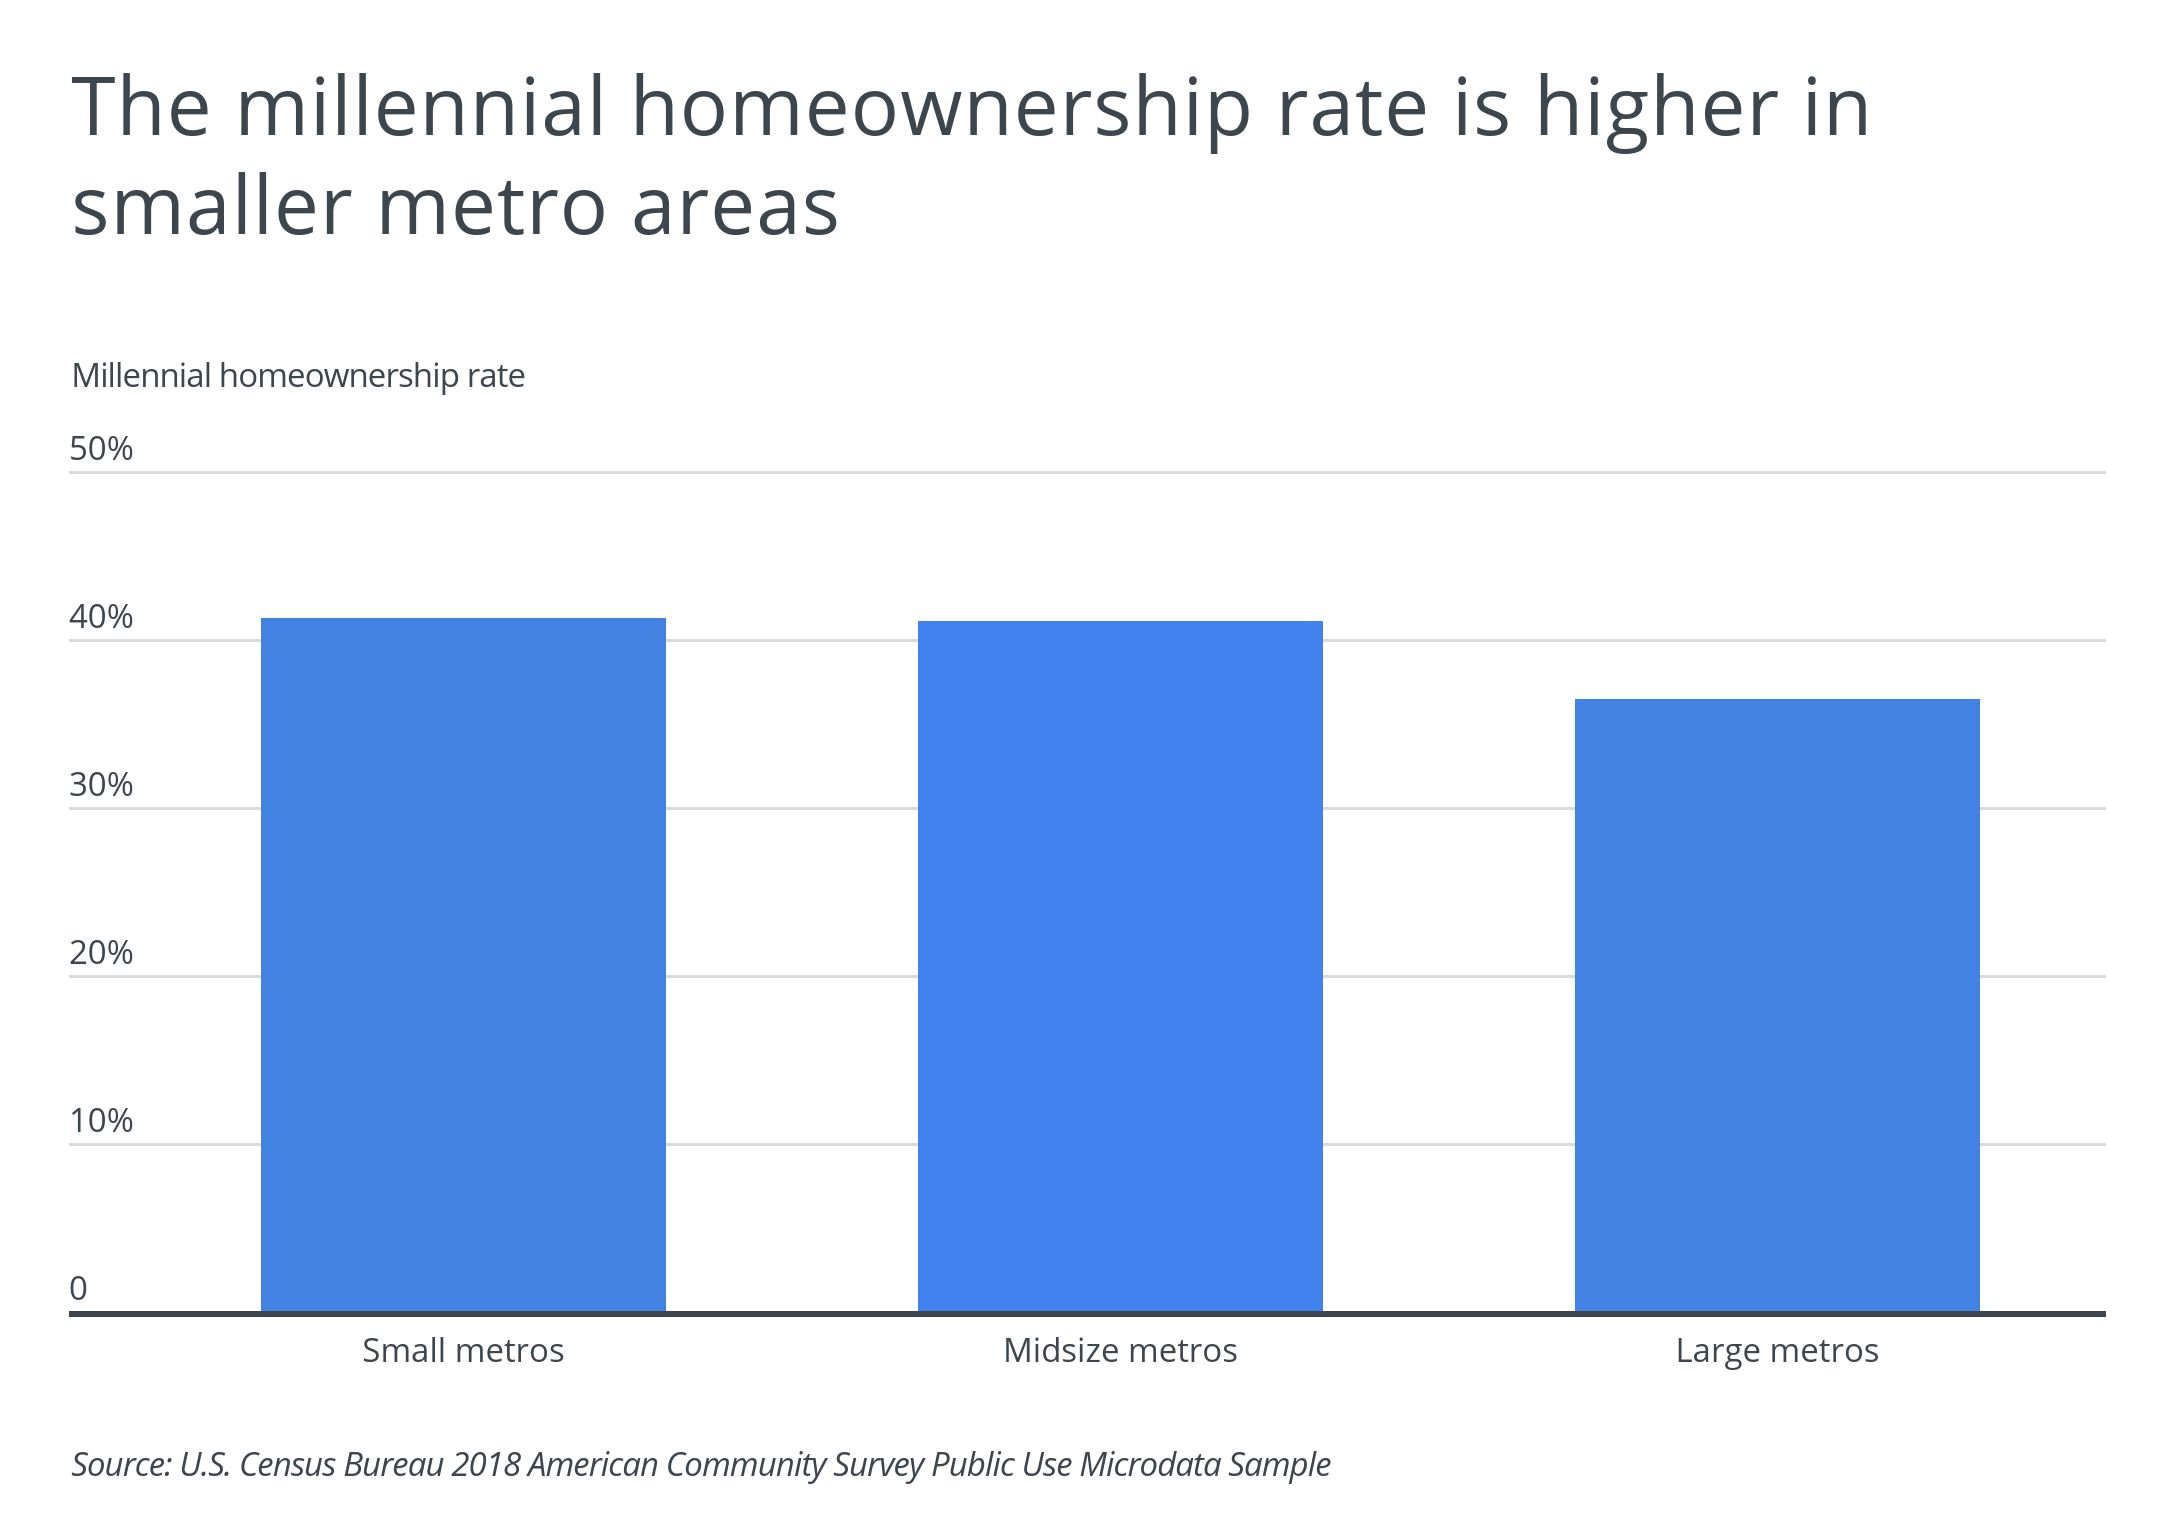
When looking at all metros segmented by size, millennial homeownership tends to be higher in the small and midsize metro groups than in the large metro group. The median homeownership rate across all large metros is 36.4 percent, while the median rates exceed 41 percent for both the small and midsize cohorts.
Homeownership and earnings statistics were derived from the U.S. Census Bureau’s American Community Survey Public Use Microdata Sample (ACS PUMS). Median home prices and monthly mortgage payments were calculated using the most recent Zillow Home Value Index, a measure of typical home value. Cost of living data was sourced from the Bureau of Economic Analysis’s Regional Price Parity data. The Pew Research Center’s definition of millennials is people born from 1981 to 1996; therefore, people aged 22-37 were used in the analysis of the ACS PUMS data.


