
Both new home sales and new home construction fell sharply in spring, during the onset of the COVID-19 pandemic. However, both have rebounded aggressively, with new home sales back above pre-COVID levels and new home construction nearing recent highs. This bounce-back has been fueled by a combination of low interest rates, increased demand, and a growing preference for low-density housing.
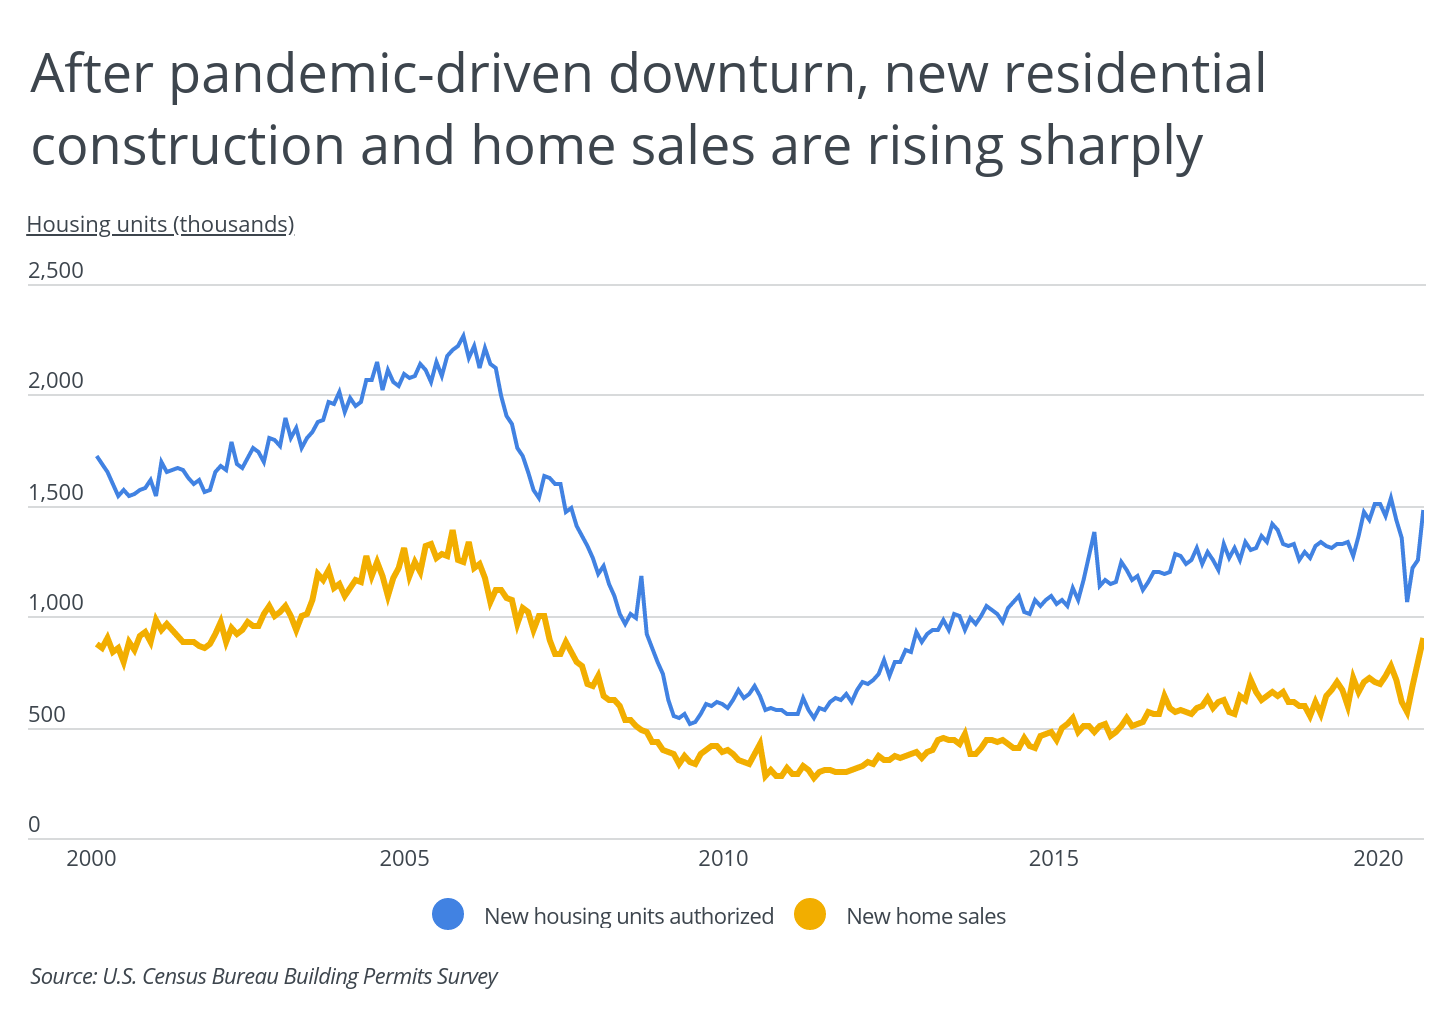
At the same time that the COVID-19 pandemic shifted home buyer demand toward low-density areas and larger homes, the lockdowns delayed peak home buying season creating pent up demand for new homes. This boost in demand for new homes compounds a longer-term trend in the housing market of millennials aging and entering their prime home-buying years. With this confluence of factors, prospective home buyers face a difficult situation—while low interest rates are lowering the cost of a mortgage, the limited supply of existing homes is creating stiff competition for new homes and raising prices.
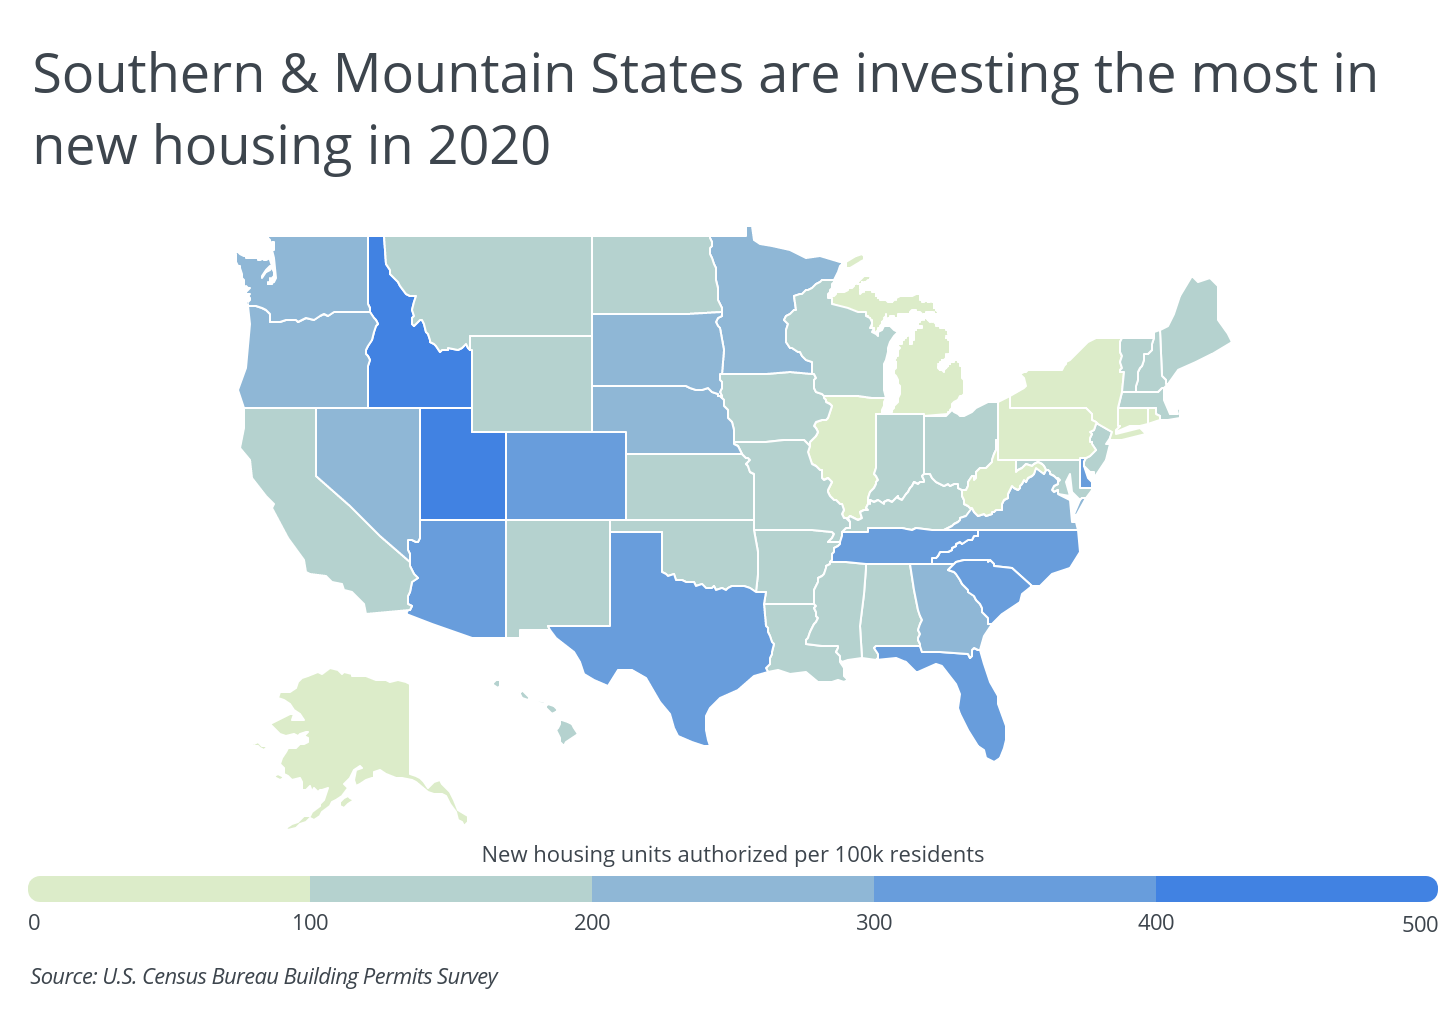
It will take home builders years to bridge the gap between the existing supply of homes for sale and the large number of interested buyers. However, investment in new housing varies significantly across the United States. Many U.S. states, particularly those in the South and Mountain regions, have been investing heavily in new housing this year despite the pandemic. Overall, Idaho, Utah, South Carolina, and Arizona have permitted the most new housing units per capita, while Texas and Florida have permitted the most units total. Northeastern states like Rhode Island, Connecticut, Pennsylvania, and New York are hardly investing in new homes at all.
TRENDING
Ash from wildfires and debris from storms and wind can leave layers of filth on a home’s exterior. Use Porch to learn what it will cost to power wash a home.
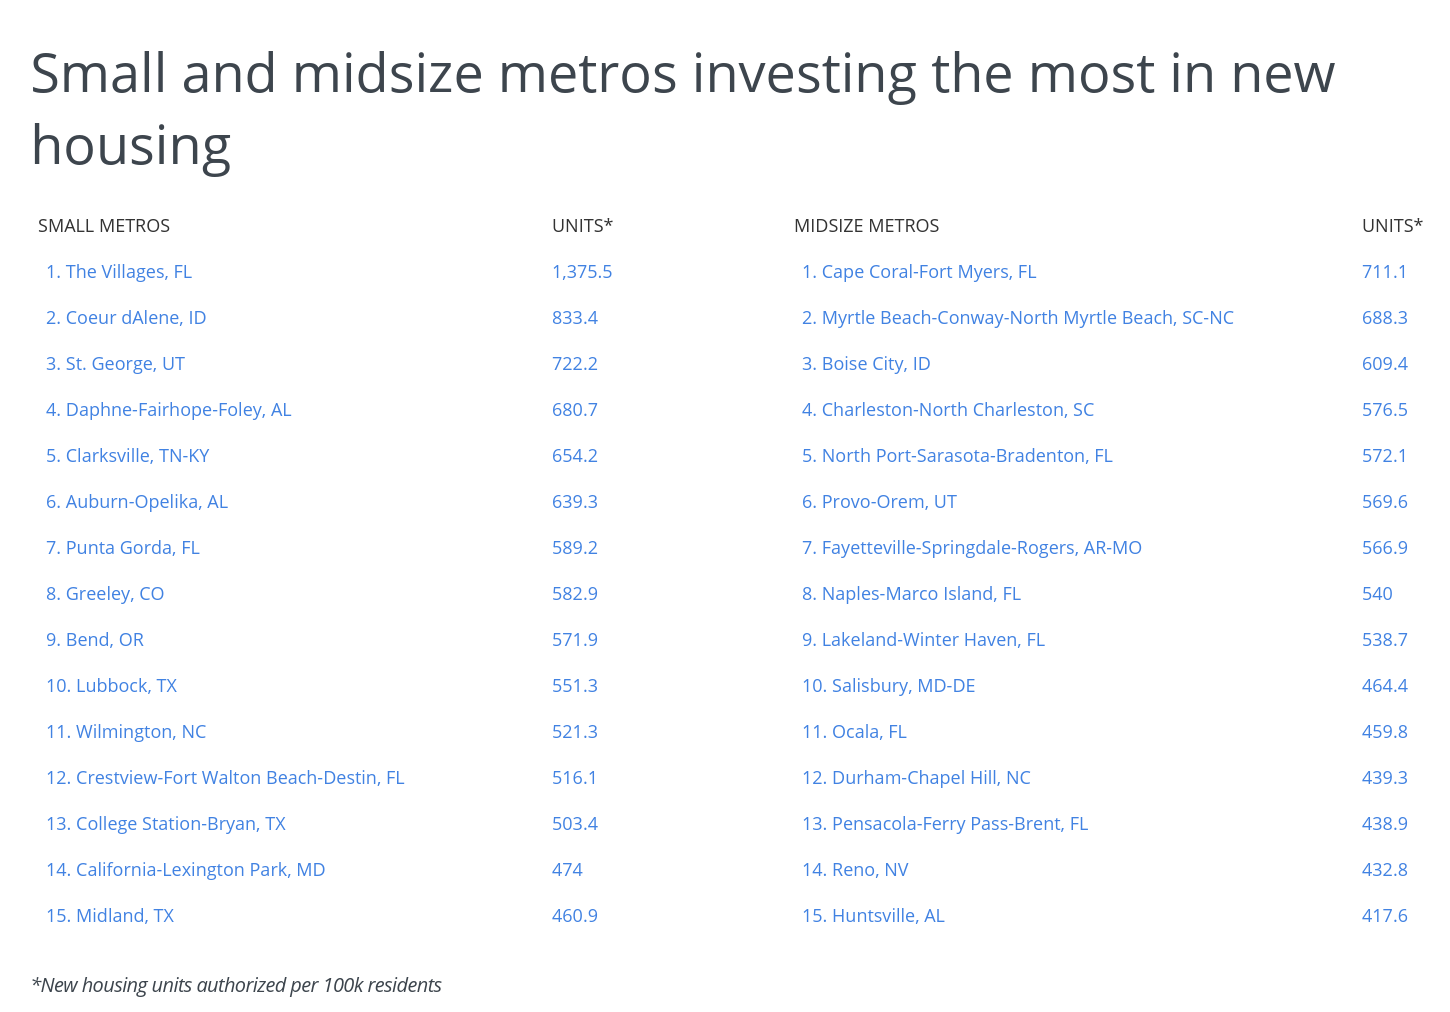
To see which metropolitan areas have been investing the most in new housing this year, researchers at Porch analyzed data from the U.S. Census Bureau’s Building Permits Survey. To rank locations, Porch calculated the number of new housing units authorized during the first six months of 2020 per 100,000 residents. Their researchers also included the absolute number of new housing units authorized, the median home price of existing homes, and the estimated value of newly authorized homes.
Only metropolitan areas with at least 100,000 residents and at least 70 percent coverage in the Building Permits Survey were included in the analysis. Additionally, metropolitan areas were grouped into the following cohorts based on population: large (1,000,000 or more), midsize (350,000-999,999), and small (100,000-349,999).
Among U.S. metros investing most in new housing, a disproportionate number are located in either Texas or Florida. On the other hand, Northeastern metros are notably absent from the list, with metros in that region investing less in new housing in 2020.
Here are the metropolitan areas with the largest investment toward new housing in 2020.
Large metros investing the most in new housing

Photo Credit: Alamy Stock Photo
15. Seattle-Tacoma-Bellevue, WA
- New housing units authorized (per 100k residents): 277.3
- Total new housing units authorized: 10,922
- Total value of new housing units authorized: $2,293,441,000
- Median home price (all existing homes): $551,311

Photo Credit: Alamy Stock Photo
14. Portland-Vancouver-Hillsboro, OR-WA
- New housing units authorized (per 100k residents): 287.3
- Total new housing units authorized: 7,121
- Total value of new housing units authorized: $1,490,071,000
- Median home price (all existing homes): $425,758
RELATED
Increase the value of your home. Trust Porch to guide you to the best local home builders for your home remodeling project.

Photo Credit: Alamy Stock Photo
13. Tampa-St. Petersburg-Clearwater, FL
- New housing units authorized (per 100k residents): 303.6
- Total new housing units authorized: 9,541
- Total value of new housing units authorized: $2,556,453,000
- Median home price (all existing homes): $239,208

Photo Credit: Alamy Stock Photo
12. San Antonio-New Braunfels, TX
- New housing units authorized (per 100k residents): 305.8
- Total new housing units authorized: 7,699
- Total value of new housing units authorized: $1,500,022,000
- Median home price (all existing homes): $210,845

Photo Credit: Alamy Stock Photo
11. Richmond, VA
- New housing units authorized (per 100k residents): 316.0
- Total new housing units authorized: 4,128
- Total value of new housing units authorized: $621,364,000
- Median home price (all existing homes): $255,333

Photo Credit: Alamy Stock Photo
10. Dallas-Fort Worth-Arlington, TX
- New housing units authorized (per 100k residents): 383.8
- Total new housing units authorized: 28,940
- Total value of new housing units authorized: $6,225,498,000
- Median home price (all existing homes): $259,586

Photo Credit: Alamy Stock Photo
9. Salt Lake City, UT
- New housing units authorized (per 100k residents): 424.2
- Total new housing units authorized: 5,186
- Total value of new housing units authorized: $1,051,269,000
- Median home price (all existing homes): $399,291

Photo Credit: Alamy Stock Photo
8. Charlotte-Concord-Gastonia, NC-SC
- New housing units authorized (per 100k residents): 436.4
- Total new housing units authorized: 11,213
- Total value of new housing units authorized: $2,404,963,000
- Median home price (all existing homes): $247,689

Photo Credit: Alamy Stock Photo
7. Orlando-Kissimmee-Sanford, FL
- New housing units authorized (per 100k residents): 439.5
- Total new housing units authorized: 11,308
- Total value of new housing units authorized: $2,426,454,000
- Median home price (all existing homes): $264,702

Photo Credit: Alamy Stock Photo
6. Phoenix-Mesa-Chandler, AZ
- New housing units authorized (per 100k residents): 439.9
- Total new housing units authorized: 21,368
- Total value of new housing units authorized: $4,785,115,000
- Median home price (all existing homes): $307,114

Photo Credit: Alamy Stock Photo
5. Houston-The Woodlands-Sugar Land, TX
- New housing units authorized (per 100k residents): 447.2
- Total new housing units authorized: 31,294
- Total value of new housing units authorized: $5,755,776,000
- Median home price (all existing homes): $222,271
Photo Credit: Alamy Stock Photo
4. Jacksonville, FL
- New housing units authorized (per 100k residents): 481.2
- Total new housing units authorized: 7,385
- Total value of new housing units authorized: $1,625,874,000
- Median home price (all existing homes): $239,049

Photo Credit: Alamy Stock Photo
3. Nashville-Davidson–Murfreesboro–Franklin, TN
- New housing units authorized (per 100k residents): 566.0
- Total new housing units authorized: 10,929
- Total value of new housing units authorized: $2,078,322,000
- Median home price (all existing homes): $289,094
TRENDING
Summer is almost over. Get a detailed estimate for the cost to replace a pool heater, cost to replace a hot water heater, wall heaters or baseboard heaters with Porch before the cold weather is here.

Photo Credit: Alamy Stock Photo
2. Raleigh-Cary, NC
- New housing units authorized (per 100k residents): 583.5
- Total new housing units authorized: 7,951
- Total value of new housing units authorized: $1,611,461,000
- Median home price (all existing homes): $290,266

Photo Credit: Alamy Stock Photo
1. Austin-Round Rock-Georgetown, TX
- New housing units authorized (per 100k residents): 878.7
- Total new housing units authorized: 19,052
- Total value of new housing units authorized: $3,046,784,000
- Median home price (all existing homes): $353,051
Methodology & detailed findings
The data used in this analysis is from the U.S. Census Bureau’s Building Permits Survey. The survey covers new housing projects authorized by building permits. For each location, Porch calculated the number of new housing units authorized during the first six months of 2020 per 100,000 residents. The resulting statistic was used to rank locations.
Home values are from the most recent Zillow Home Value Index, and population data is from the U.S. Census Bureau’s 2018 American Community Survey 1-Year Estimates.
Only metropolitan areas with at least 100,000 residents and at least 70 percent coverage in the Building Permits Survey were included in the analysis. Additionally, metropolitan areas were grouped into the following cohorts based on population: large (1,000,000 or more), midsize (350,000-999,999), and small (100,000-349,999).


