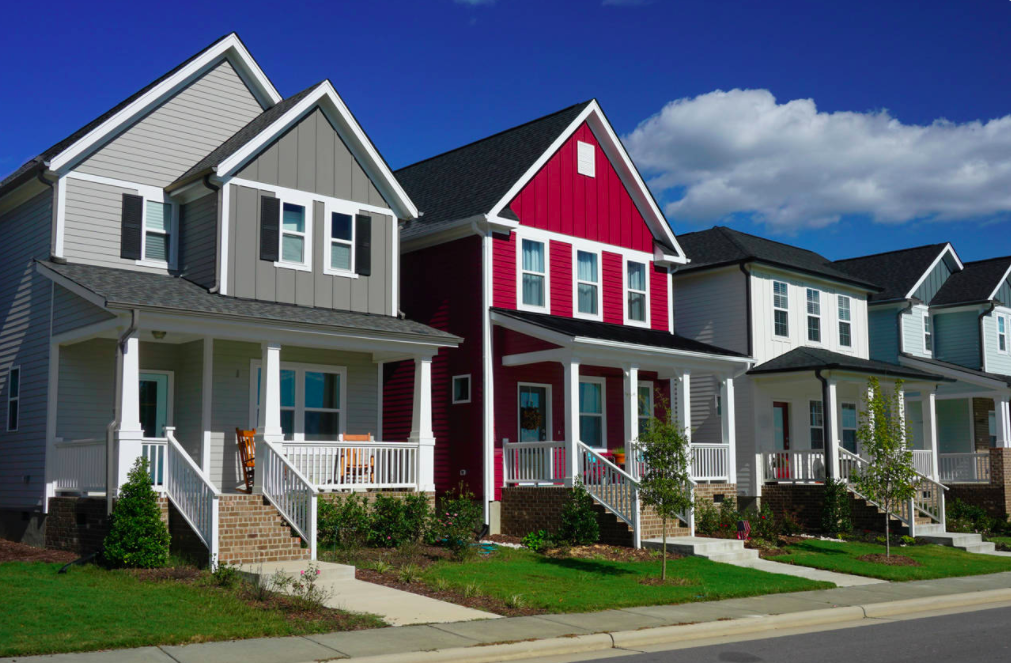
The COVID-19 pandemic has disrupted many aspects of life, and some of the most significant shifts have occurred in housing. More time spent working, schooling, and socializing at home in line with public health guidance has people increasingly reconsidering their living preferences. Simultaneously, spikes in unemployment, especially for low-income earners, have highlighted concerns about rental affordability with enormous implications for renters and landlords alike. This combination of factors could lead to high activity in some parts of the rental market while creating uncertainty or vulnerability in others.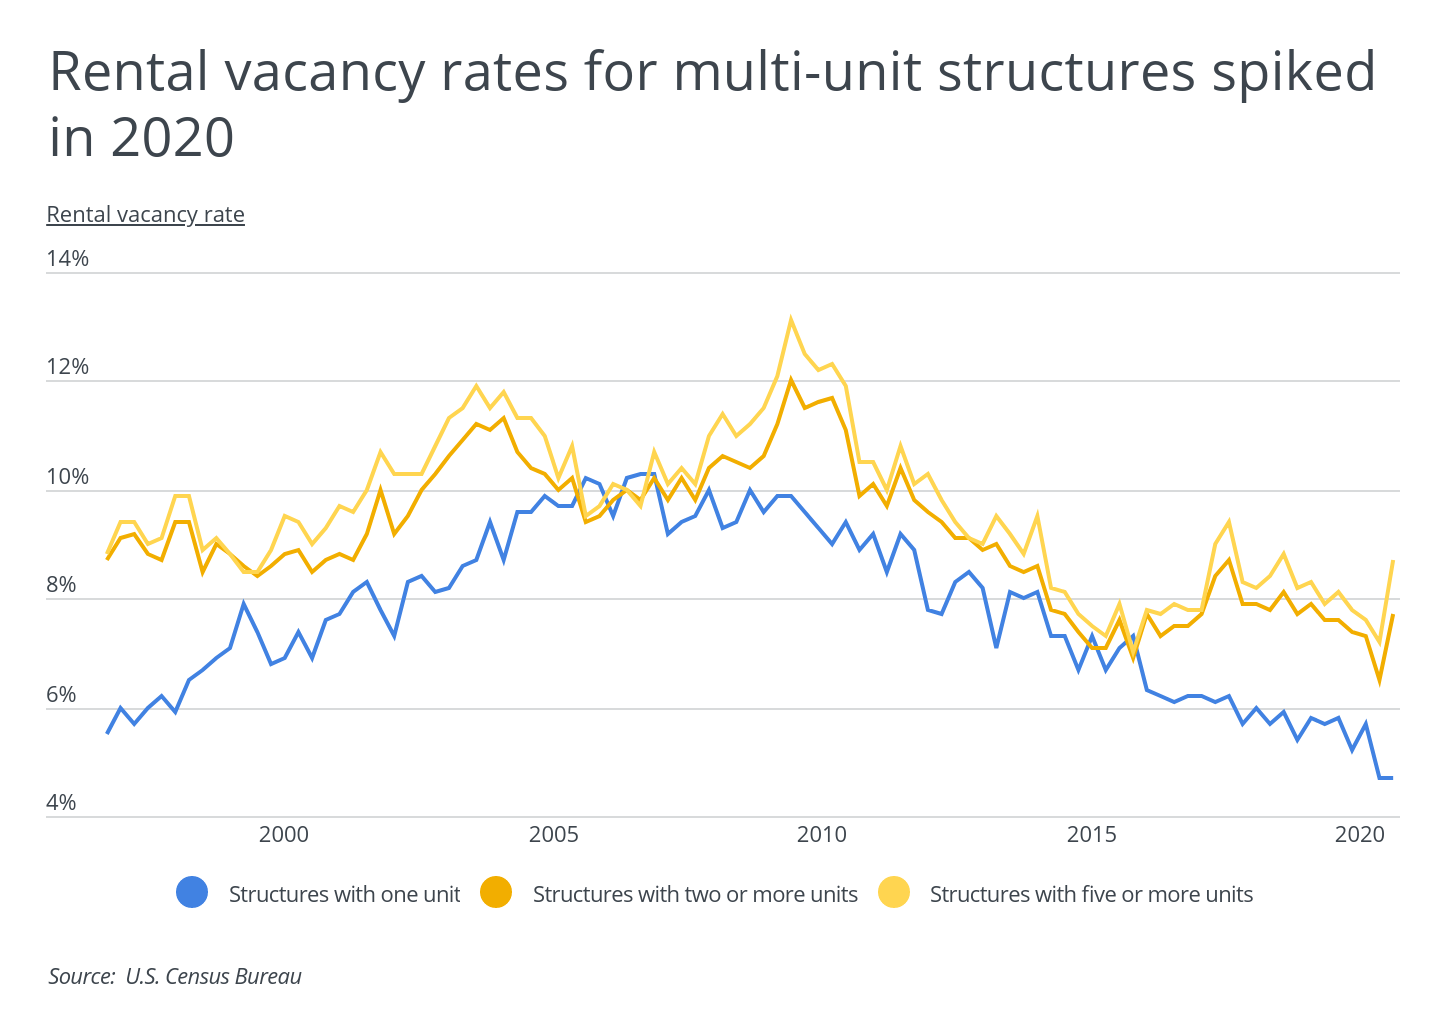
One of the areas where these trends are already playing out is in the types of units being rented, as renters show a stronger preference for single-unit rentals over structures with two or more units. Historically, vacancy rates for multi-unit rentals already tend to be higher than for single units. But following the onset of the virus, these figures diverged even more in late 2020, as vacancy rates spiked upward in multi-unit rentals while rates in single-unit rentals exhibited a similarly sharp decline. Whether from virus-related concerns about sharing spaces or a greater premium placed on space while working and schooling from home, COVID-19 has helped push vacancy rates for single-family rentals to historic lows.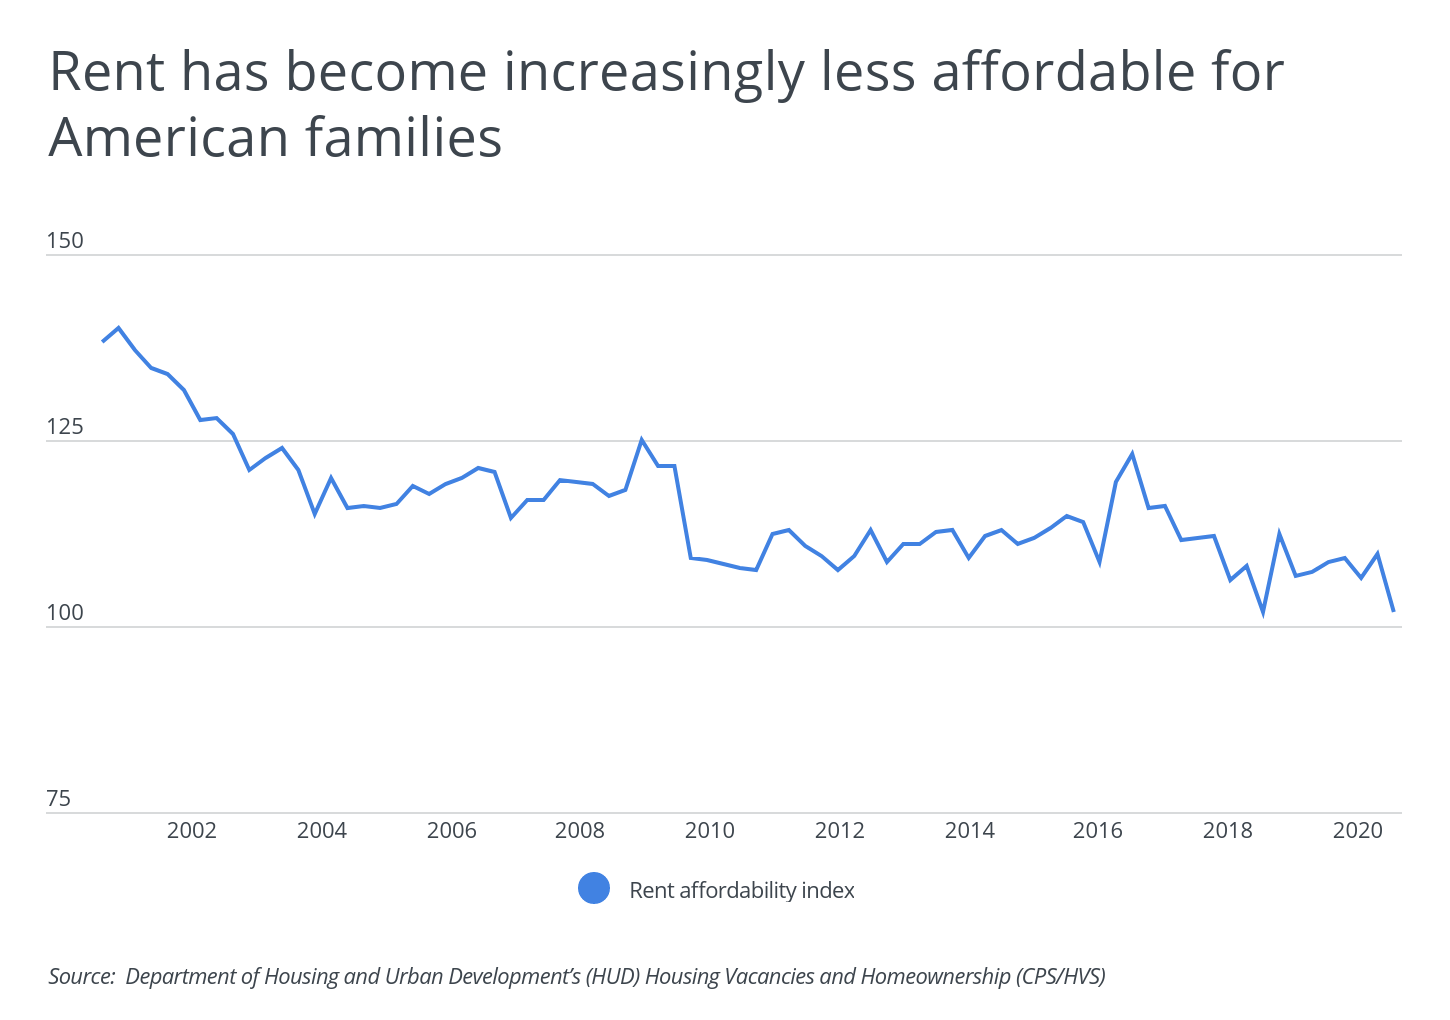
COVID-19 could also have long-term impacts on rental affordability. Already, it has become more expensive for most households to rent, according to the rental affordability index calculated by the U.S. Department of Housing and Urban Development. This index measures whether a typical renter household has enough income to qualify for a lease agreement on the typical rental home. When the index equals 100, the median income of renter households is just high enough to qualify for the median-priced rental unit nationally; the higher the index is above 100, the more likely it is that renters will qualify for a typical rental unit.
Even before COVID-19, the long-term trend in affordability was concerning, but with a steep tick downward in 2020, the index is now at its lowest point in the past two decades, just above 100. This means that currently, approximately 50% of potential renters—all those earning less than the median income—cannot afford the median monthly rental cost. Despite strong government efforts to stabilize the economy, COVID-19 has disproportionately harmed lower-income households, who are also more likely to rent. As long as heightened unemployment continues, these households may struggle with housing affordability.
DID YOU KNOW?
Porch has detailed cost guides for just about any home improvement project, including a custom cabinet installation, baseboard installation, and vinyl siding installation guide, among dozens more.
Given the trends in rental affordability, it is worth watching rental vacancy rates overall because vacancy rates tend to affect market prices. In markets where vacancy rates are high, prices tend to hold steady or decline in response to excess supply. When the vacancy rates are low, there is more competition, which allows landlords to raise rents. For renters in these areas, affordability may be even more of a concern in the future.
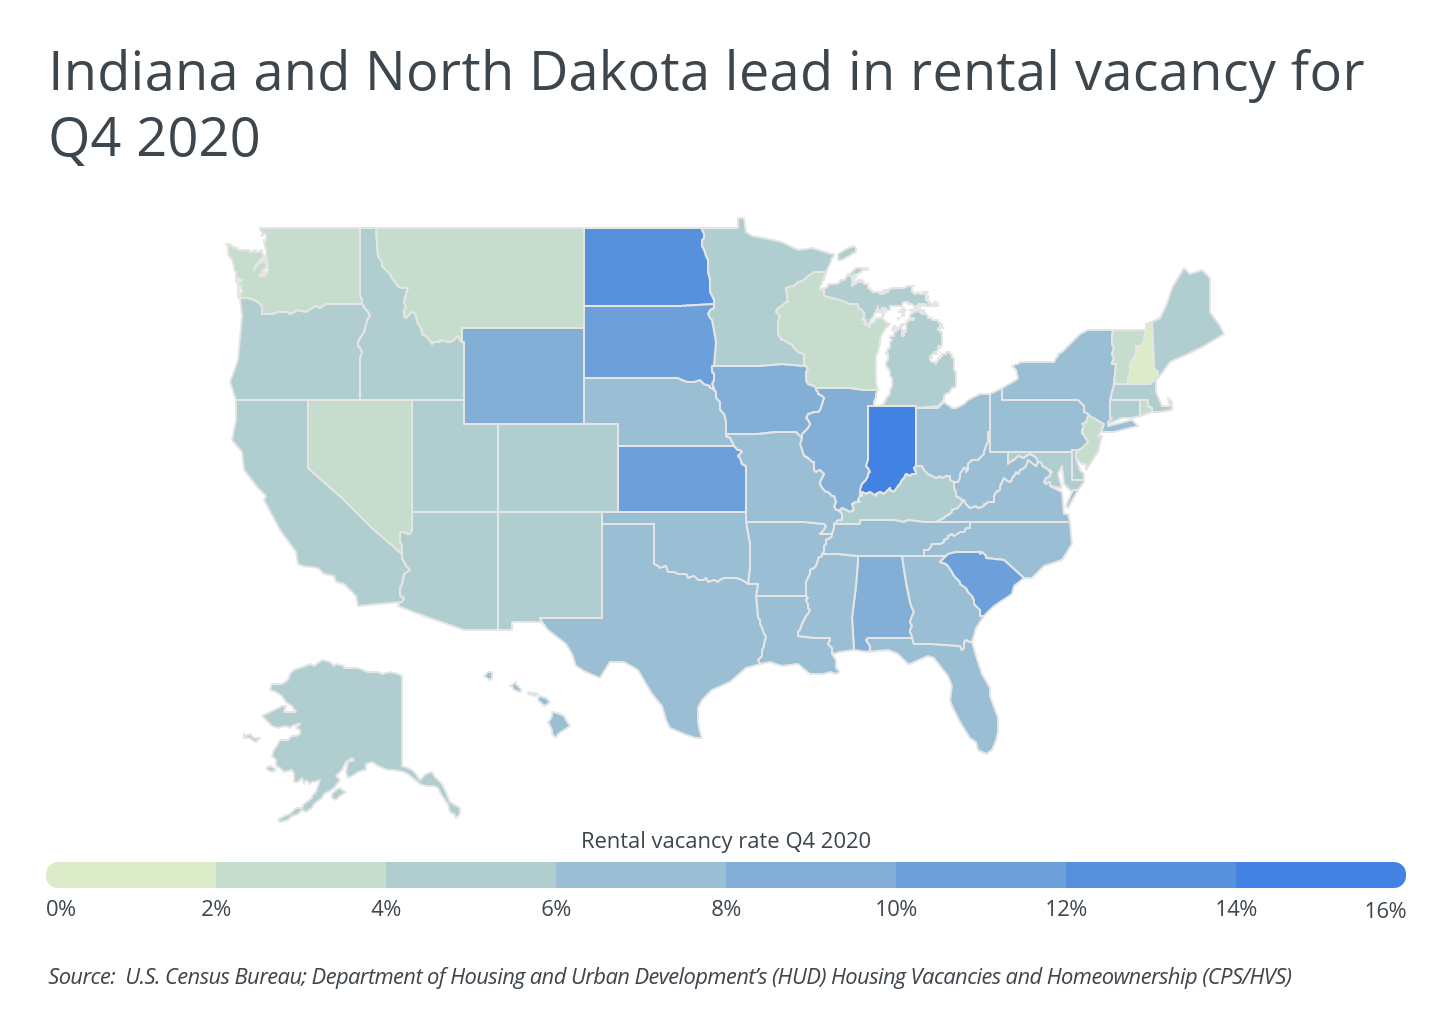
At the state level, many of the areas with the highest share of rental vacancies are concentrated in the Midwest. Leading the nation in rental vacancies are Indiana (15.5%) and North Dakota (13.6%), both of which have rental vacancy rates more than twice as high as the national average of 6.5%. On the other end of the spectrum, 17 states have rental vacancy rates of less than 5%, with New Hampshire reporting the nation’s lowest rate at 1.9%.
State-level data only tells part of the story, however. When looking at metropolitan areas, vacancy rates can vary substantially based on factors like whether the cities are attracting more residents, the available stock of housing, and the economic makeup of the population. For this reason, some states, like South Carolina and New York, have cities represented on both the list of cities with the most vacancies and the list of cities with the least.
To identify the [1] states and metros with the highest and lowest rental vacancy rates, researchers at Porch analyzed data from the U.S. Department of Housing and Urban Development and the Census Bureau. Porch researchers used vacancy rate data from the last quarter of 2020 to rank these locations and additionally gathered data on each location’s median rent and the percentage of households renting and owning.
When researching a city with reasonable vacancy rates, real estate investing market data can come in handy as it will help you analyze your preferred location from an investment perspective. That said, let’s go over the U.S. metros with the highest and lowest vacancy rates.
Metros With the Highest Rental Vacancy Rates

Photo Credit: Alamy Stock Photo
1. Charleston-North Charleston-Summerville, SC
- Rental vacancy rate Q4 2020: 28.8%
- Rental vacancy rate Q4 2019: 21.0%
- Median rent: $1,418
- Percentage of households that rent: 26.3%
- Percentage of households that own: 73.7%

Photo Credit: Alamy Stock Photo
2. Indianapolis-Carmel-Anderson, IN
- Rental vacancy rate Q4 2020: 17.1%
- Rental vacancy rate Q4 2019: 6.3%
- Median rent: $1,058
- Percentage of households that rent: 28.1%
- Percentage of households that own: 71.9%

Photo Credit: Alamy Stock Photo
3. Albany-Schenectady-Troy, NY
- Rental vacancy rate Q4 2020: 15.3%
- Rental vacancy rate Q4 2019: 15.6%
- Median rent: $1,138
- Percentage of households that rent: 26.9%
- Percentage of households that own: 73.1%
RELATED
Warmer months are just around the corner. If it’s time for a new AC unit, you can check out our hvac unit replacement cost guide to get you started.

Photo Credit: Alamy Stock Photo
4. Syracuse, NY
- Rental vacancy rate Q4 2020: 14.0%
- Rental vacancy rate Q4 2019: 11.8%
- Median rent: $959
- Percentage of households that rent: 34.7%
- Percentage of households that own: 65.3%
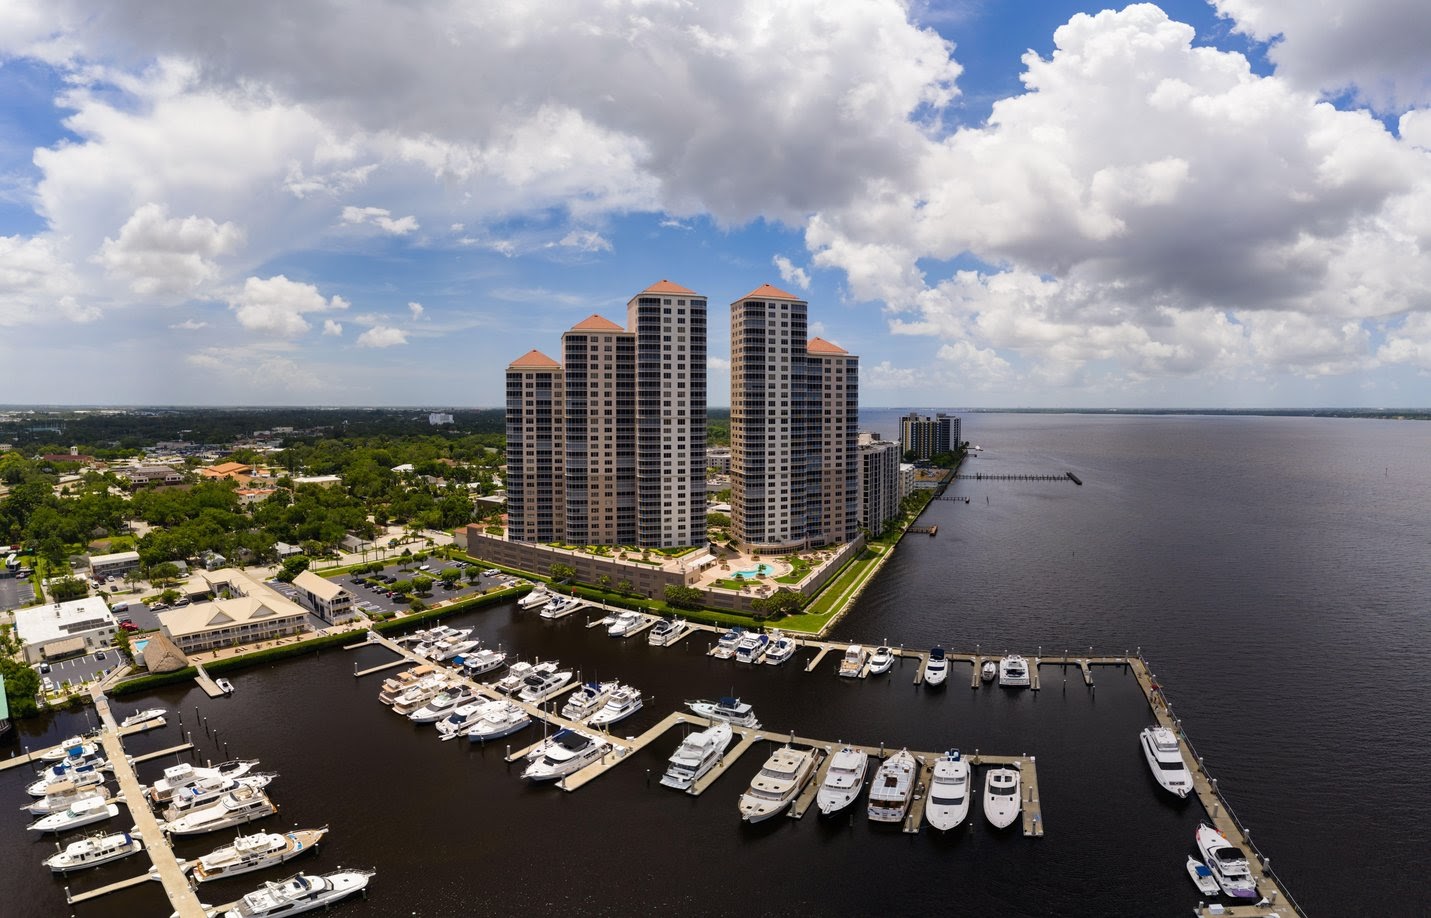
Photo Credit: Alamy Stock Photo
5. Cape Coral-Fort Myers, FL
- Rental vacancy rate Q4 2020: 12.8%
- Rental vacancy rate Q4 2019: 5.8%
- Median rent: $1,387
- Percentage of households that rent: 20.8%
- Percentage of households that own: 79.2%

Photo Credit: Alamy Stock Photo
6. Birmingham-Hoover, AL
- Rental vacancy rate Q4 2020: 10.9%
- Rental vacancy rate Q4 2019: 9.8%
- Median rent: $1,166
- Percentage of households that rent: 22.9%
- Percentage of households that own: 77.1%

Photo Credit: Alamy Stock Photo
7. Baton Rouge, LA
- Rental vacancy rate Q4 2020: 10.3%
- Rental vacancy rate Q4 2019: 12.8%
- Median rent: $1,034
- Percentage of households that rent: 28.4%
- Percentage of households that own: 71.6%

Photo Credit: Alamy Stock Photo
8. Cincinnati, OH-KY-IN
- Rental vacancy rate Q4 2020: 10.0%
- Rental vacancy rate Q4 2019: 9.3%
- Median rent: $966
- Percentage of households that rent: 25.9%
- Percentage of households that own: 74.1%

Photo Credit: Alamy Stock Photo
9. Dayton, OH
- Rental vacancy rate Q4 2020: 8.8%
- Rental vacancy rate Q4 2019: 9.7%
- Median rent: $867
- Percentage of households that rent: 33.2%
- Percentage of households that own: 66.8%
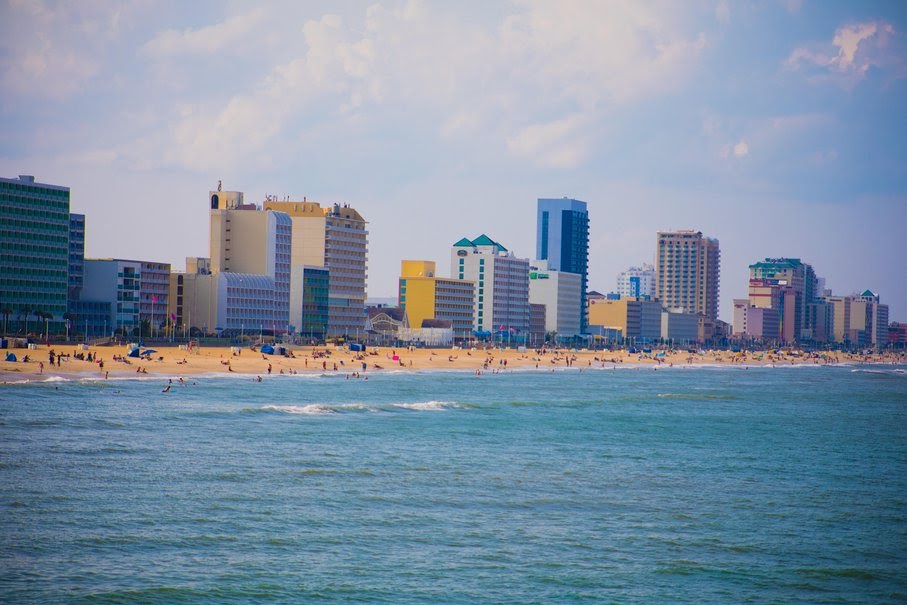
Photo Credit: Alamy Stock Photo
10. Virginia Beach-Norfolk-Newport News, VA-NC
- Rental vacancy rate Q4 2020: 8.7%
- Rental vacancy rate Q4 2019: 7.3%
- Median rent: $1,417
- Percentage of households that rent: 28.4%
- Percentage of households that own: 71.6%
Metros with the lowest rental vacancy rates
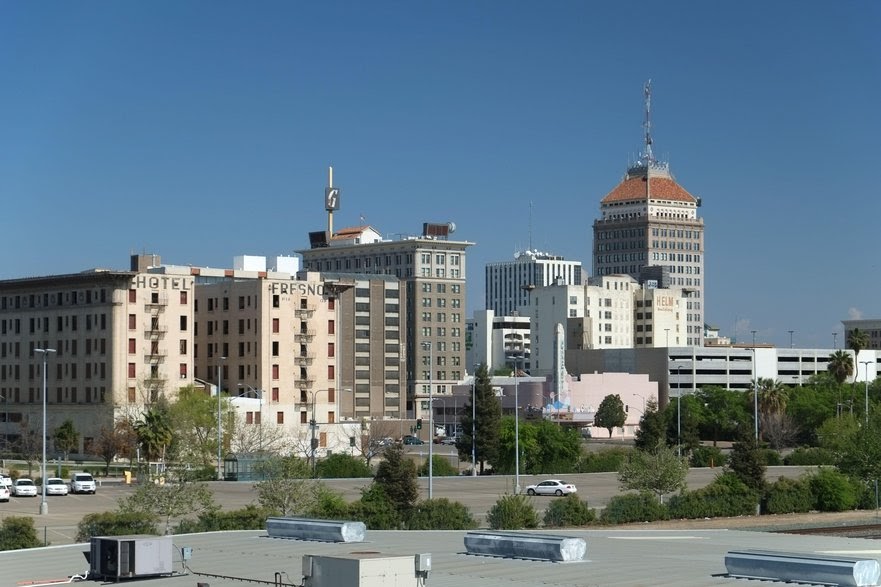
Photo Credit: Alamy Stock Photo
1. Fresno, CA
- Rental vacancy rate Q4 2020: 0.7%
- Rental vacancy rate Q4 2019: 3.9%
- Median rent: $1,160
- Percentage of households that rent: 44.2%
- Percentage of households that own: 55.8%

Photo Credit: Alamy Stock Photo
2. Worcester, MA
- Rental vacancy rate Q4 2020: 1.0%
- Rental vacancy rate Q4 2019: 0.4%
- Median rent: $1,512
- Percentage of households that rent: 40.8%
- Percentage of households that own: 59.2%
RELATED
Whether it’s time for massaging jets or if you just need a simple upgrade, a bathtub replacement can do wonders for your bathroom and increase the value of your home.

Photo Credit: Alamy Stock Photo
3. Rochester, NY
- Rental vacancy rate Q4 2020: 1.7%
- Rental vacancy rate Q4 2019: 3.0%
- Median rent: $1,017
- Percentage of households that rent: 29.9%
- Percentage of households that own: 70.1%

Photo Credit: Alamy Stock Photo
4. Columbia, SC
- Rental vacancy rate Q4 2020: 1.9%
- Rental vacancy rate Q4 2019: 10.7%
- Median rent: $1,113
- Percentage of households that rent: 30.0%
- Percentage of households that own: 70.0%

Photo Credit: Alamy Stock Photo
5. Raleigh, NC
- Rental vacancy rate Q4 2020: 2.5%
- Rental vacancy rate Q4 2019: 4.6%
- Median rent: $1,359
- Percentage of households that rent: 35.8%
- Percentage of households that own: 64.2%

Photo Credit: Alamy Stock Photo
6. Allentown-Bethlehem-Easton, PA-NJ
- Rental vacancy rate Q4 2020: 2.5%
- Rental vacancy rate Q4 2019: 6.1%
- Median rent: $1,146
- Percentage of households that rent: 28.1%
- Percentage of households that own: 71.9%

Photo Credit: Alamy Stock Photo
7. Richmond, VA
- Rental vacancy rate Q4 2020: 2.7%
- Rental vacancy rate Q4 2019: 7.1%
- Median rent: $1,267
- Percentage of households that rent: 43.7%
- Percentage of households that own: 56.3%

Photo Credit: Alamy Stock Photo
8. Grand Rapids-Wyoming, MI
- Rental vacancy rate Q4 2020: 2.8%
- Rental vacancy rate Q4 2019: 5.5%
- Median rent: $1,096
- Percentage of households that rent: 25.7%
- Percentage of households that own: 74.3%

Photo Credit: Alamy Stock Photo
9. Las Vegas-Henderson-Paradise, NV
- Rental vacancy rate Q4 2020: 2.9%
- Rental vacancy rate Q4 2019: 5.6%
- Median rent: $1,328
- Percentage of households that rent: 45.3%
- Percentage of households that own: 54.7%

Photo Credit: Alamy Stock Photo
10. Greensboro-High Point, NC
- Rental vacancy rate Q4 2020: 2.9%
- Rental vacancy rate Q4 2019: 10.9%
- Median rent: $992
- Percentage of households that rent: 33.1%
- Percentage of households that own: 66.9%
Detailed Findings & Methodology
The data used in this analysis is from the U.S. Census Bureau’s2019 American Community Survey and the Department of Housing and Urban Development’s (HUD) Housing Vacancies and Homeownership (CPS/HVS). Median rent was calculated as the weighted average rent for a studio, one-, two-, three-, and four-bedroom rental. States and metros were ranked based on the rental vacancy rate from quarter four of 2020. In the event of a tie, the rental vacancy from quarter four of 2019 was used. Only the nation’s largest metropolitan statistical areas covered in the CPS data were included in the analysis.


