As mortgage rates reach historic lows, prospective home buyers are in a strong position to purchase their first house. One of the most important questions prospective home buyers need to answer is whether they would prefer to buy a new or old home. However, housing inventory varies significantly by location and some parts of the country are more likely than others to have new homes.
Newly constructed homes have a lot of benefits for home buyers. According to a recent survey by the National Association of Realtors, buyers who purchase new homes enjoy having access to new community amenities, smart home features, higher energy efficiency, and new systems and appliances that shouldn’t soon require replacement or renovation. By contrast, buyers who purchase previously owned homes tend to prioritize affordability or value.
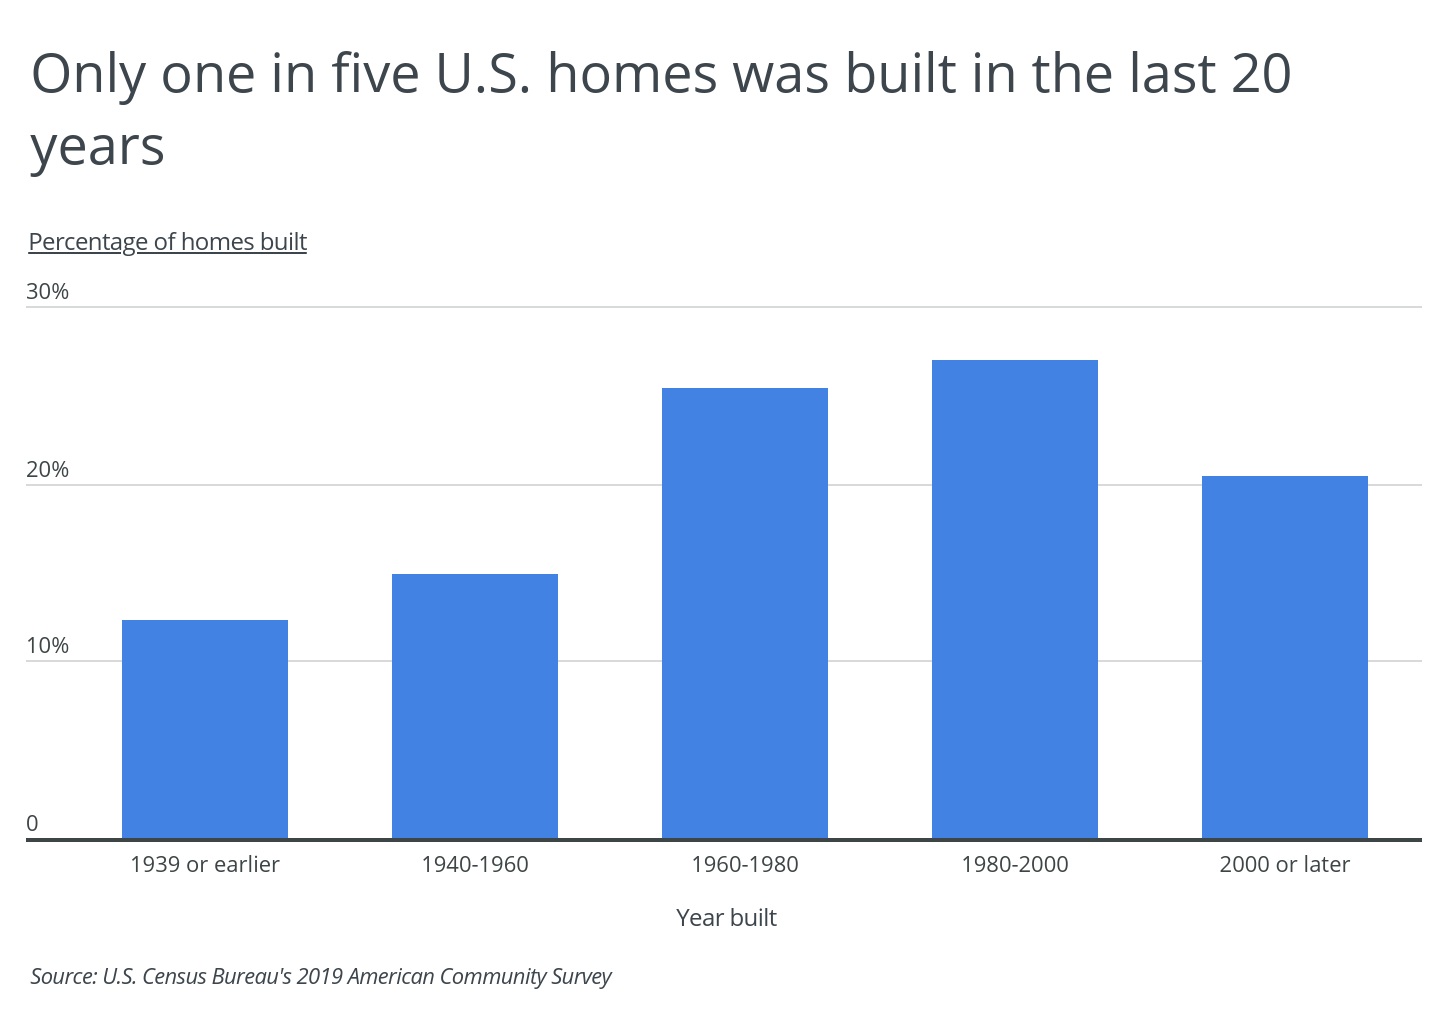
Research from the National Association of Home Builders shows that in 2018, 31 percent of home buyers wanted to purchase a brand-new home offered by a builder. For millennial home buyers, that number was even higher at 41 percent. However, according to data from the Census Bureau, only 20.4 percent of all homes in the U.S. were built in the past two decades. Furthermore, only 4.6 percent of homes were constructed after 2014. This constraint on inventory indicates that even if a home buyer would prefer a new home, they may not be able to find one.
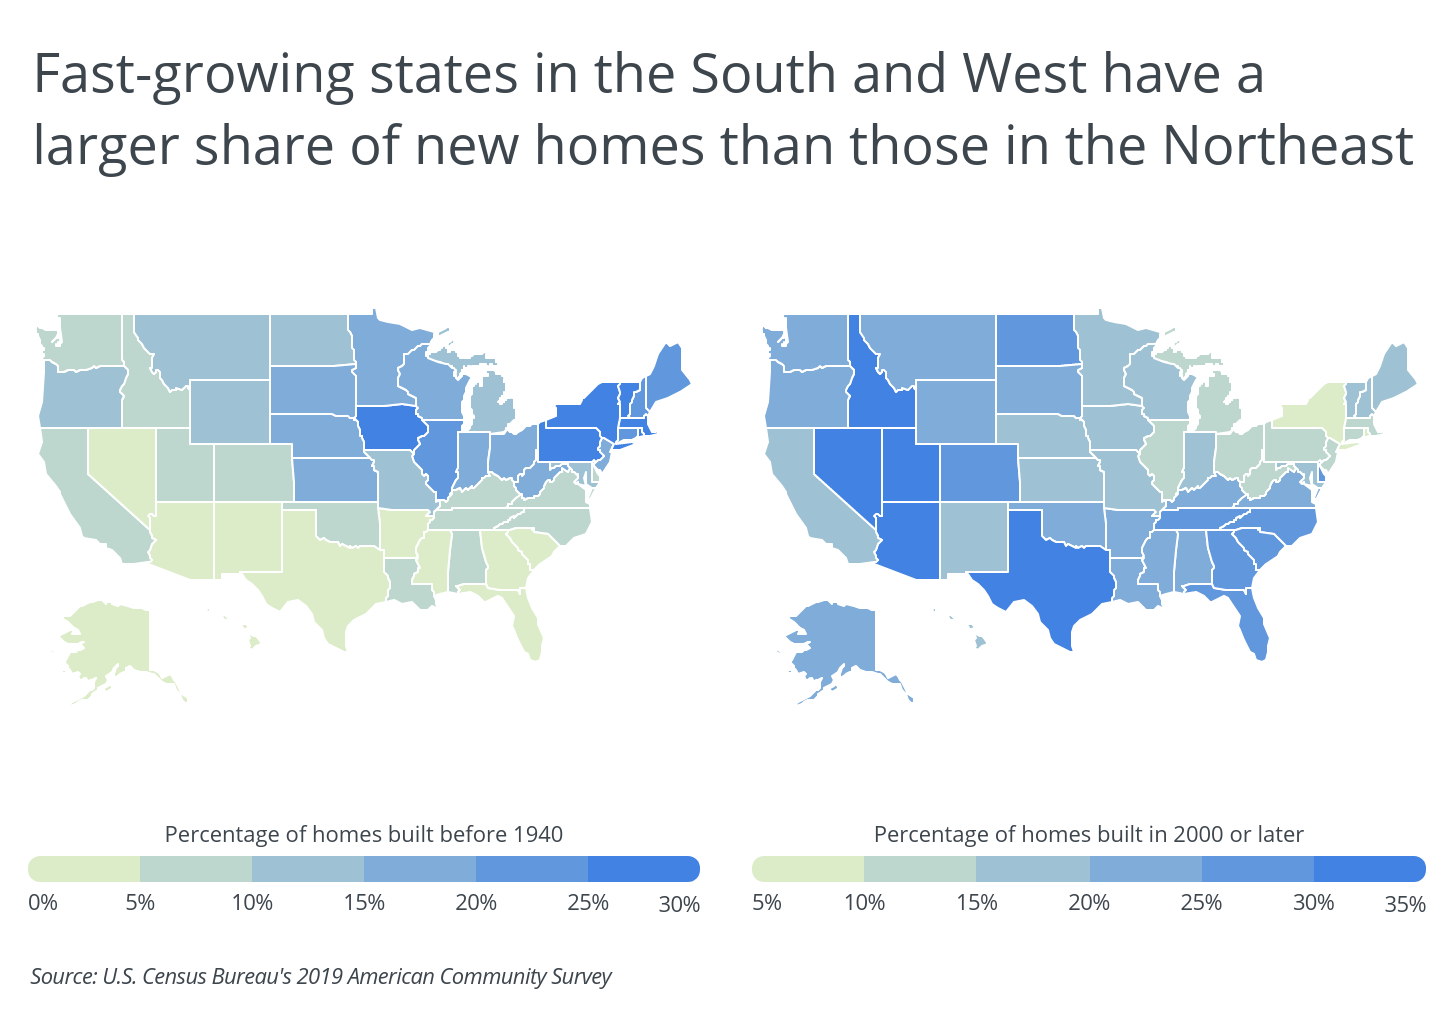
Even though new housing inventory is limited nationwide, there are some locations where buyers are more likely to find a newer home. More specifically, states in the South and the West have a larger percentage of new homes. More than 30 percent of homes in Nevada, Utah, Texas, Arizona, and Idaho were built after 2000. On the other hand, the states with the lowest share of new homes are located in the Northeast and include Rhode Island (7.1 percent), New York (9.7 percent), and Massachusetts (11.6 percent). In fact, for these Northeast states—some of the oldest in the country—more than 30 percent of houses were constructed before 1940.
TRENDING
Porch makes it easy to get detailed cost estimates for common home improvements and repairs, such as the cost to replace a hot water heater, the cost of installing a concrete slab, and more.
At a more local level, some fast-growing cities are experiencing a boom in housing construction, increasing the share of new homes on the market. To find which cities have the highest percentage of homes built after 2000, researchers at Porch analyzed housing data from the U.S. Census Bureau’s 2019 American Community Survey 1-Year Estimates and pricing data from the Zillow Home Value Index.
Cities were categorized into groups based on population size: small (100,000–149,999), midsize (150,000–349,999), and large (350,000 or more). Similar to the statewide trends, the cities with the most homes built after 2000 are all located in the South and the West.
Here are the cities with the most new homes.

Large cities with the most new homes

Photo Credit: Alamy Stock Photo
15. Colorado Springs, CO
- Percentage of homes built in 2000 or later: 24.9%
- Number of homes built in 2000 or later: 49,653
- Percentage of homes that are single-family: 68.7%
- Median number of rooms per home: 5.8
- Median home price: $339,146

Photo Credit: Alamy Stock Photo
14. San Antonio, TX
- Percentage of homes built in 2000 or later: 25.4%
- Number of homes built in 2000 or later: 142,342
- Percentage of homes that are single-family: 63.0%
- Median number of rooms per home: 5.1
- Median home price: $191,405
RELATED
Looking to do a home renovation project? Find costs for vinyl siding, power wash a house, install pavers, and more projects on Porch.

Photo Credit: Alamy Stock Photo
13. El Paso, TX
- Percentage of homes built in 2000 or later: 26.3%
- Number of homes built in 2000 or later: 65,842
- Percentage of homes that are single-family: 70.5%
- Median number of rooms per home: 5.2
- Median home price: $141,955

Photo Credit: Alamy Stock Photo
12. Nashville, TN
- Percentage of homes built in 2000 or later: 26.8%
- Number of homes built in 2000 or later: 84,090
- Percentage of homes that are single-family: 58.7%
- Median number of rooms per home: 5.0
- Median home price: $299,838

Photo Credit: Alamy Stock Photo
11. Jacksonville, FL
- Percentage of homes built in 2000 or later: 27.4%
- Number of homes built in 2000 or later: 108,679
- Percentage of homes that are single-family: 65.3%
- Median number of rooms per home: 5.5
- Median home price: $202,568

Photo Credit: Alamy Stock Photo
10. Tampa, FL
- Percentage of homes built in 2000 or later: 27.7%
- Number of homes built in 2000 or later: 48,277
- Percentage of homes that are single-family: 58.9%
- Median number of rooms per home: 4.9
- Median home price: $264,815

Photo Credit: Alamy Stock Photo
9. Seattle, WA
- Percentage of homes built in 2000 or later: 28.7%
- Number of homes built in 2000 or later: 106,592
- Percentage of homes that are single-family: 44.9%
- Median number of rooms per home: 4.1
- Median home price: $780,126

Photo Credit: Alamy Stock Photo
8. Las Vegas, NV
- Percentage of homes built in 2000 or later: 28.8%
- Number of homes built in 2000 or later: 74,581
- Percentage of homes that are single-family: 66.3%
- Median number of rooms per home: 5.1
- Median home price: $296,730

Photo Credit: Alamy Stock Photo
7. Miami, FL
- Percentage of homes built in 2000 or later: 29.6%
- Number of homes built in 2000 or later: 65,449
- Percentage of homes that are single-family: 32.9%
- Median number of rooms per home: 3.8
- Median home price: $378,798

Photo Credit: Alamy Stock Photo
6. Bakersfield, CA
- Percentage of homes built in 2000 or later: 31.0%
- Number of homes built in 2000 or later: 38,763
- Percentage of homes that are single-family: 74.9%
- Median number of rooms per home: 5.2
- Median home price: $263,046

Photo Credit: Alamy Stock Photo
5. Charlotte, NC
- Percentage of homes built in 2000 or later: 33.8%
- Number of homes built in 2000 or later: 126,802
- Percentage of homes that are single-family: 62.8%
- Median number of rooms per home: 5.3
- Median home price: $262,385

Photo Credit: Alamy Stock Photo
4. Atlanta, GA
- Percentage of homes built in 2000 or later: 34.5%
- Number of homes built in 2000 or later: 87,366
- Percentage of homes that are single-family: 43.6%
- Median number of rooms per home: 4.6
- Median home price: $301,901

Photo Credit: Alamy Stock Photo
3. Fort Worth, TX
- Percentage of homes built in 2000 or later: 34.5%
- Number of homes built in 2000 or later: 119,489
- Percentage of homes that are single-family: 68.4%
- Median number of rooms per home: 5.3
- Median home price: $216,935
TRENDING
Porch is a powerful resource for homeowners making renovations. Whether installing kitchen cabinets, installing a fence, or replacing a bathtub, Porch has guides to help.

Photo Credit: Alamy Stock Photo
2. Austin, TX
- Percentage of homes built in 2000 or later: 36.2%
- Number of homes built in 2000 or later: 160,003
- Percentage of homes that are single-family: 49.4%
- Median number of rooms per home: 4.5
- Median home price: $422,252

Photo Credit: Alamy Stock Photo
1. Raleigh, NC
- Percentage of homes built in 2000 or later: 36.5%
- Number of homes built in 2000 or later: 75,088
- Percentage of homes that are single-family: 58.5%
- Median number of rooms per home: 5.1
- Median home price: $297,861
Methodology & detailed findings
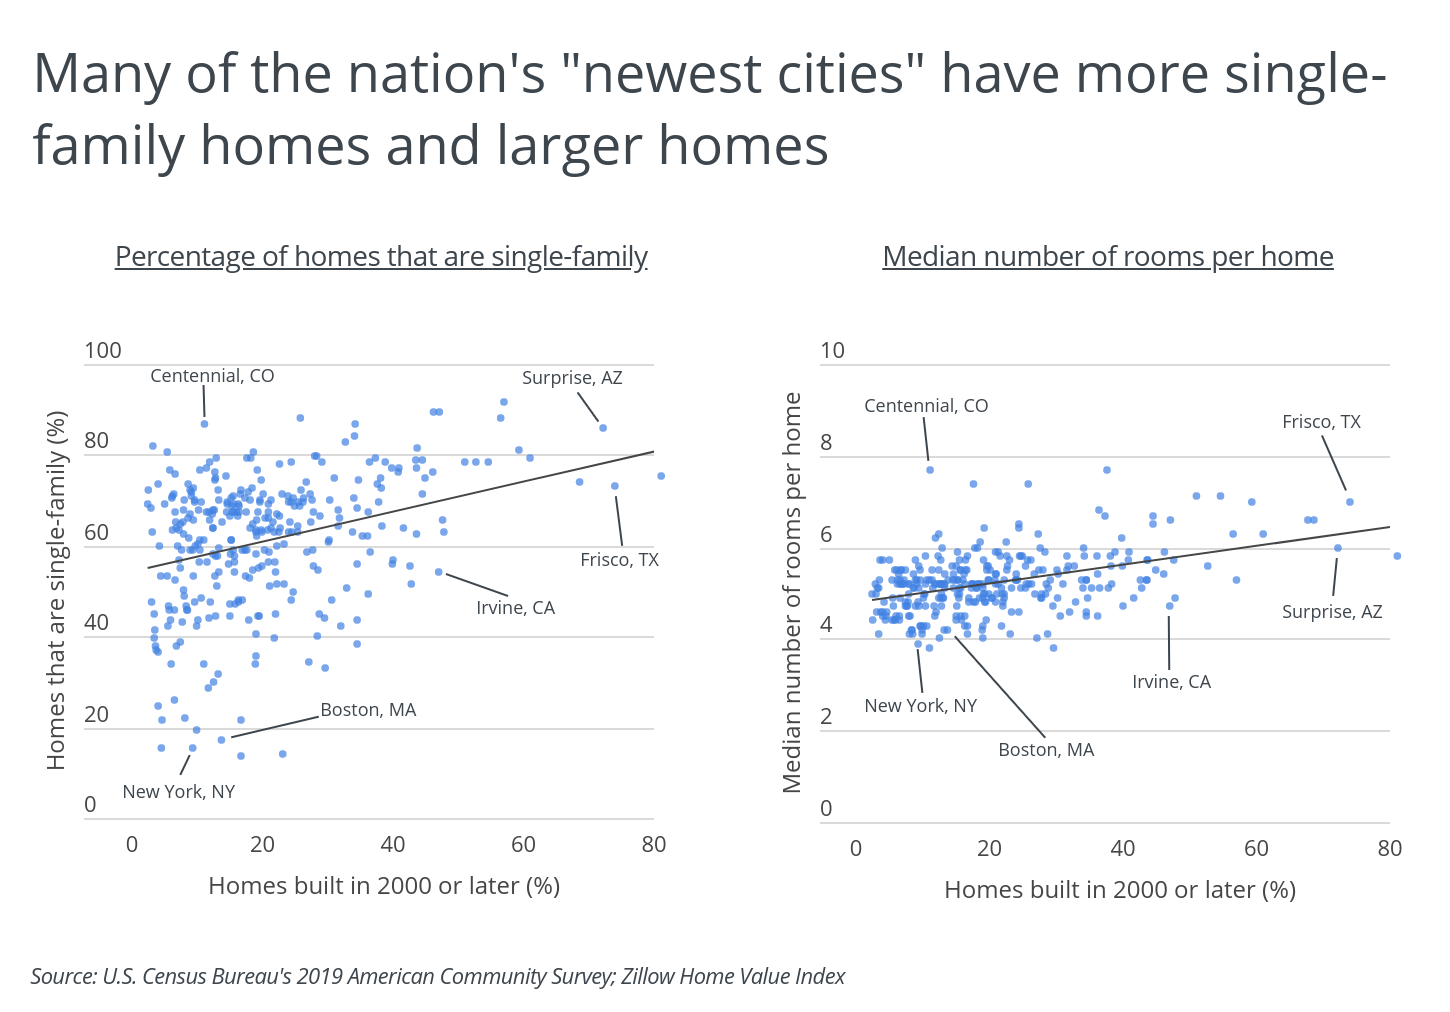
Cities with higher shares of homes built after 2000 tend to have higher percentages of single-family homes and larger homes. For reference, 67.1 percent of homes nationwide are single-family, and the national median number of rooms in a home is 5.5. Fast growing, newer cities, with higher numbers of single family homes and larger average home sizes, are likely to attract people leaving older, crowded cities as they seek lower-density areas and space to work from home.
Apart from price, all housing data used in this analysis is from the U.S. Census Bureau 2019 American Community Survey 1-Year Estimates. Pricing data is from the Zillow Home Value Index. To identify the locations with the newest homes, researchers calculated the percentage of housing units built in 2000 or later. In the event of a tie, the location with more total housing units built since 2000 was ranked higher. The data on year built includes both occupied and vacant housing units. Year built refers to when the building was first constructed, not when it was remodeled. Both single-family homes and housing units in multi-unit structures (e.g. apartments, condominiums, etc.) are included.
To improve relevance, cities were grouped into cohorts based on population size: small (100,000–149,999), midsize (150,000–349,999), and large (350,000 or more). Additionally, only cities with at least 100,000 residents and data available from both Zillow and the Census Bureau were included.

