
The U.S. solar industry has grown significantly in the last decade as solar power has become more affordable, efficient, and accessible. Since 2014, the cost of solar photovoltaic (PV) panels has dropped by almost 50 percent. The U.S. now has over 2 million solar PV installations, which produce enough electricity each year to power more than 12 million homes. According to data from Google’s Project Sunroof, the share of solar-viable buildings that have a solar installation in the U.S. is a mere 1.2 percent, but many cities boast much larger percentages.
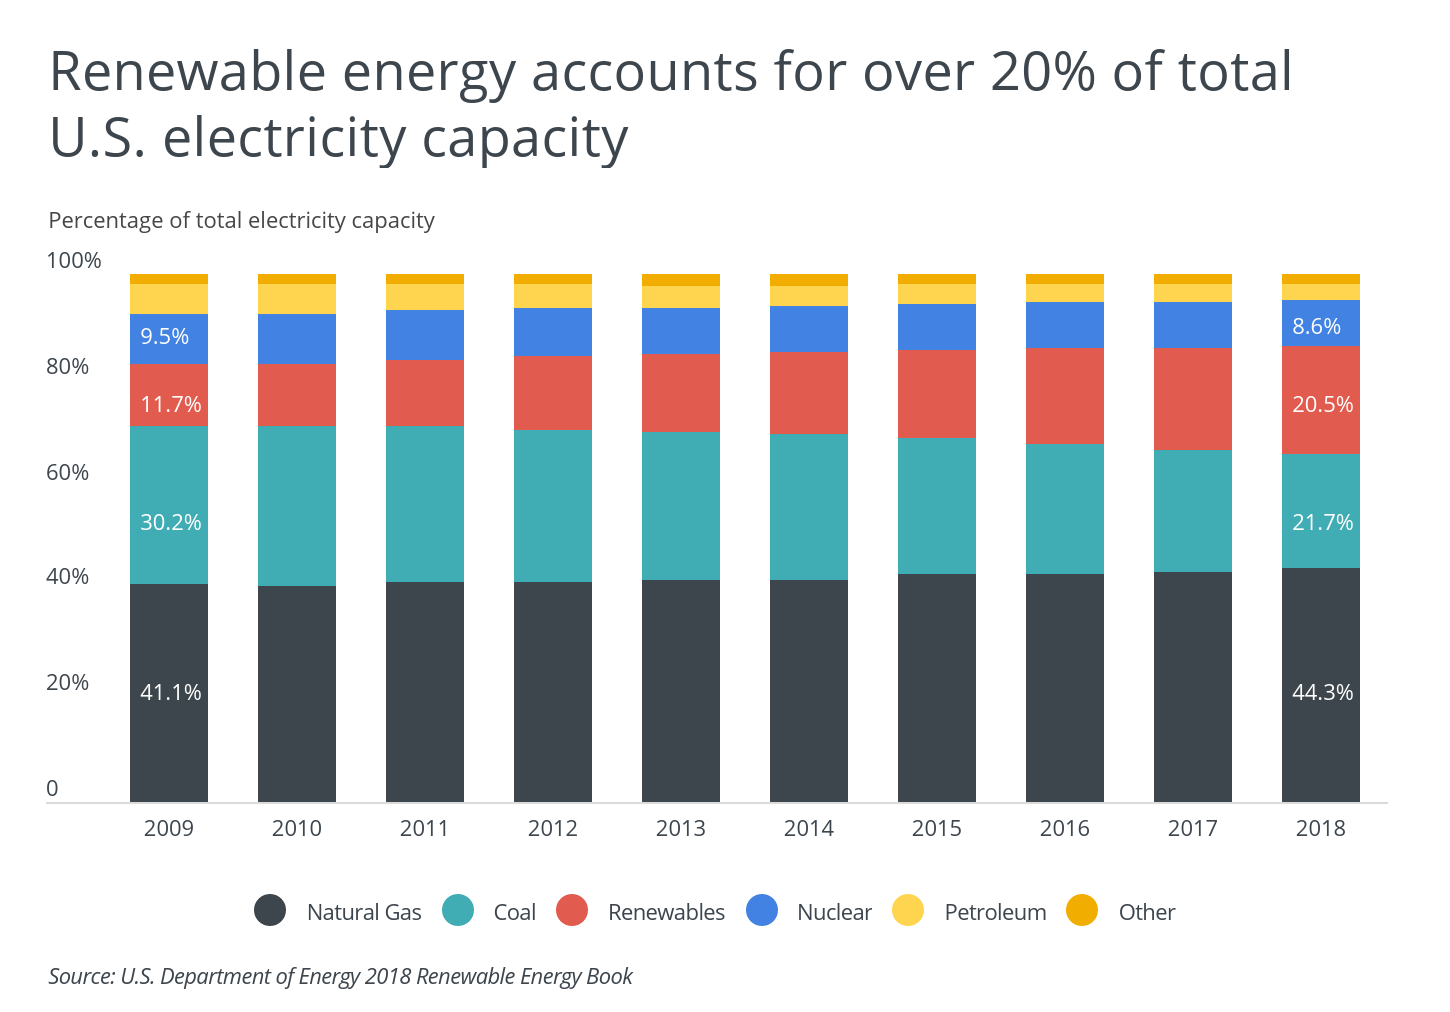
In the first quarter of 2020, solar made up 40 percent of new electricity generating capacity added in the U.S. The increase in solar is part of a trend toward increased utilization of renewable energy, including solar, wind, biomass, hydropower, and geothermal. As of 2018, renewables accounted for over 20 percent of total electricity capacity, up from less than 12 percent in 2009.
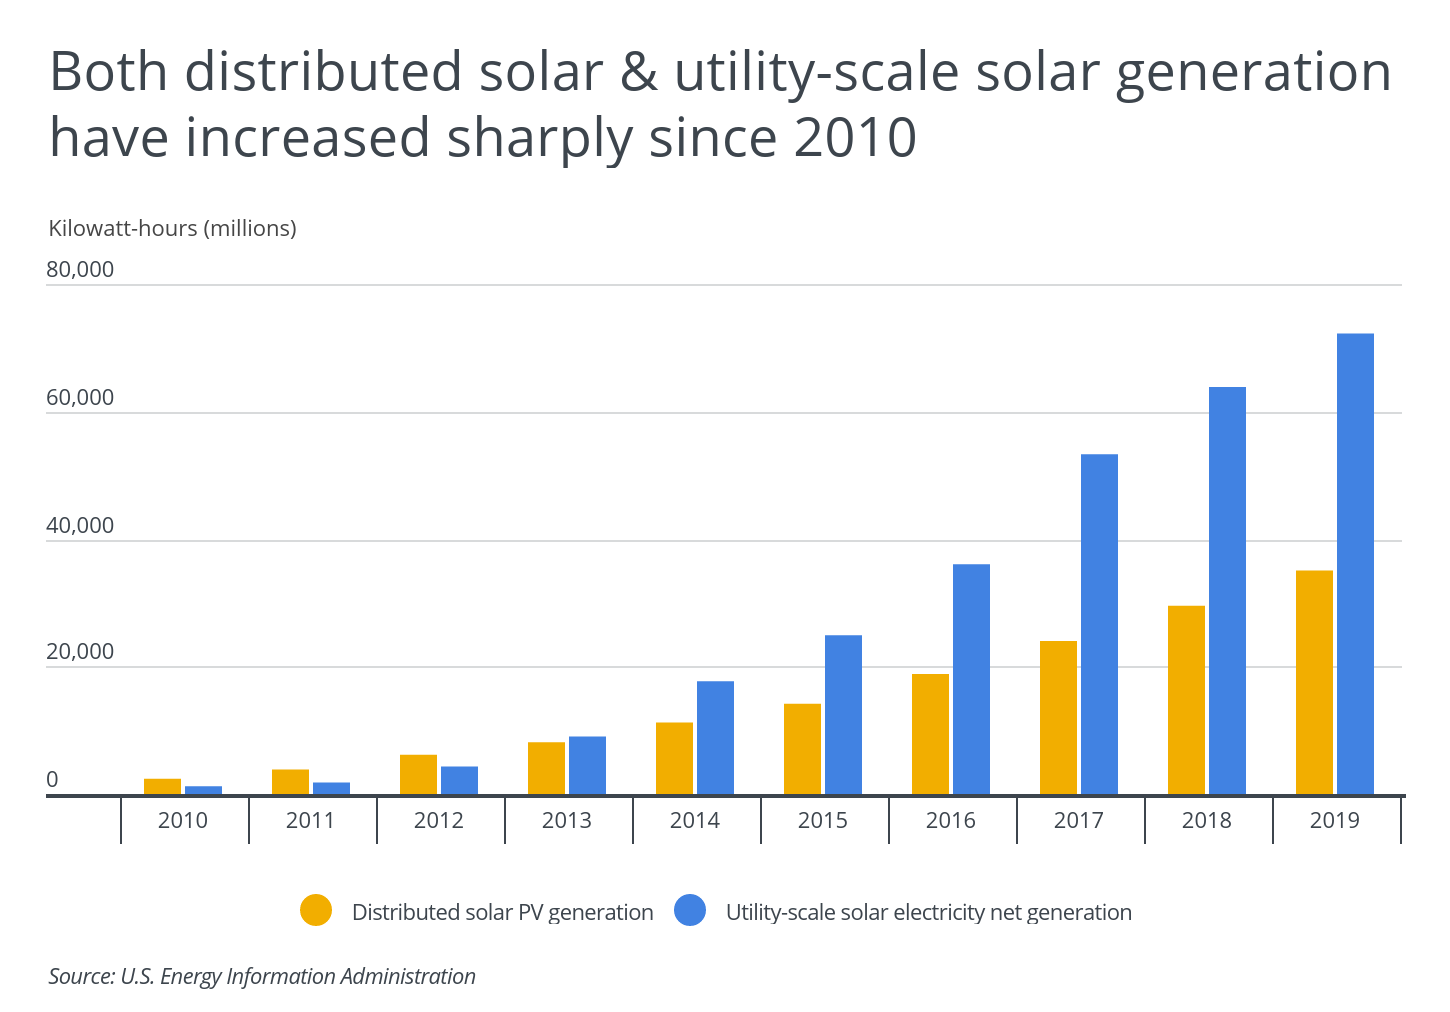
Compared to other nations, the U.S. ranks second (behind China) in renewable electricity capacity. When considering just solar PV capacity, the U.S. ranks third behind China and Japan. In the U.S., increases in solar capacity and generation have come from both utility-scale and distributed PV installations. Utility-scale solar facilities produce power that is fed into the electrical grid and ultimately sold to customers in different locations. On the other hand, distributed solar installations (such as commercial and residential rooftop installations) are smaller in size and produce electricity at the location it is consumed. Utility-scale solar generation has increased nearly 60-fold since 2010, and small-scale distributed solar PV generation has increased by almost 15-fold over the same time span.
RELATED
Porch makes it easy to schedule home repairs with trusted professionals. Some of our most popular professional services include replacing a bathtub, windows replacement, replace a toilet and more.
While solar energy has come down greatly in cost, price is still a barrier to many U.S. households who want to invest in rooftop solar. To help offset the installation cost, a federal solar tax credit allows taxpayers to deduct 26 percent of the cost of installing a solar energy system. Additionally, many states offer solar rebates for home solar energy systems. California even mandates that new construction homes have a solar PV system.
Not surprisingly, solar energy use and investment varies considerably across states and cities. Geographic areas that receive a lot of sunlight are more conducive to solar energy, but high air temperatures make PV panels less efficient. At the state level, Hawaii and California have the largest share of solar-viable buildings equipped with solar systems, at 12.4 percent and 3.9 percent, respectively. North Dakota and South Dakota have the lowest shares of viable buildings with solar, both at close to 0.03 percent.

To determine the cities investing the most in solar energy, researchers at Porch, a marketplace for home services, analyzed the latest data on small-scale rooftop solar installations from Google’s Project Sunroof. The researchers ranked cities according to the share of viable buildings with solar. Researchers also looked at the total number of buildings with solar, the share of all buildings that are solar-viable, the total buildings that are solar-viable, and the median annual solar potential per viable roof. For context, the average annual electricity consumption for an American home is 10,972 kilowatt-hours per year.
To improve relevance, only cities with at least 100,000 people were included in the analysis. Additionally, cities were grouped into the following cohorts based on population size:
- Small cities: 100,000-149,999
- Midsize cities: 150,000-349,999
- Large cities: more than 350,000
Here are the cities investing the most in solar.
Large cities investing the most in solar energy

Photo Credit: Alamy Stock Photo
15. Long Beach, CA
- Share of viable buildings with solar: 1.6%
- Total buildings with solar: 1,469
- Share of all buildings that are solar-viable: 84.3%
- Total buildings that are solar-viable: 91,992
- Median annual solar potential per viable roof: 10,353 kilowatt-hours
RELATED
Considering a new home project? Luckily, Porch makes it easy to get cost estimates for common repairs and improvements, such as the cost of installing a concrete slab, install a laminated floor, the cost to power wash a house, and more.

Photo Credit: Alamy Stock Photo
14. Sacramento, CA
- Share of viable buildings with solar: 2.2%
- Total buildings with solar: 2,860
- Share of all buildings that are solar-viable: 89.4%
- Total buildings that are solar-viable: 131,992
- Median annual solar potential per viable roof: 15,653 kilowatt-hours

Photo Credit: Alamy Stock Photo
13. Phoenix, AZ
- Share of viable buildings with solar: 2.4%
- Total buildings with solar: 10,487
- Share of all buildings that are solar-viable: 96.3%
- Total buildings that are solar-viable: 429,903
- Median annual solar potential per viable roof: 22,721 kilowatt-hours

Photo Credit: Alamy Stock Photo
12. Aurora, CO
- Share of viable buildings with solar: 2.5%
- Total buildings with solar: 1,956
- Share of all buildings that are solar-viable: 88.8%
- Total buildings that are solar-viable: 77,120
- Median annual solar potential per viable roof: 11,859 kilowatt-hours

Photo Credit: Alamy Stock Photo
11. Las Vegas, NV
- Share of viable buildings with solar: 2.5%
- Total buildings with solar: 3,093
- Share of all buildings that are solar-viable: 96.5%
- Total buildings that are solar-viable: 124,293
- Median annual solar potential per viable roof: 18,552 kilowatt-hours

Photo Credit: Alamy Stock Photo
10. Los Angeles, CA
- Share of viable buildings with solar: 2.7%
- Total buildings with solar: 17,231
- Share of all buildings that are solar-viable: 82.0%
- Total buildings that are solar-viable: 647,621
- Median annual solar potential per viable roof: 12,356 kilowatt-hours

Photo Credit: Alamy Stock Photo
9. Denver, CO
- Share of viable buildings with solar: 2.8%
- Total buildings with solar: 3,582
- Share of all buildings that are solar-viable: 72.1%
- Total buildings that are solar-viable: 129,386
- Median annual solar potential per viable roof: 9,023 kilowatt-hours

Photo Credit: Alamy Stock Photo
8. Tucson, AZ
- Share of viable buildings with solar: 2.8%
- Total buildings with solar: 4,437
- Share of all buildings that are solar-viable: 94.7%
- Total buildings that are solar-viable: 155,813
- Median annual solar potential per viable roof: 22,212 kilowatt-hours
RELATED
It can be tough finding reliable local professionals to work on your home. With Porch, you can view ratings and get detailed cost estimates for the best painters, home builders, and more.

Photo Credit: Alamy Stock Photo
7. Oakland, CA
- Share of viable buildings with solar: 2.9%
- Total buildings with solar: 2,617
- Share of all buildings that are solar-viable: 90.2%
- Total buildings that are solar-viable: 89,195
- Median annual solar potential per viable roof: 12,450 kilowatt-hours
Photo Credit: Alamy Stock Photo
6. Anaheim, CA
- Share of viable buildings with solar: 3.3%
- Total buildings with solar: 2,133
- Share of all buildings that are solar-viable: 96.5%
- Total buildings that are solar-viable: 64,663
- Median annual solar potential per viable roof: 23,004 kilowatt-hours

Photo Credit: Alamy Stock Photo
5. New Orleans, LA
- Share of viable buildings with solar: 3.4%
- Total buildings with solar: 4,322
- Share of all buildings that are solar-viable: 94.3%
- Total buildings that are solar-viable: 126,208
- Median annual solar potential per viable roof: 17,876 kilowatt-hours
Photo Credit: Alamy Stock Photo
4. Bakersfield, CA
- Share of viable buildings with solar: 4.5%
- Total buildings with solar: 4,607
- Share of all buildings that are solar-viable: 97.4%
- Total buildings that are solar-viable: 101,638
- Median annual solar potential per viable roof: 24,811 kilowatt-hours

Photo Credit: Alamy Stock Photo
3. Fresno, CA
- Share of viable buildings with solar: 5.1%
- Total buildings with solar: 6,945
- Share of all buildings that are solar-viable: 95.6%
- Total buildings that are solar-viable: 135,515
- Median annual solar potential per viable roof: 21,795 kilowatt-hours

Photo Credit: Alamy Stock Photo
2. San Diego, CA
- Share of viable buildings with solar: 5.8%
- Total buildings with solar: 17,281
- Share of all buildings that are solar-viable: 94.5%
- Total buildings that are solar-viable: 300,390
- Median annual solar potential per viable roof: 19,511 kilowatt-hours

Photo Credit: Alamy Stock Photo
1. San Jose, CA
- Share of viable buildings with solar: 6.4%
- Total buildings with solar: 13,557
- Share of all buildings that are solar-viable: 96.6%
- Total buildings that are solar-viable: 210,786
- Median annual solar potential per viable roof: 21,543 kilowatt-hours
Detailed findings & methodology
Out of the top 15 large cities with the highest share of viable buildings with solar, nine are located in sunny California. On average, the share of viable buildings with solar among these 15 cities is 3.4 percent, almost triple the national rate of 1.2 percent. Additionally, these cities have a large percentage of buildings that are solar viable and the average annual solar potential per viable roof is 17,581 kilowatt-hours, well above the national value of 12,570 kilowatt-hours.
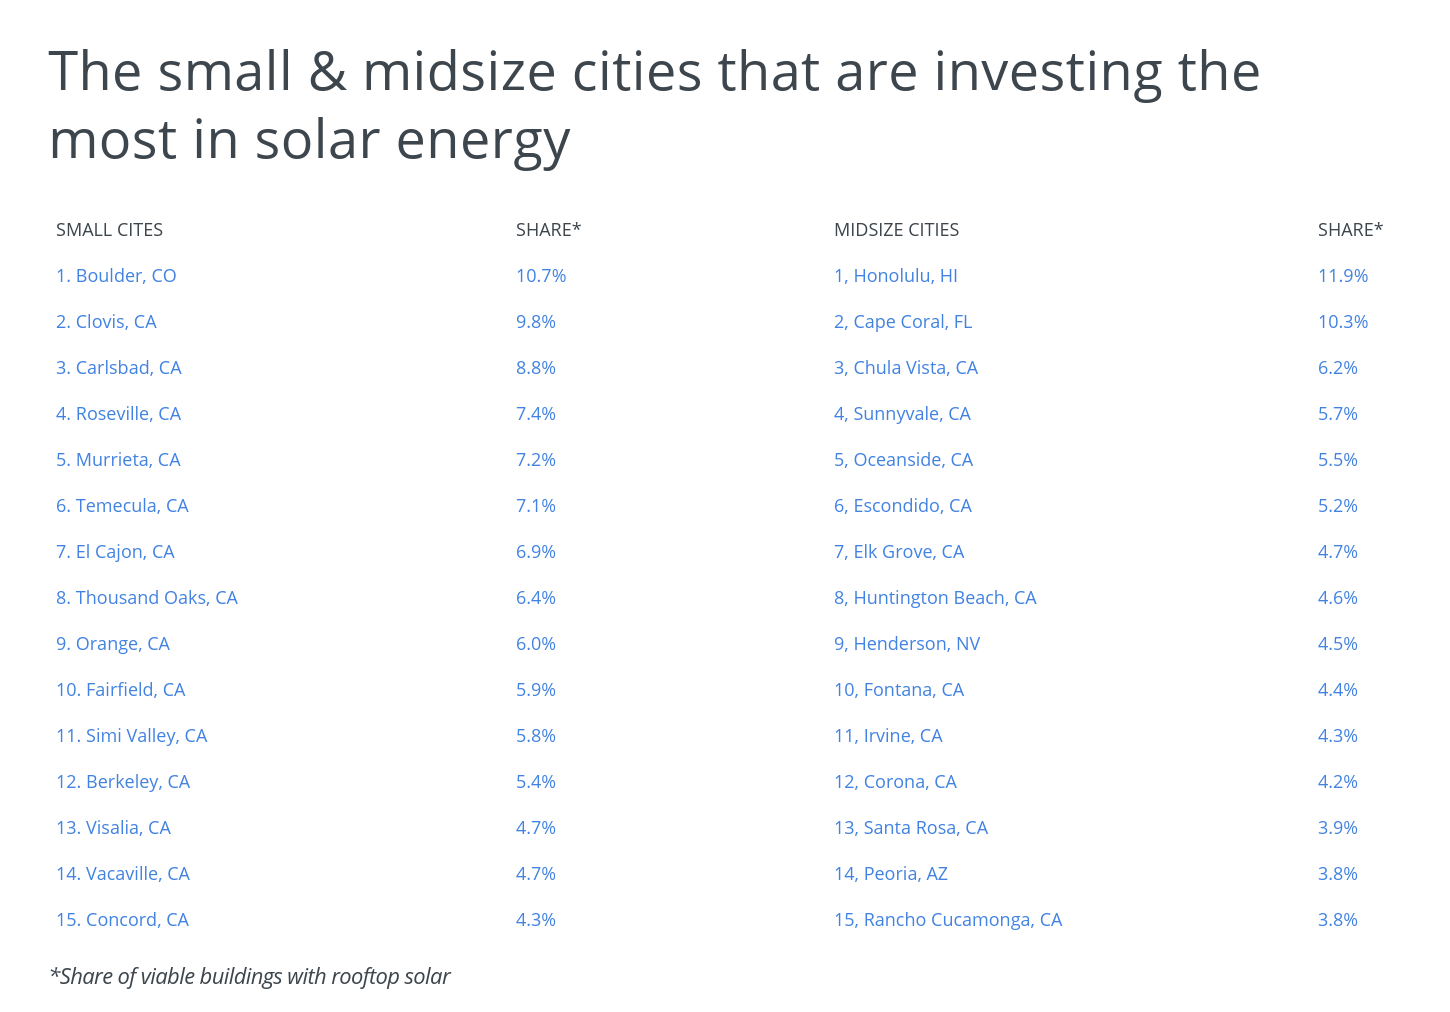
Similar to the large city group, many of the small and midsize cities with the largest share of viable buildings with solar are located in California. However, the city with the highest density of solar installations in the country is Honolulu, where nearly 12 percent of viable buildings have solar. Boulder ranks a close second, with 10.7 percent of its viable buildings having solar.
To determine the cities investing the most in solar energy, researchers at Porch analyzed the latest data from Google’s Project Sunroof. The researchers ranked cities according to the share of viable buildings with solar. In the event of a tie, the city with more buildings with solar was ranked higher. Researchers also looked at the share of all buildings that are solar-viable, the total buildings that are solar-viable, and the median annual solar potential per viable roof. For a roof to be solar-viable, it must be able to accommodate at least four adjacent solar panels, with a total potential installation size of at least 2kW. Additionally, each potential panel must receive at least 75 percent as much energy as an ideally oriented and unshaded panel in that county.
To improve relevance, only cities with at least 100,000 people were included in the analysis. Additionally, cities were grouped into the following cohorts based on population size:
- Small cities: 100,000-149,999
- Midsize cities: 150,000-349,999
- Large cities: more than 350,000


